
Lesson plans for 2.MD.10
Math · Grade 2 · Measurement & Data
10. Draw a picture graph and a bar graph (with single-unit scale) to represent a data set with up to four categories. Solve simple put-together, take-apart, and compare problems using information presented in a bar graph.
13 ready-to-teach lesson plans aligned to this standard. Each includes objectives, a materials list, vocabulary and step-by-step activities.
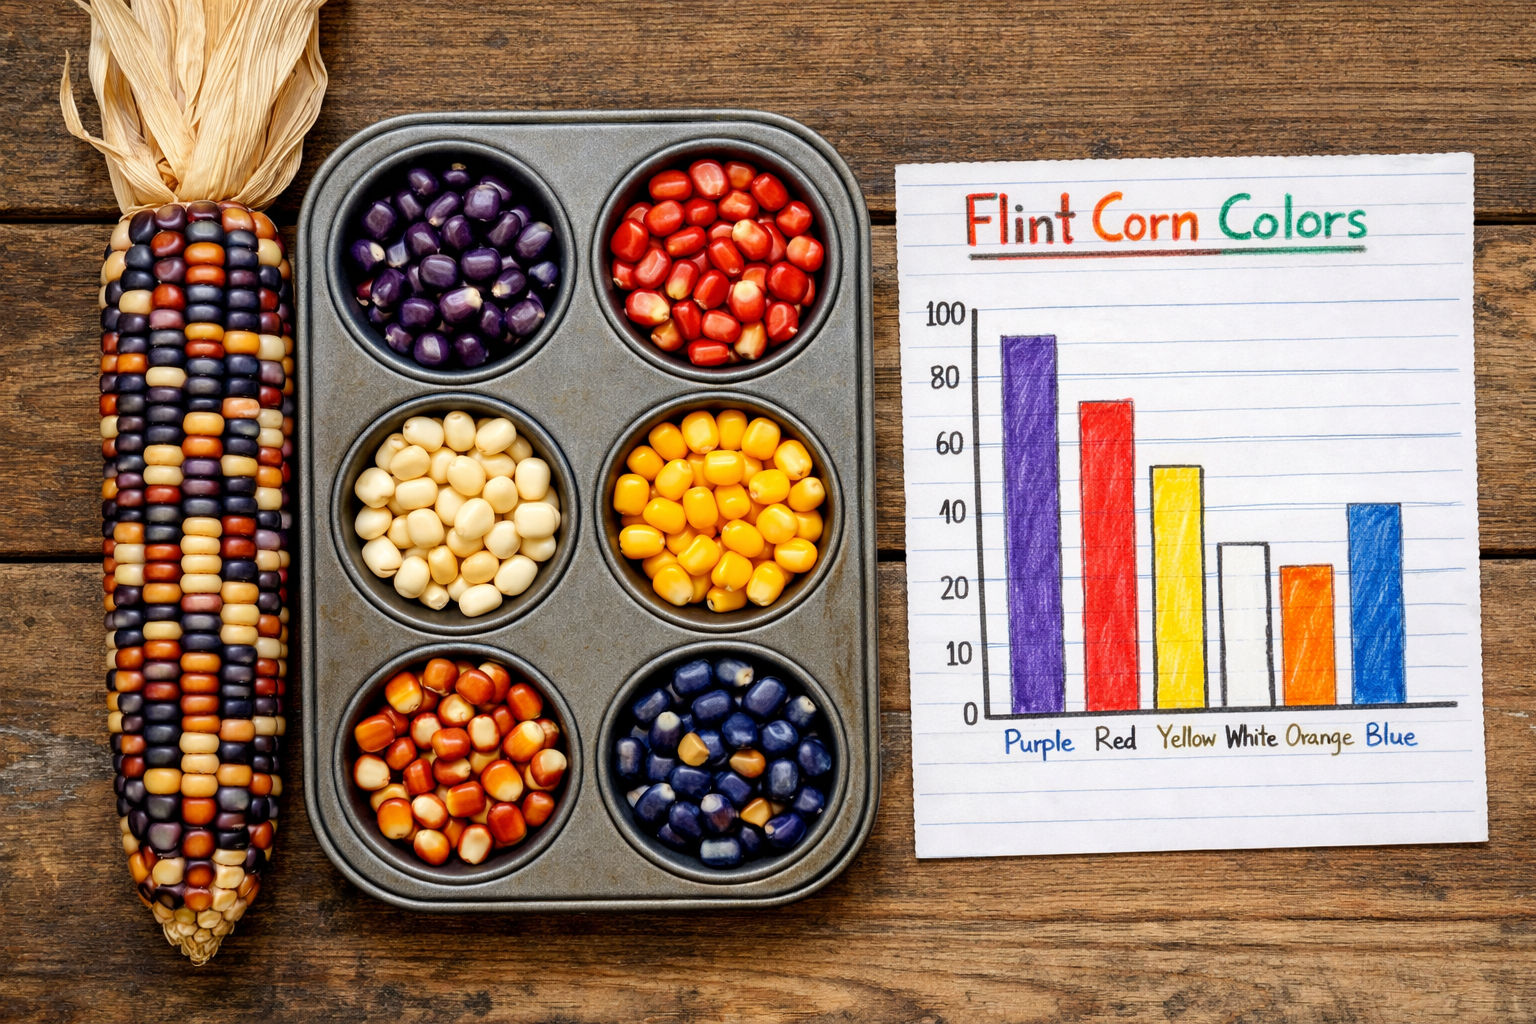
Harvest Corn Kernel Color Graph
Sort corn kernels by color and build a bar graph.
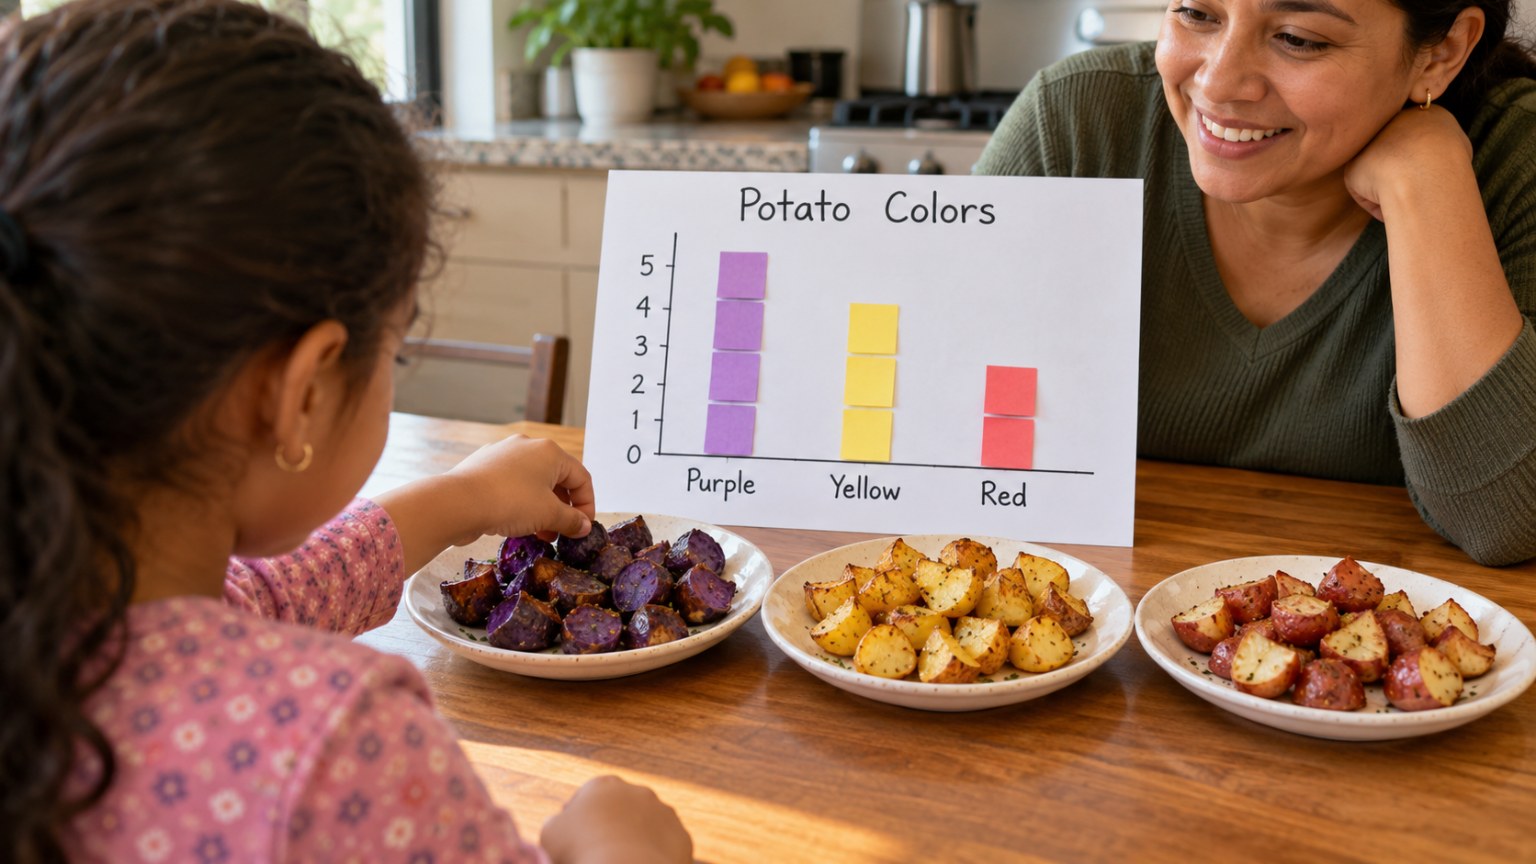
Machu Picchu Andean Potato Taste Test and Graph
Taste potatoes from the land of the Inca and graph favorites.
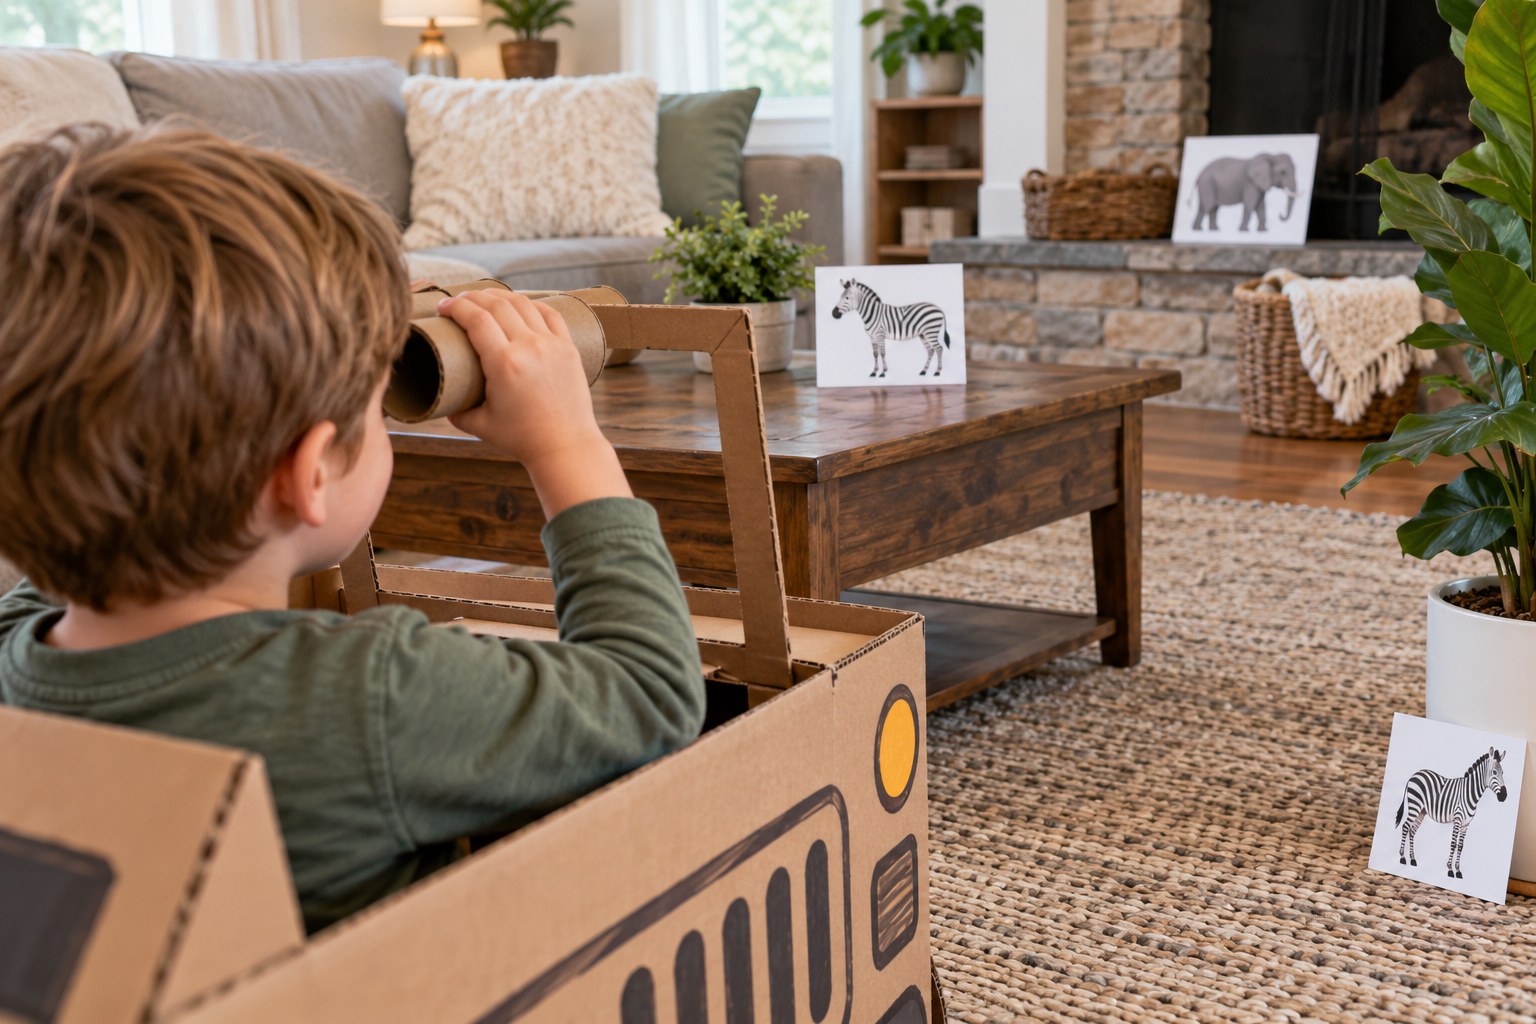
Safari Spotting Tally and Picture Graph
Spot hidden safari animals, tally them and graph them.
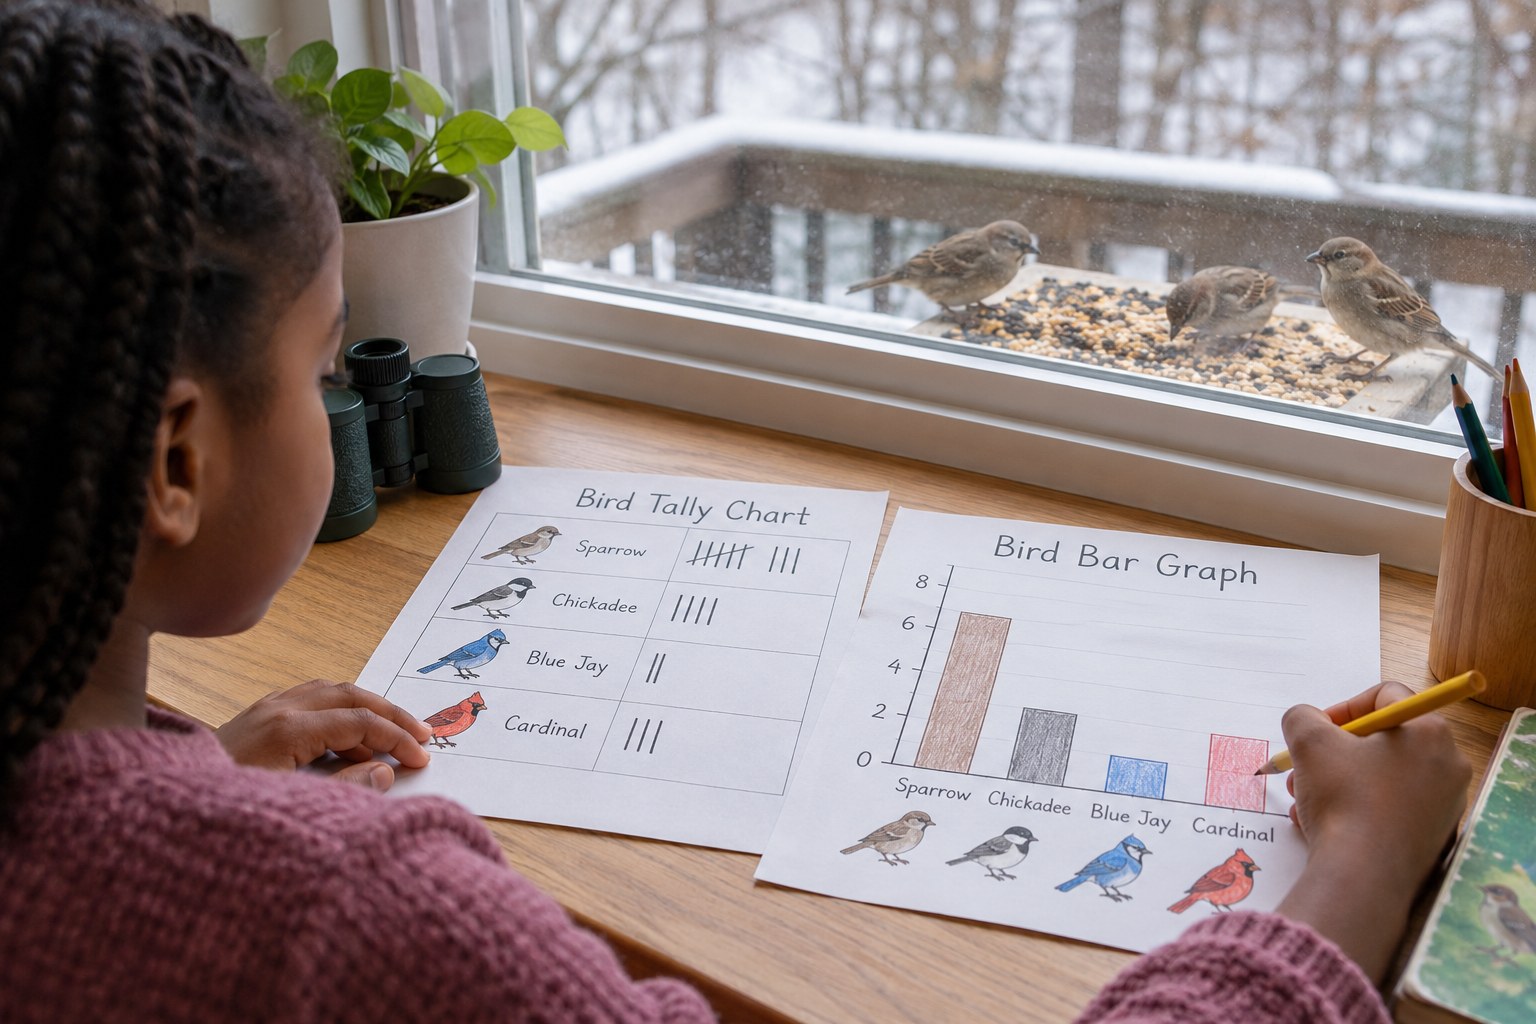
Winter Bird Watch: Tally and Graph Your Visitors
Tally winter birds from the window and graph what you saw.
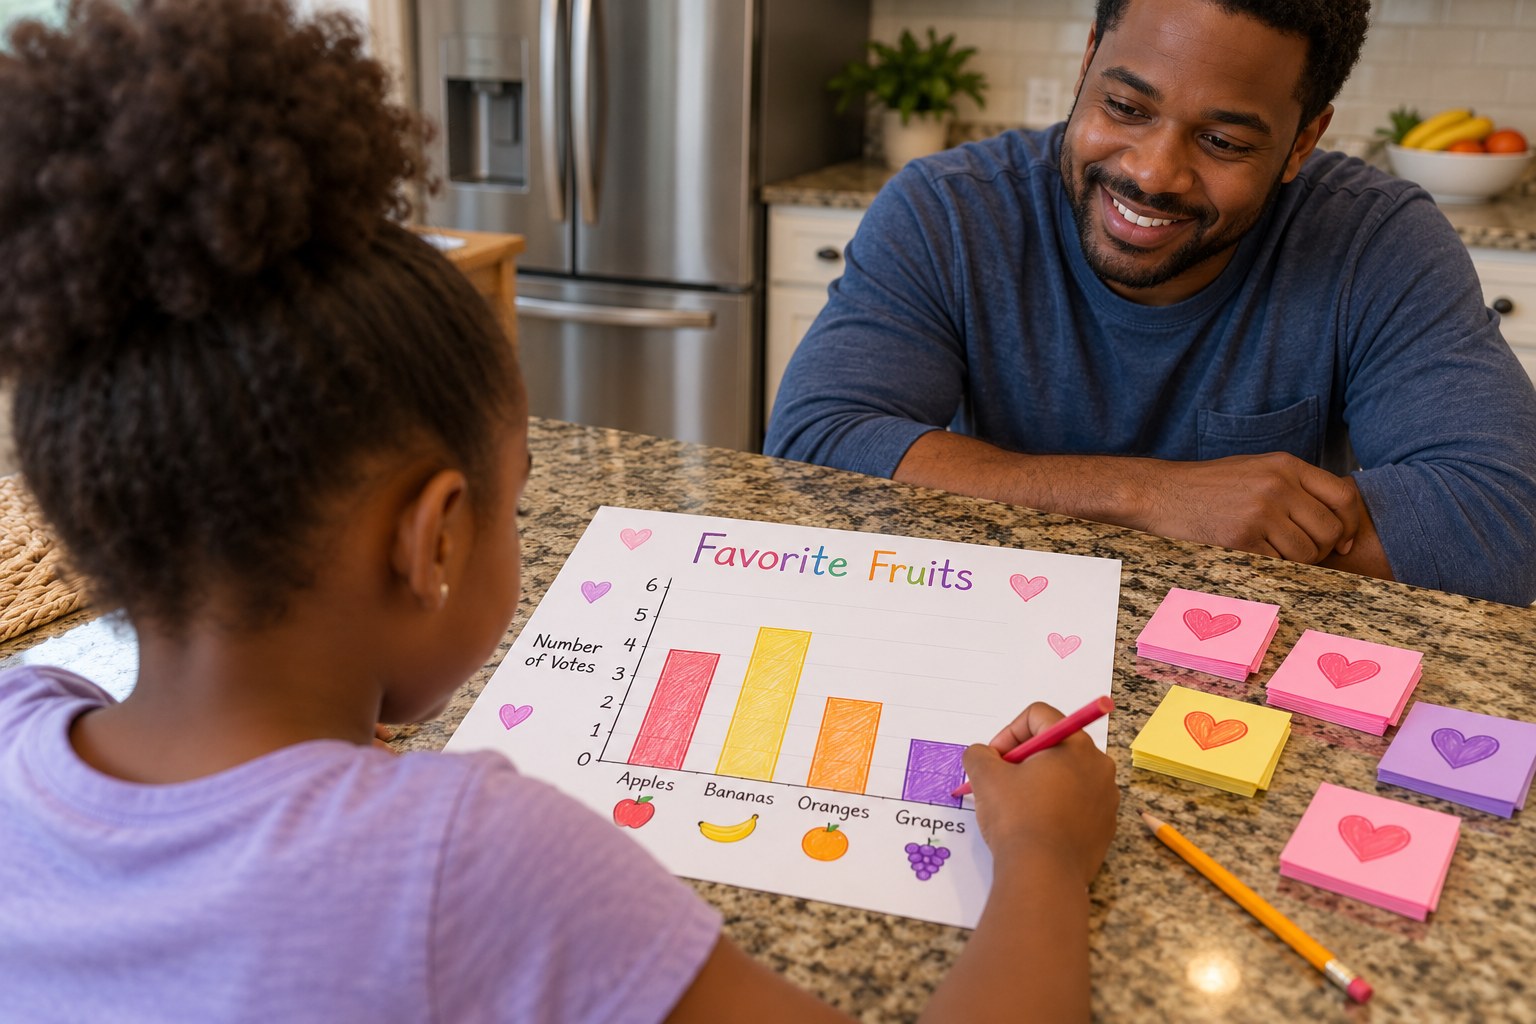
Favorite Things to Do Together: A Caregiver's Day Picture Graph
Survey your family and graph your favorite things to do together.
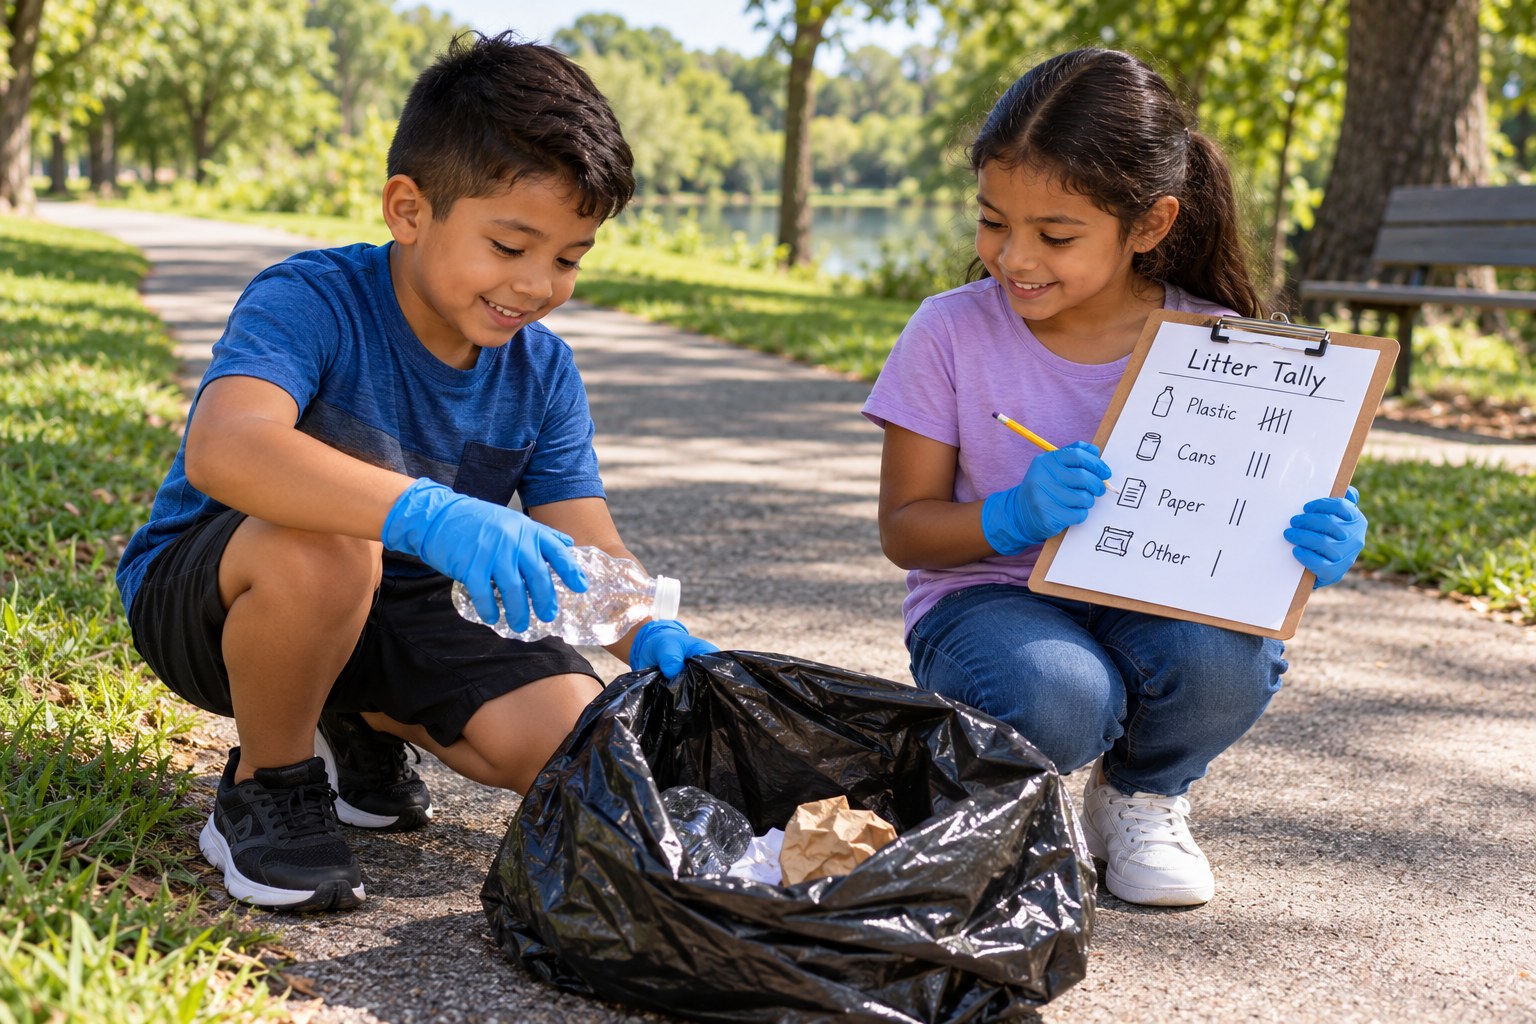
Earth Day Litter Tally and Picture Graph
Pick up litter, tally it and graph what you found.
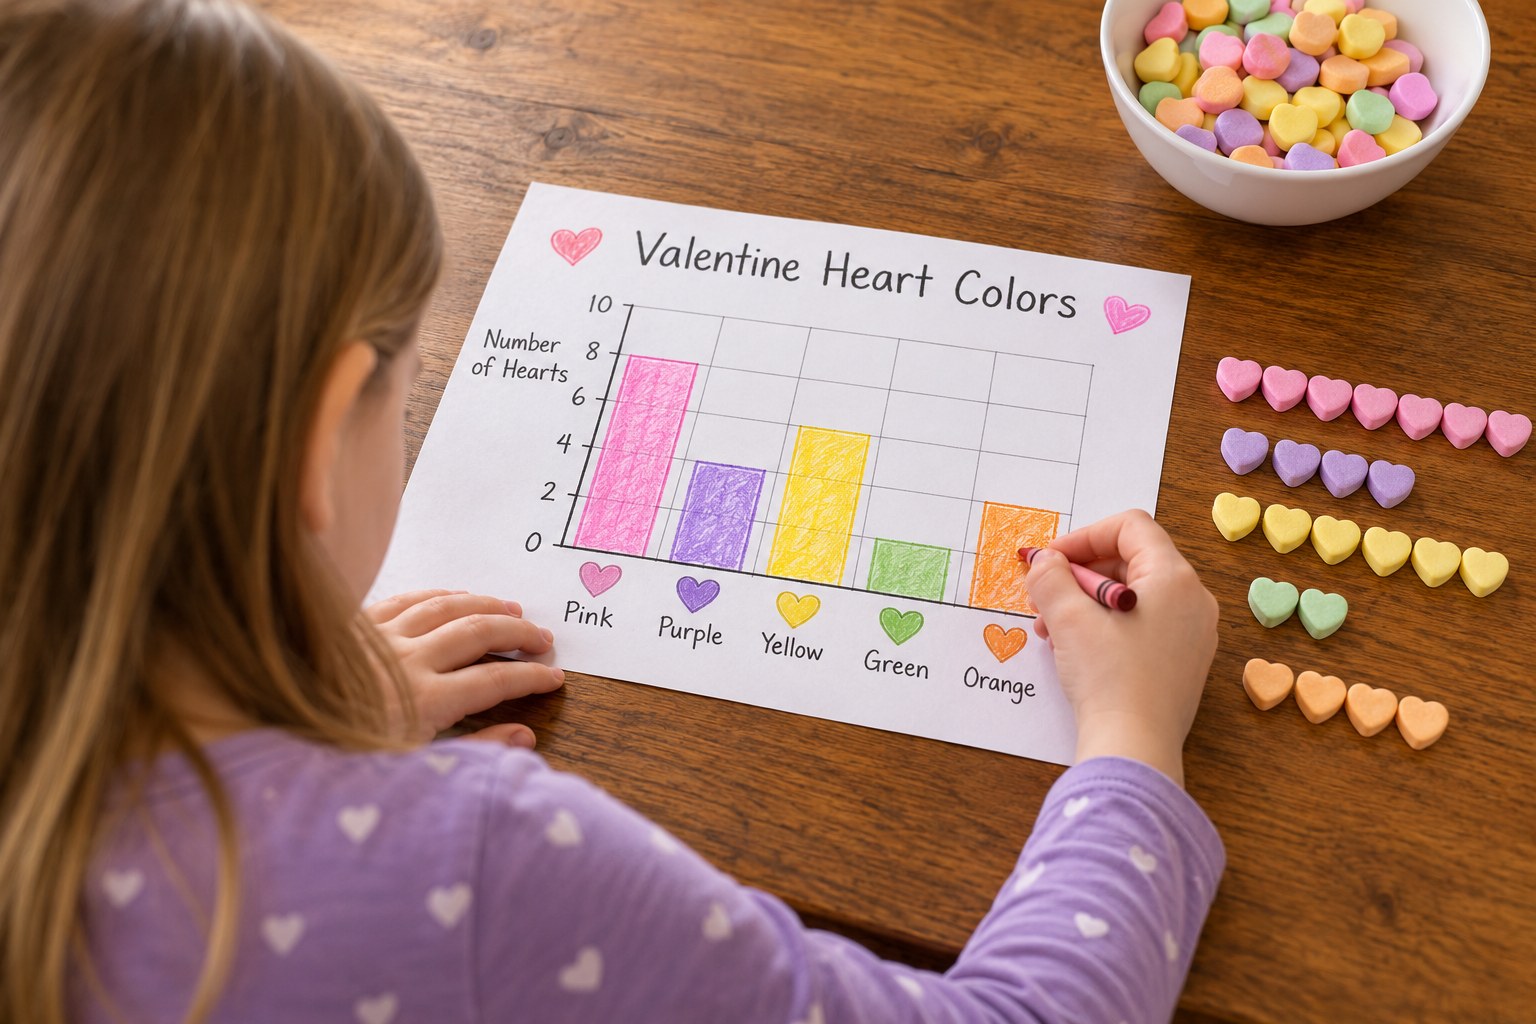
Valentine Candy Heart Color Graph
Sort, tally and graph a handful of Valentine hearts.
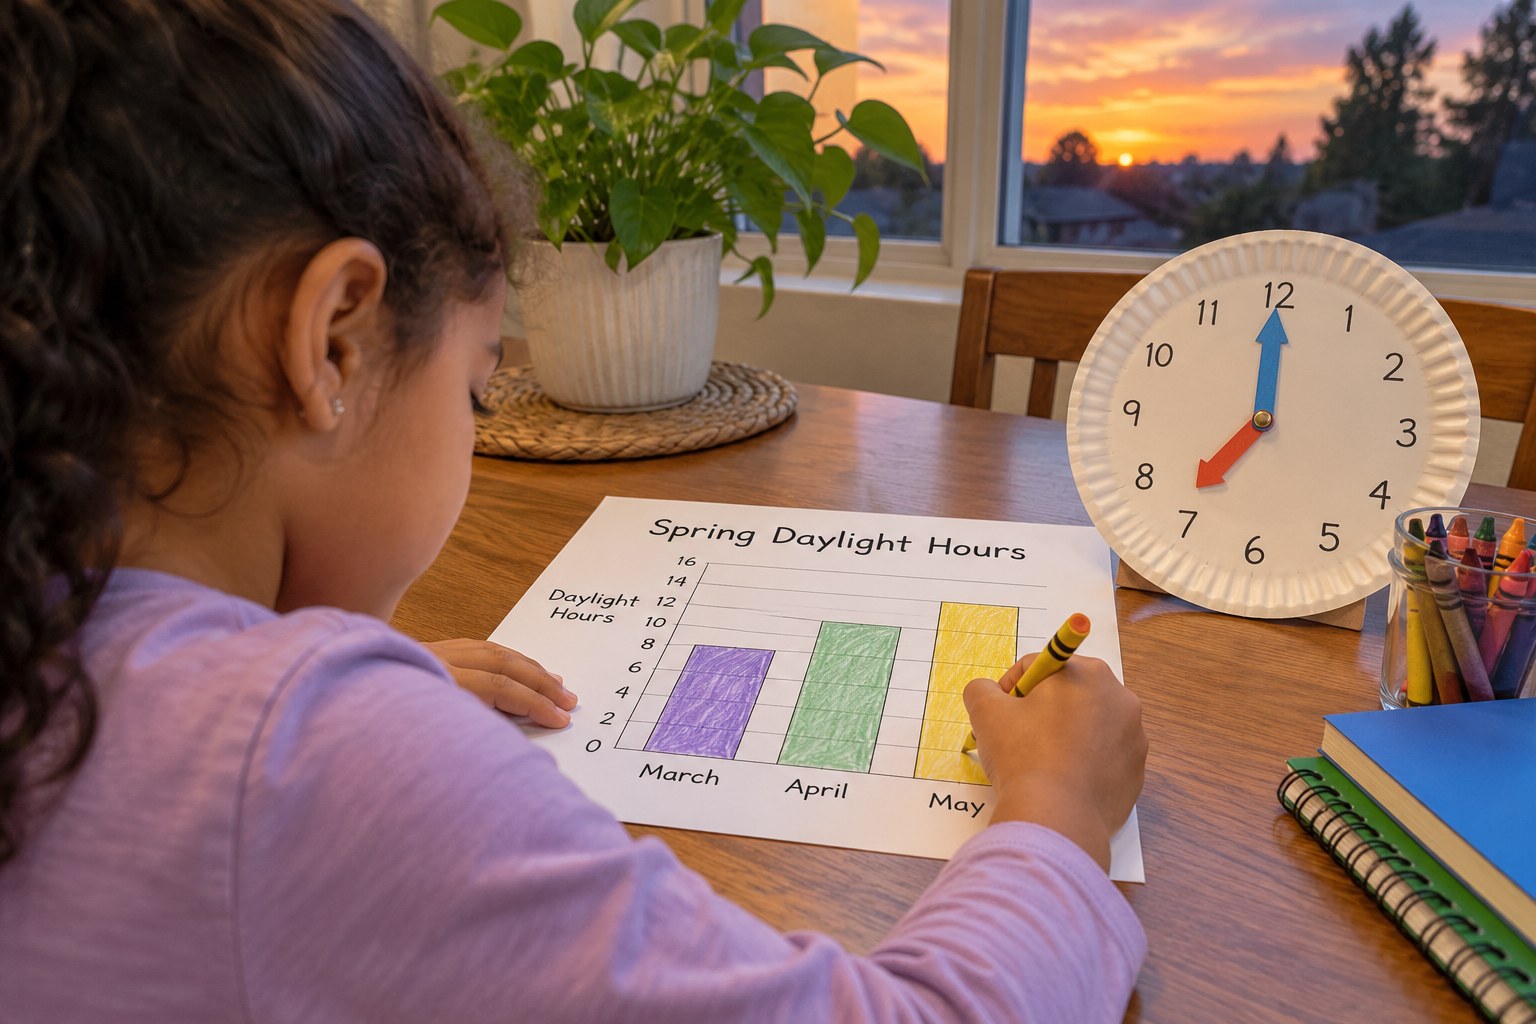
Spring Brings Longer Days: Sunrise Clocks and a Daylight Bar Graph
Graph how spring days grow longer each month.
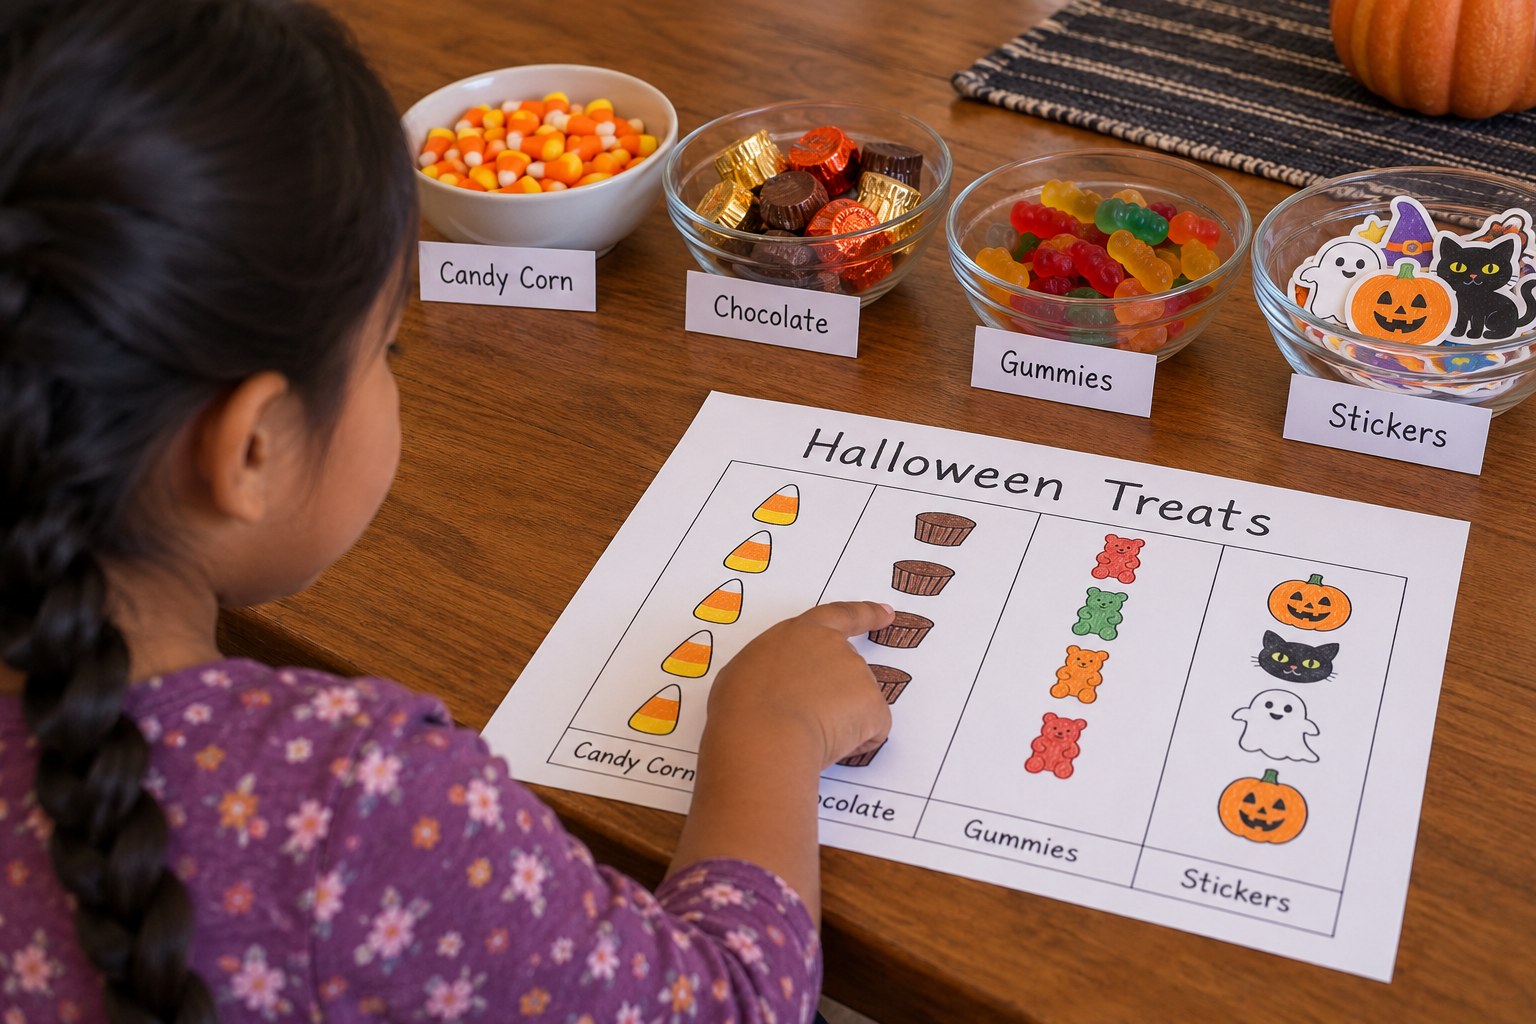
Halloween Treat Sort and Picture Graph
Sort a treat pile and build a picture graph.
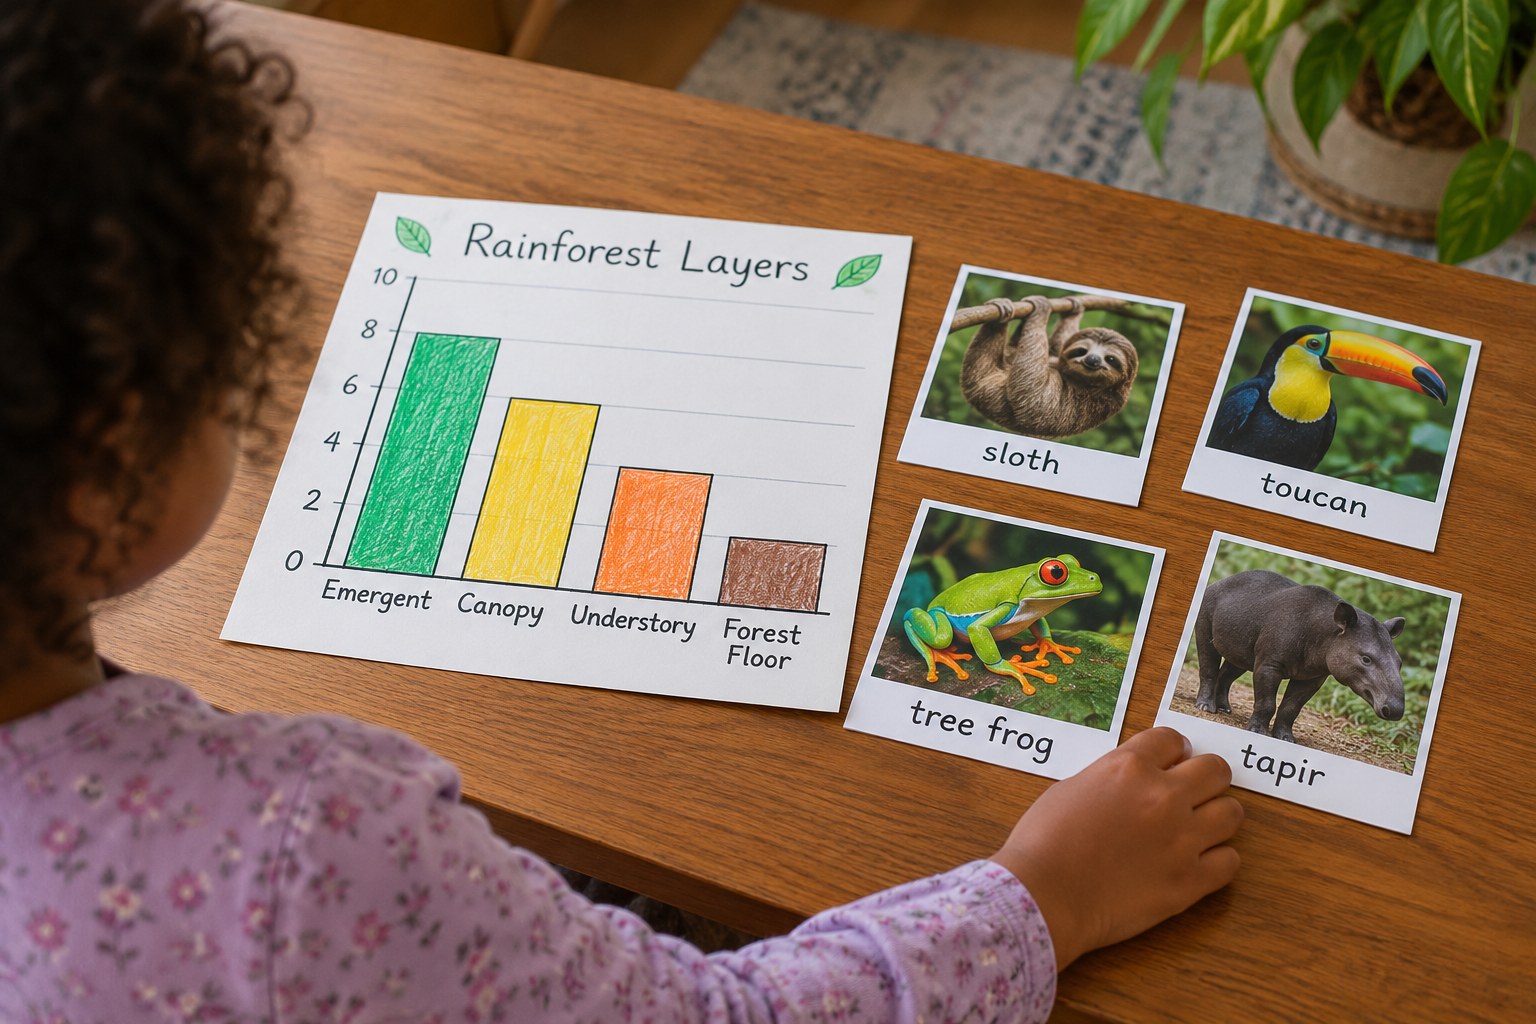
Who Lives Where? Rainforest Layer Graph
Sort rainforest animals by layer and graph them.
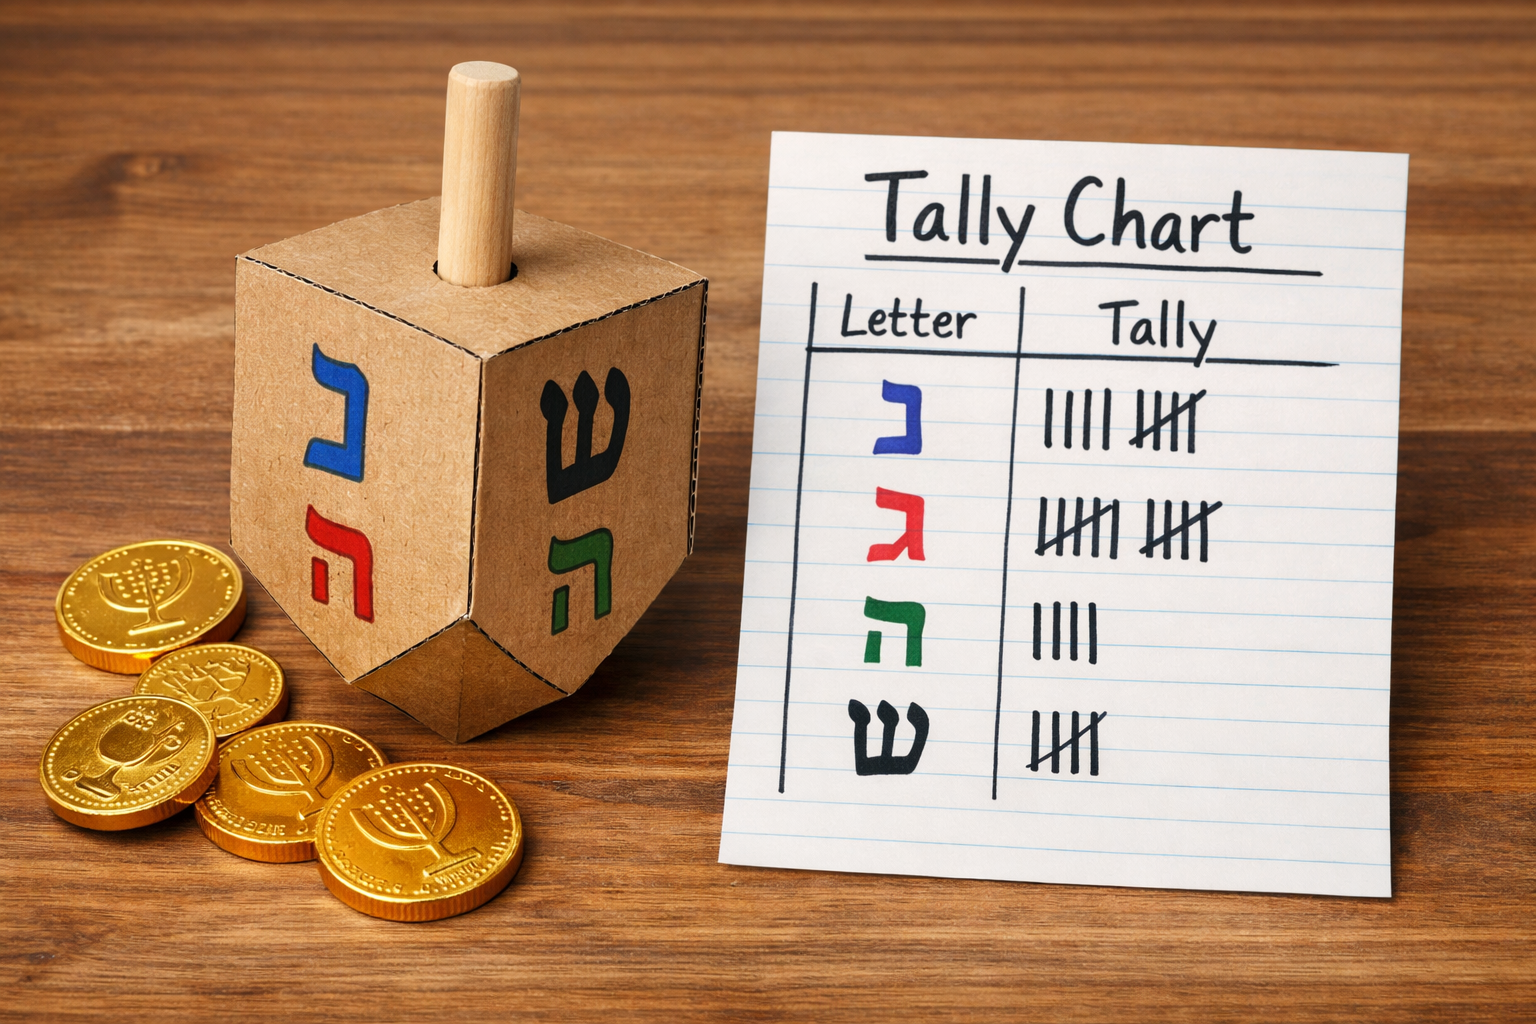
Hanukkah Dreidel Probability Game
Spin a homemade dreidel and graph the results.
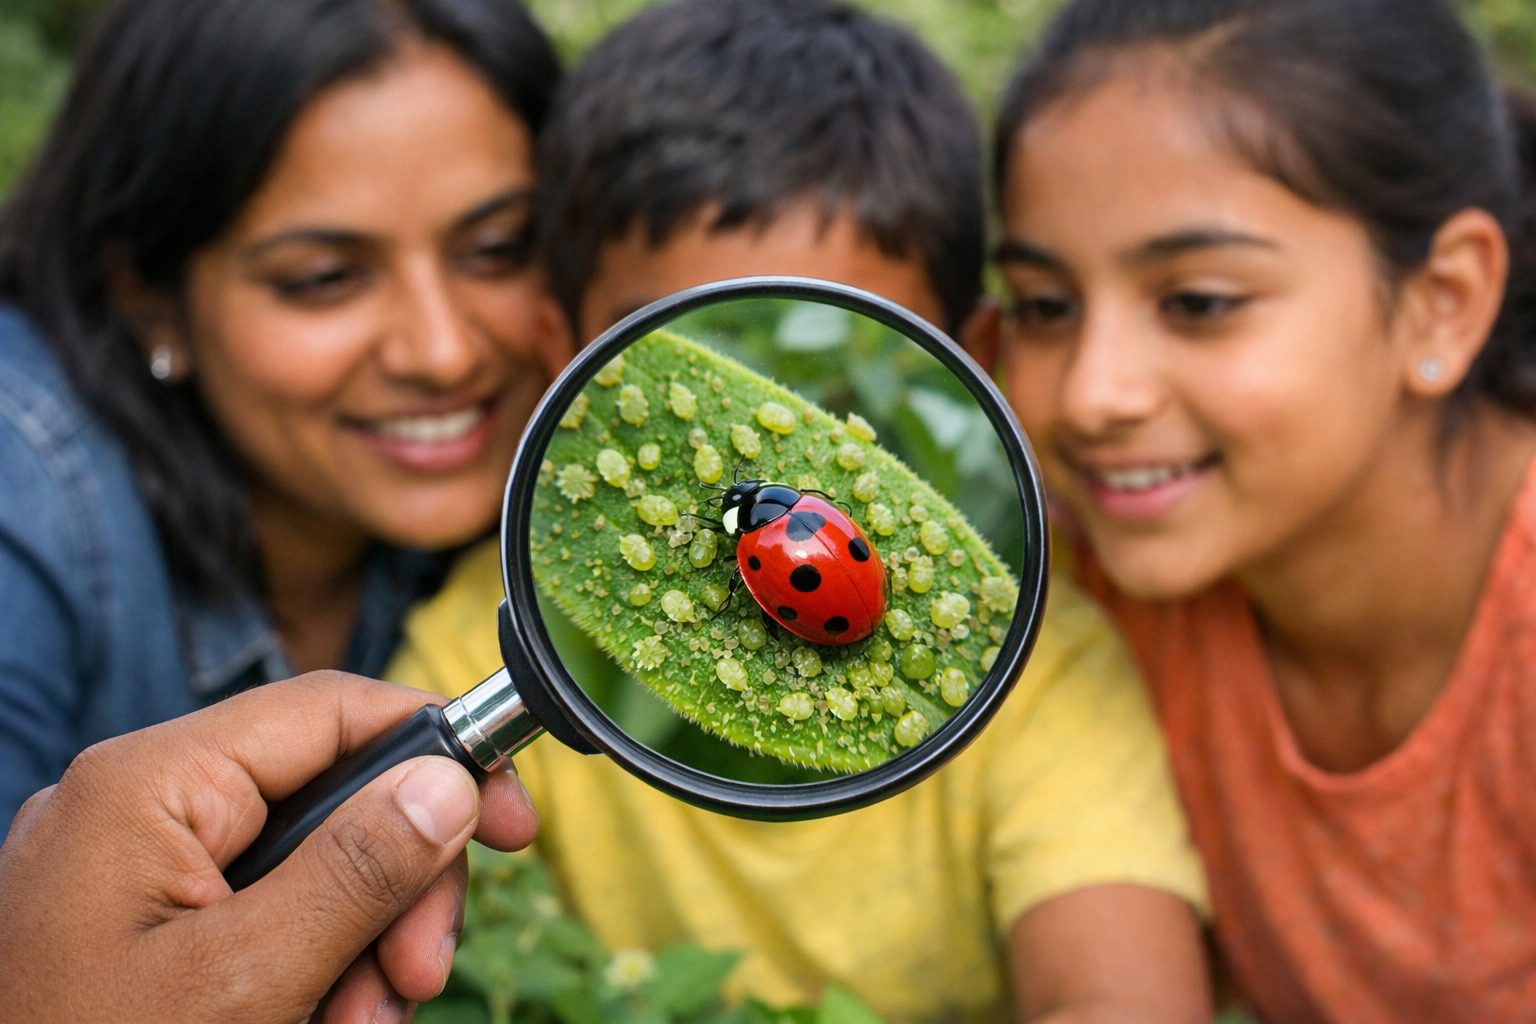
Ladybug Patrol: Garden Helpers and Pests
Hunt garden bugs and graph helpers versus pests.
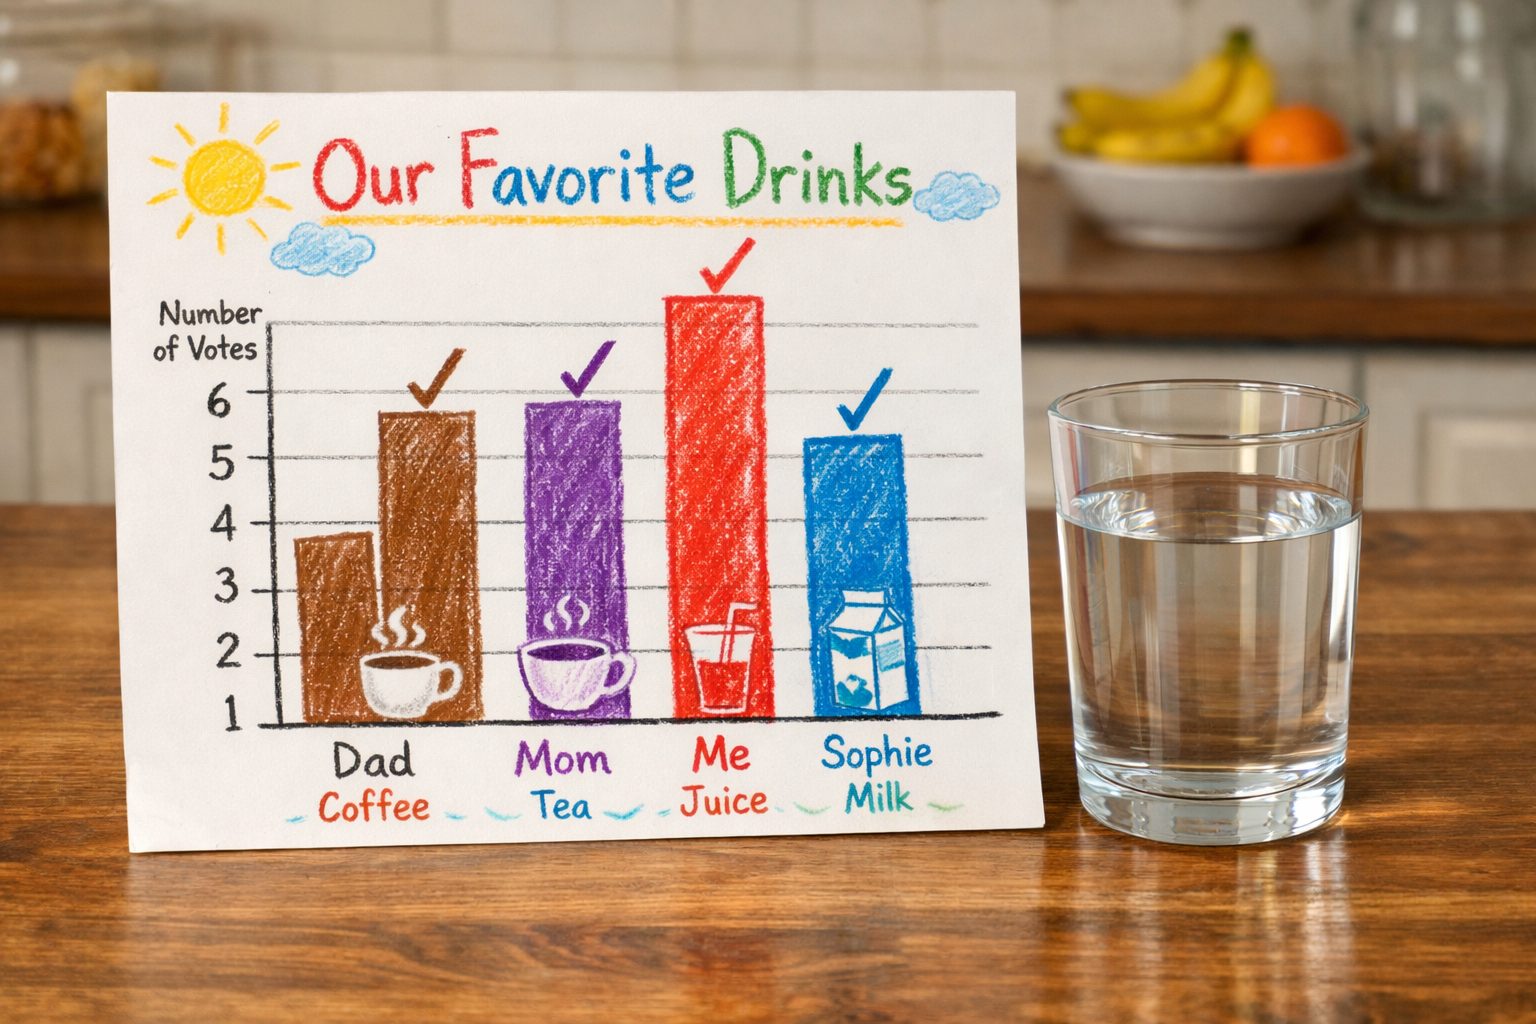
Sip Count: Daily Drinks Bar Graph
Tally the day's drinks and graph how much water wins.
See all grade 2 standards with lesson plans
Make a lesson like this in a minute
Pick a topic, grade, group size and length. Resource Portal AI writes the objectives, materials, steps and pictures.
Sign up FREEFree forever · no credit card needed. Members get all 5,100+ lessons for $14.99/month, with the first 7 days free.