Valentine Candy Heart Color Graph
Overview
Sort, tally and graph a handful of Valentine hearts.
Description
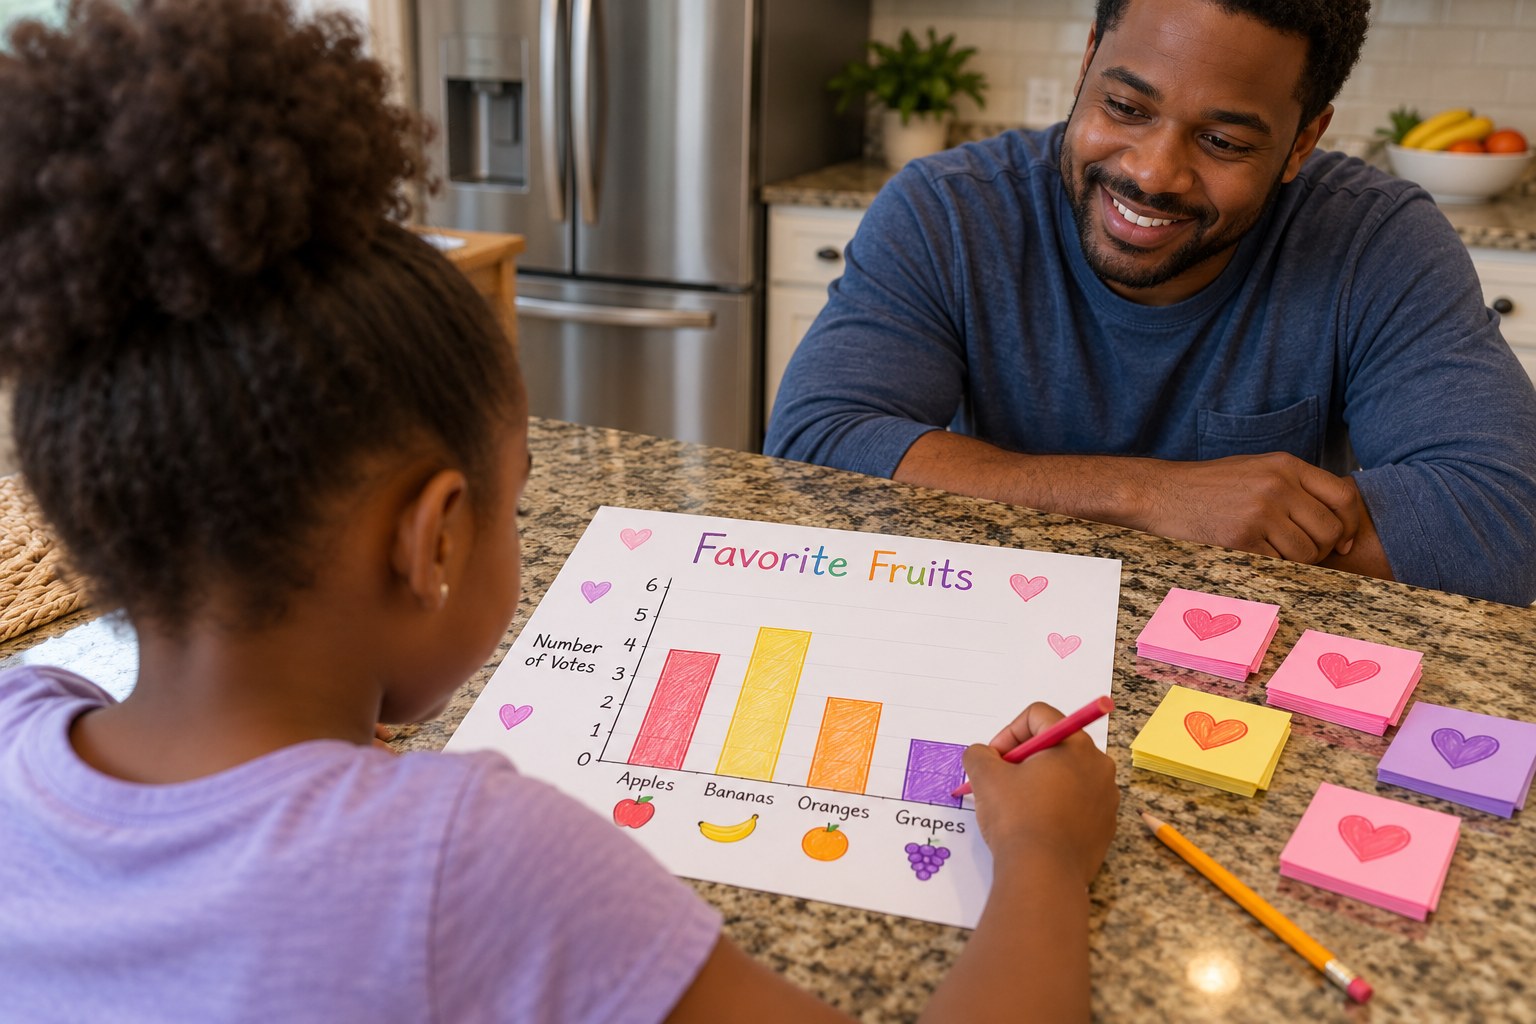
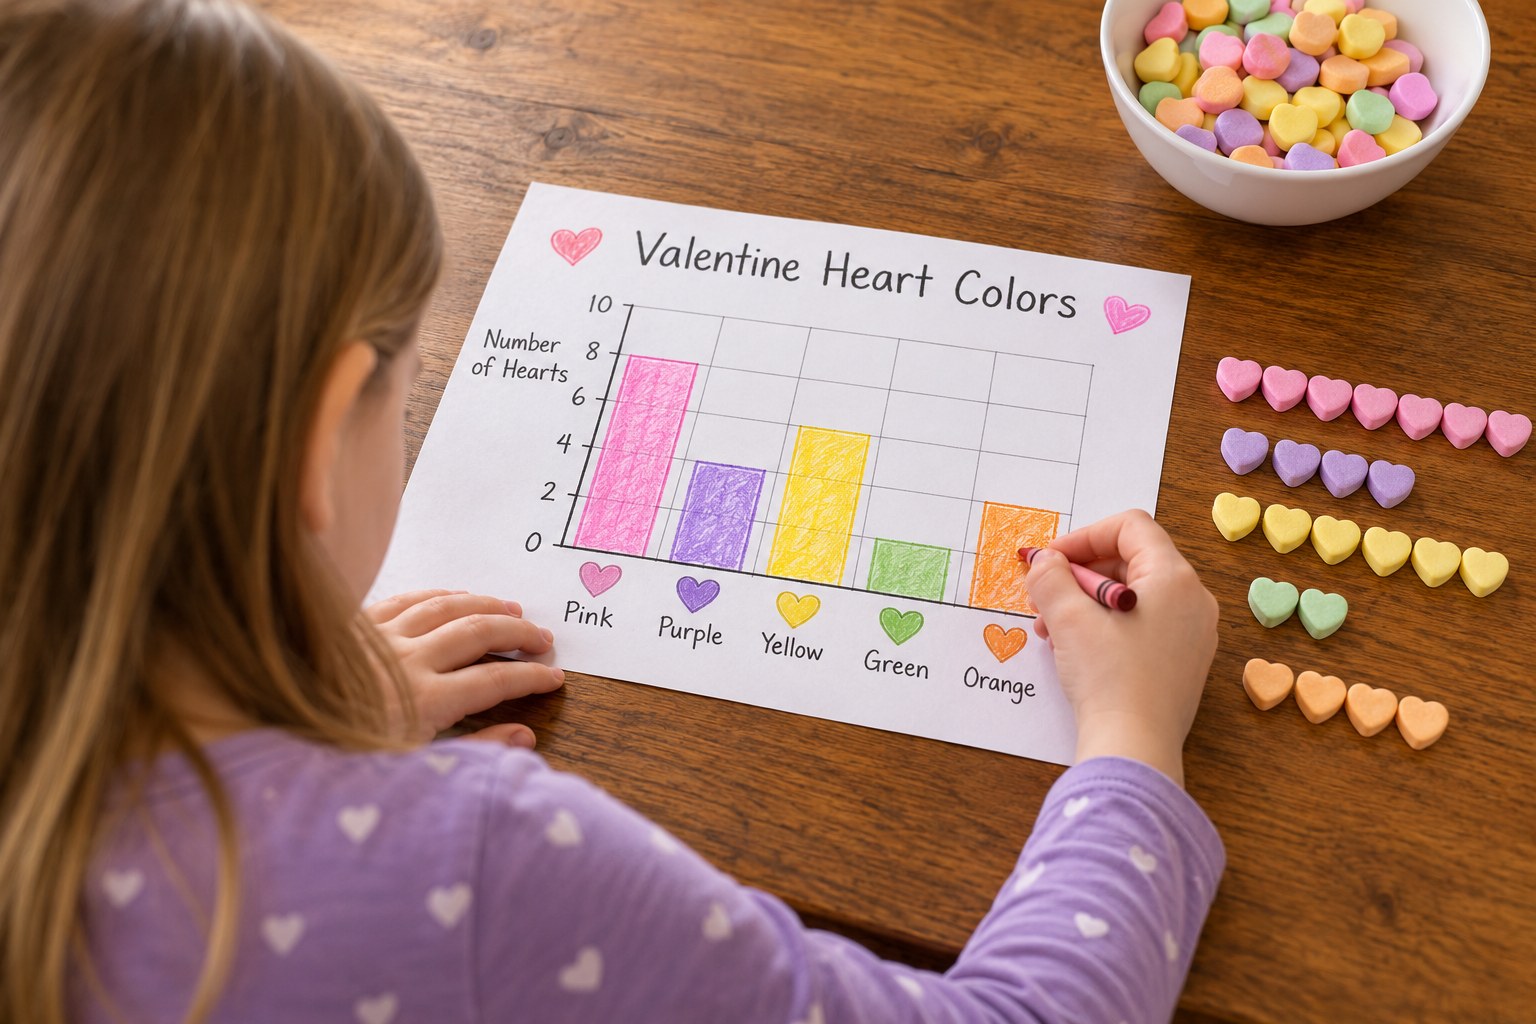
Your child sorts a handful of candy or paper Valentine hearts by color, tallies them, builds a bar graph, and answers how-many-more and how-many-fewer questions about their own data.
Objective
Your child will sort hearts into color categories, show the data on a bar graph, and answer questions about the total, each category, and how many more or fewer are in one category than another.
Standards
Materials
| Item | Quantity |
|---|---|
| Conversation candy hearts, or small paper hearts in 3-4 colors (adult cuts) | about 20 per child |
| Graph paper or the bar graph grid from the Graph template section | 1 sheet per child |
| Crayons in the same colors as the hearts | 1 set |
| Small cup or bowl | 1 per child |
| Pencil | 1 per child |
Vocabulary
Preparation
- Check for food allergies and decide whether hearts will be eaten; use paper hearts if candy is not a good fit for your family or group.
- Draw a bar graph grid for each child: 4 columns across the bottom (one per color) and numbers 1 to 10 up the side, or copy the template below.
- Put about 20 hearts in each child's cup without counting them exactly.
Introduction
Shake a cup of hearts and spill them out. Ask: which color do you think we have the most of? Make a guess and write it down before you count.
How could we find out which color has the most without counting all of them at once?
What is a graph for?
Steps
Conclusion
Ask your child to tell a family member one fact from their graph, like 'I had 3 more pink than green.' Graphs help us see information fast.
Make your own lesson plan in minutes
Describe a topic and Resource Portal AI writes the objectives, materials and steps for your group.
Try Resource Portal AI