Lesson planWinter Bird Watch: Tally and Graph Your Visitors
Math35 minutesGrades: K, 1st, 2nd
Overview
Tally winter birds from the window and graph what you saw.
Description
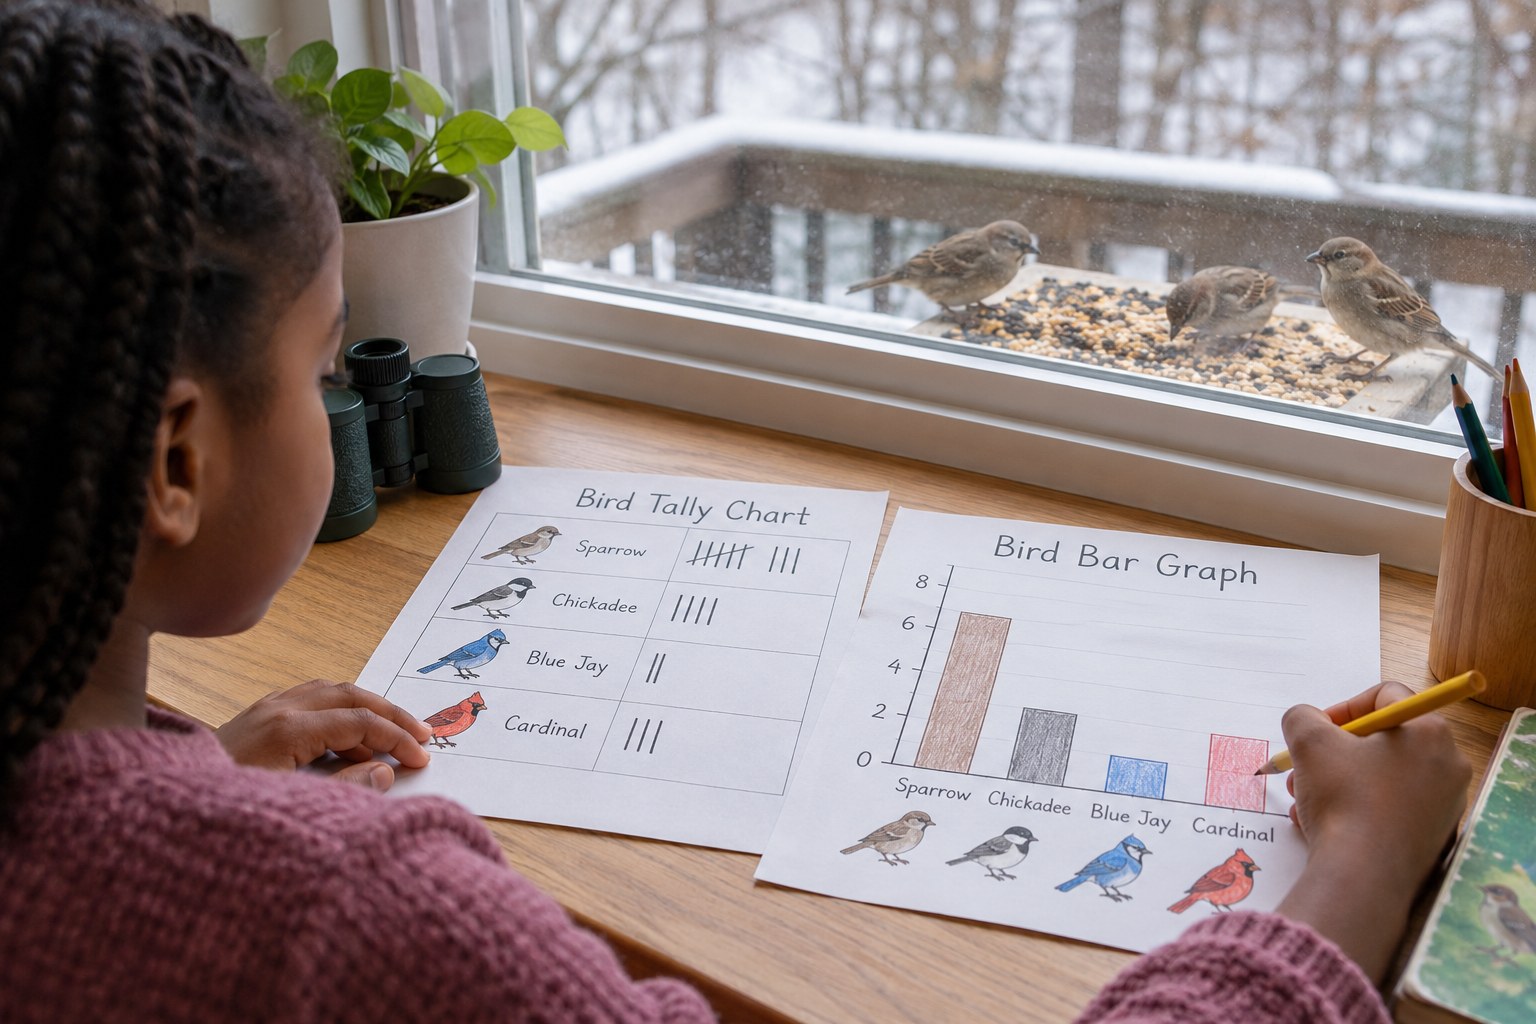
Your child watches birds from a window or yard for 15 minutes on a winter day, tallies the birds they see in 3 or 4 simple groups (small brown birds, black birds, pigeons and doves, other), then makes a picture graph or bar graph and answers questions about it.
Objective
Your child will sort and count birds into categories with tally marks, show the data in a graph and answer how-many and how-many-more questions.
Standards
1.MD.4Math · Grade 1 · Measurement & Data Organize, represent, and interpret data with up to three categories; ask and answer questions about the total number of data points, how many in each category, and how many more or less are in one category than in another.
2.MD.10Math · Grade 2 · Measurement & Data 10. Draw a picture graph and a bar graph (with single-unit scale) to represent a data set with up to four categories. Solve simple put-together, take-apart, and compare problems using information presented in a bar graph.
K.MD.3Math · Grade K · Measurement & Data Classify objects into given categories; count the numbers of objects in each category and sort the categories by count.
Materials
| Item | Quantity |
|---|
| Window or yard spot with a view of trees, a fence or a feeder | 1 |
| Paper and pencil for tallies | 1 per child |
| Graph paper or plain paper with a hand-drawn grid | 1 per child |
| Crayons | 1 set |
| Timer | 1 |
| Optional: a little birdseed or bread crumbs on a plate outside, set out a day early | 1/2 cup |
Vocabulary
Tally mark
A short line drawn to count one thing; every fifth mark crosses the other four.
Category
A group of things that are alike in some way.
Graph
A picture that shows numbers so they are easy to compare.
Migrate
To travel to another place for part of the year, often to find food or warmer weather.
Preparation
- A day before, put a plate of birdseed outside where you can see it from a window, if possible.
- Draw a tally chart with 3 or 4 rows: small brown birds, black birds, pigeons and doves, other birds. Use 3 rows for kindergarten and first grade.
Introduction
Tell your child that in winter some birds fly south, but many birds stay or even arrive here for the winter, like flocks of blackbirds and sparrows in the Central Valley. Ask how many birds they think they'll see in 15 minutes.
Why might birds be harder to find food for in winter?
What kinds of birds do you see near our home?
Steps
1Step 1
Practice tally marks
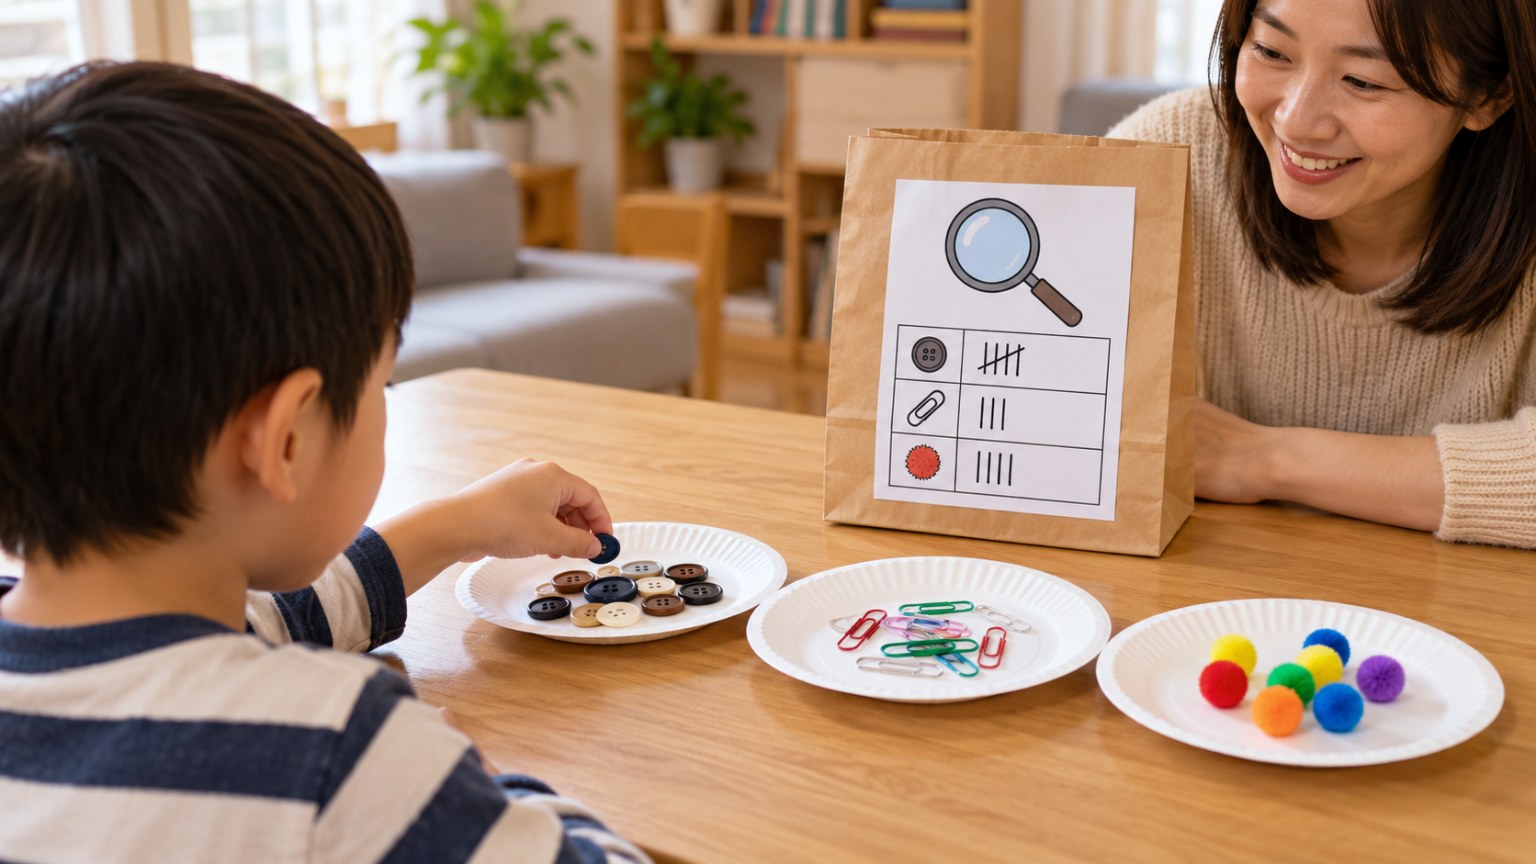
(5 min) Show your child how to make tally marks and bundle every fifth one with a slash across. Practice by tallying 12 claps together.
2Step 2
Bird watch
(15 min) Set the timer and watch quietly from the window or a still spot outside. Each time a bird lands, your child decides its category and makes a tally mark in that row.
3Step 3
Make the graph
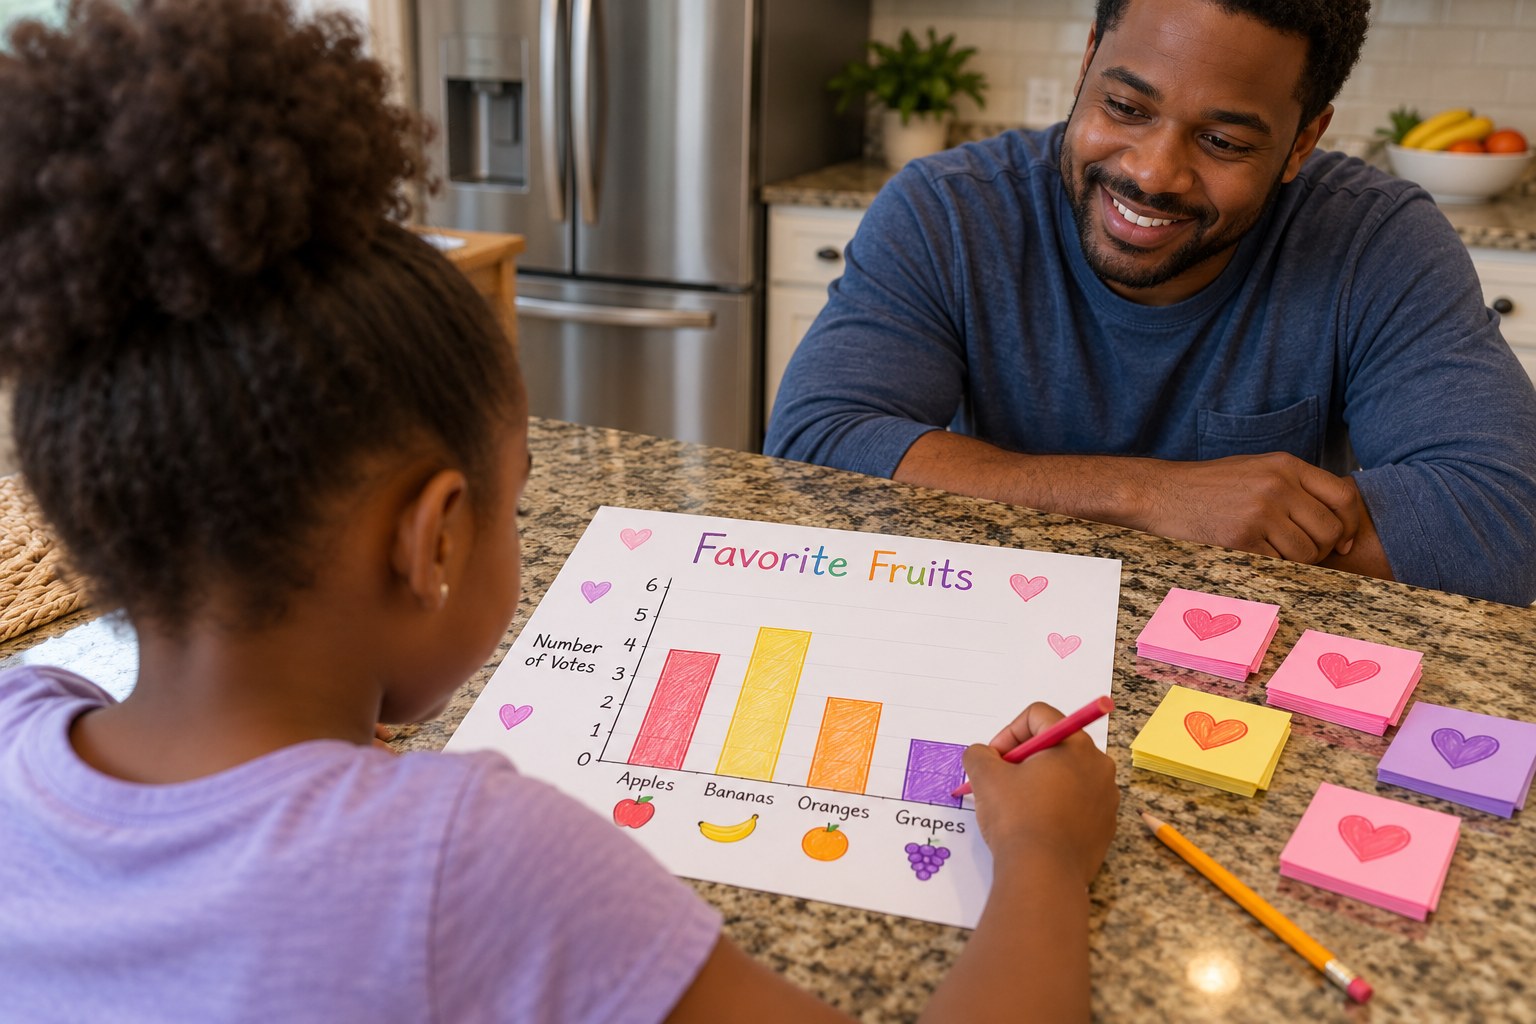
(8 min) Count each row of tallies and write the number. Kindergartners color one box per bird in a picture graph, and first and second graders make a bar graph with a title and labeled rows.
4Step 4
Ask questions about the data
(5 min) Your child answers questions such as which group had the most, how many birds in all, and how many more brown birds than black birds. Second graders write one more question for you to answer.
Conclusion
Ask: was your estimate close? Repeat the watch on a rainy day or a sunny afternoon and compare the two graphs.
Make your own lesson plan in minutes
Describe a topic and Resource Portal AI writes the objectives, materials and steps for your group.
Try Resource Portal AI