Sports Day Ball Bin: Sort, Count and Graph
Overview
Sort the sports balls, count them and build a graph.
Description
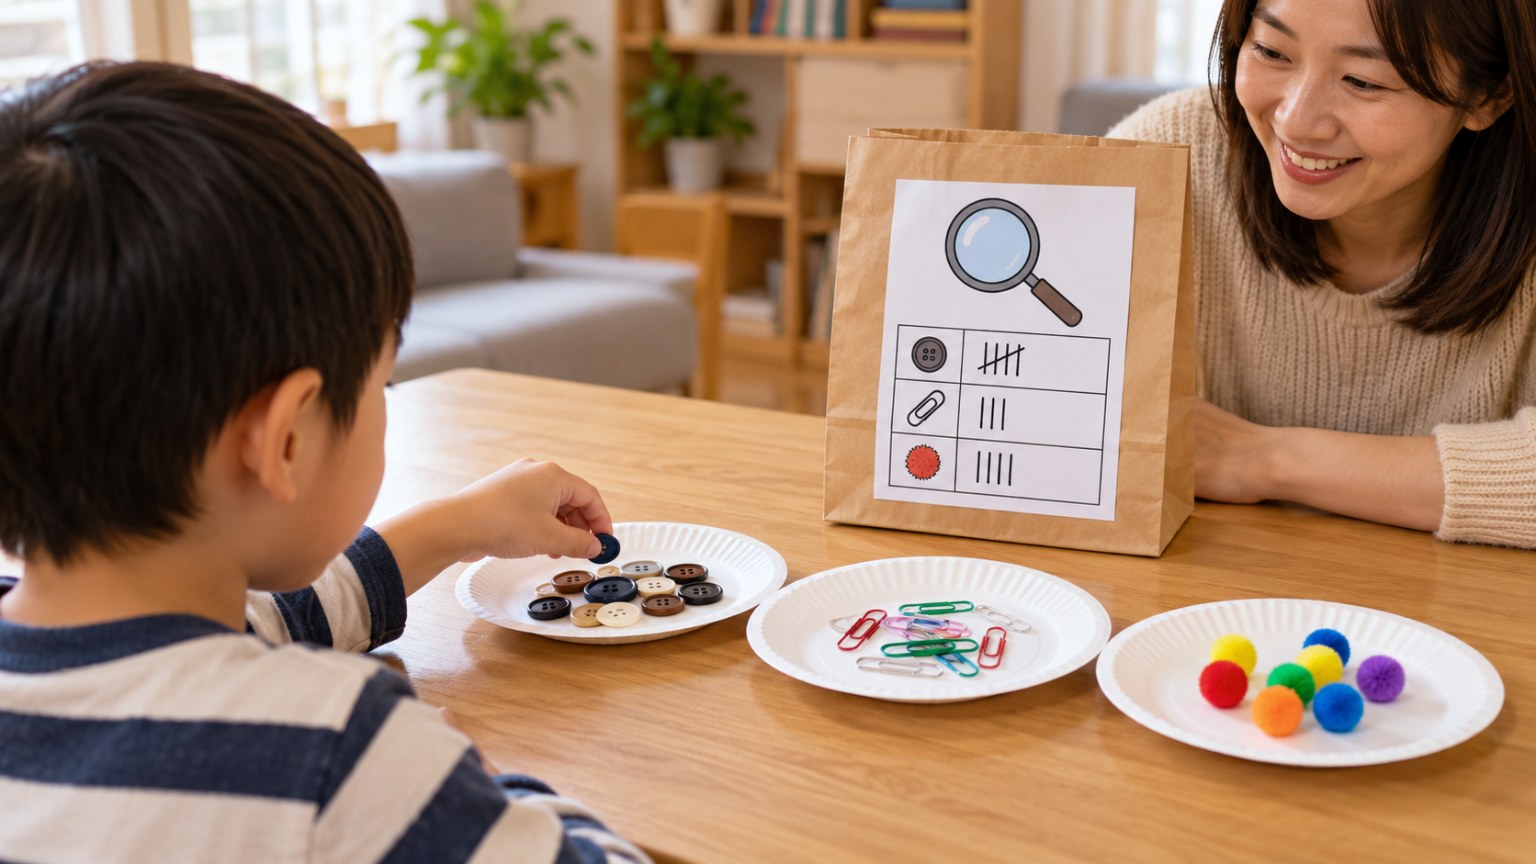
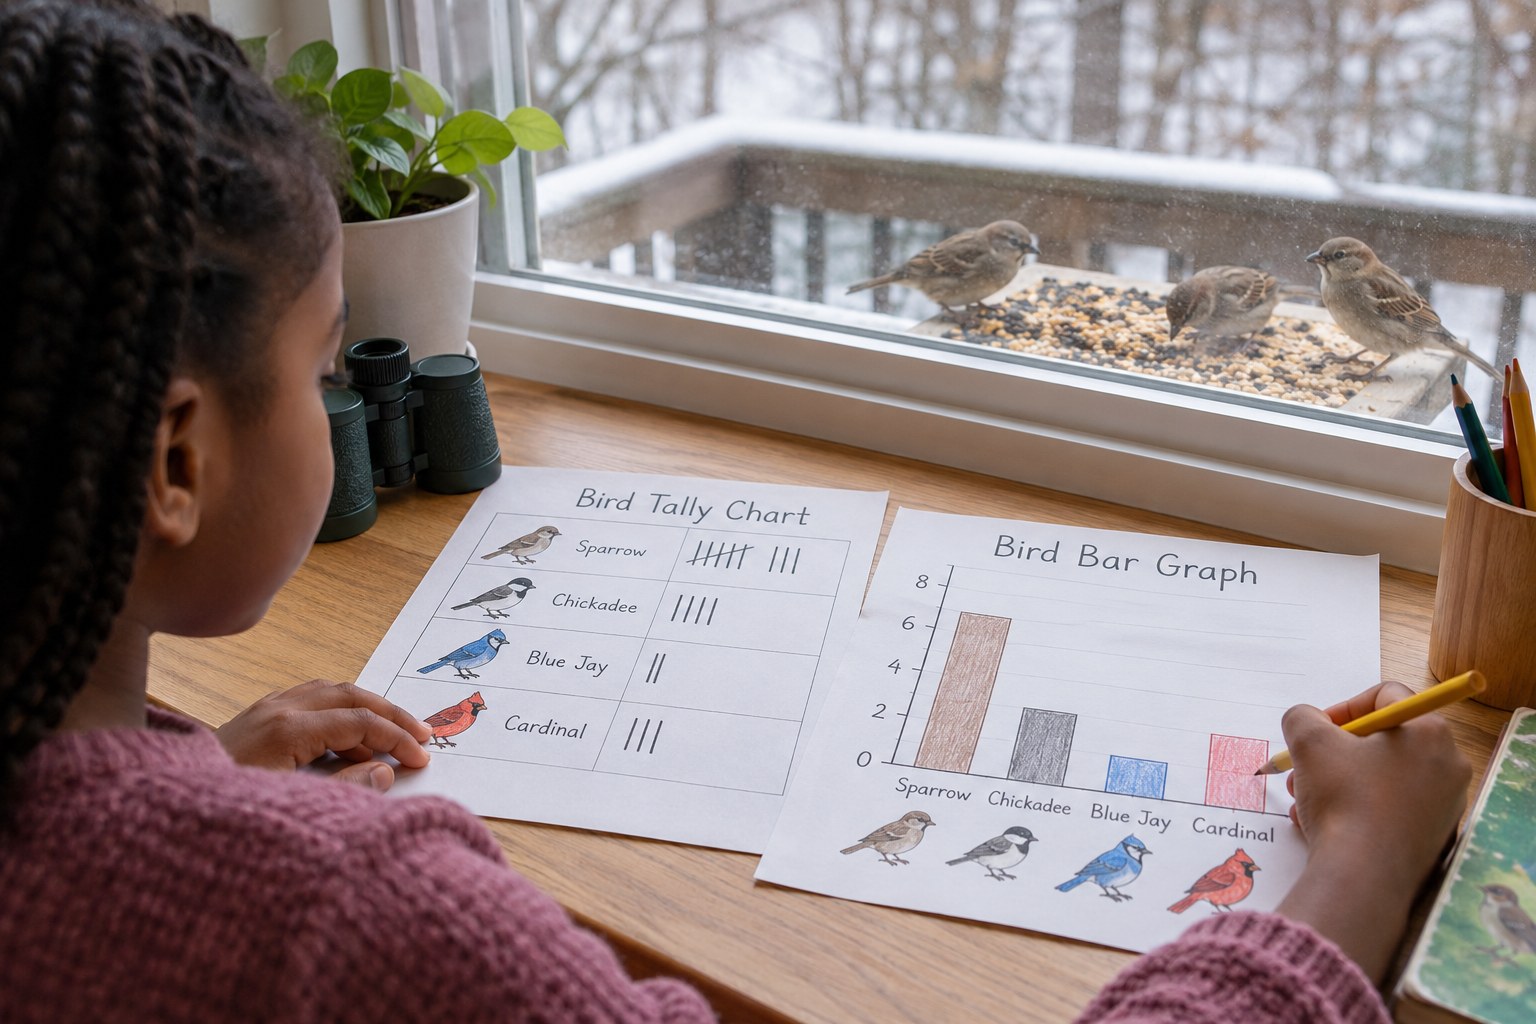
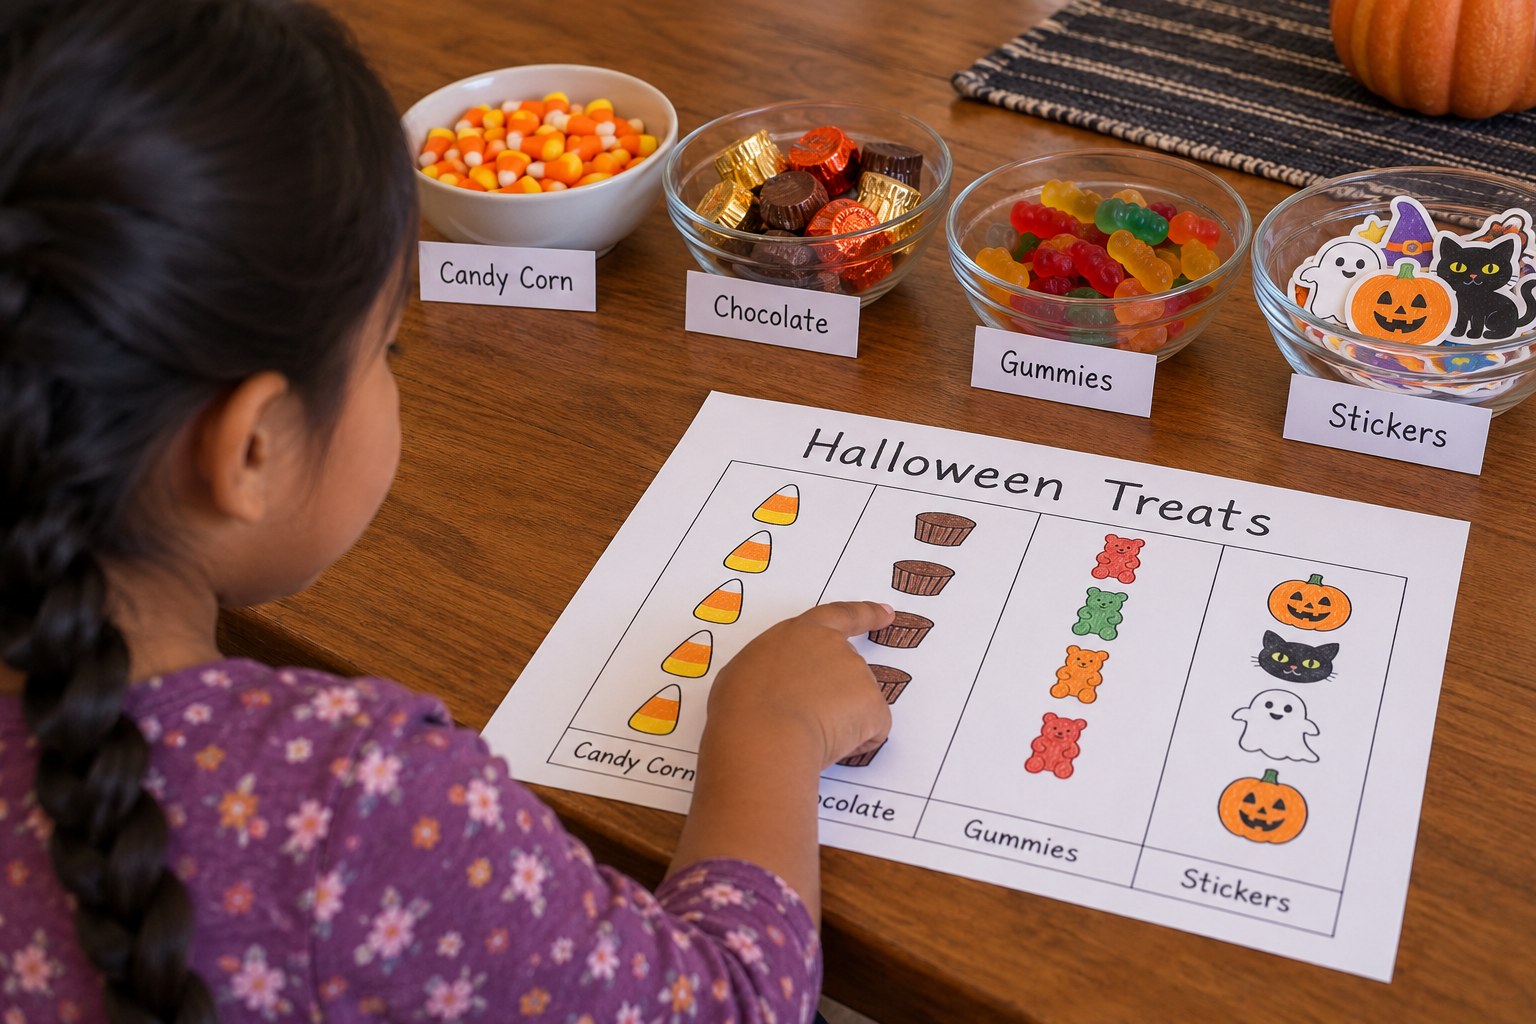
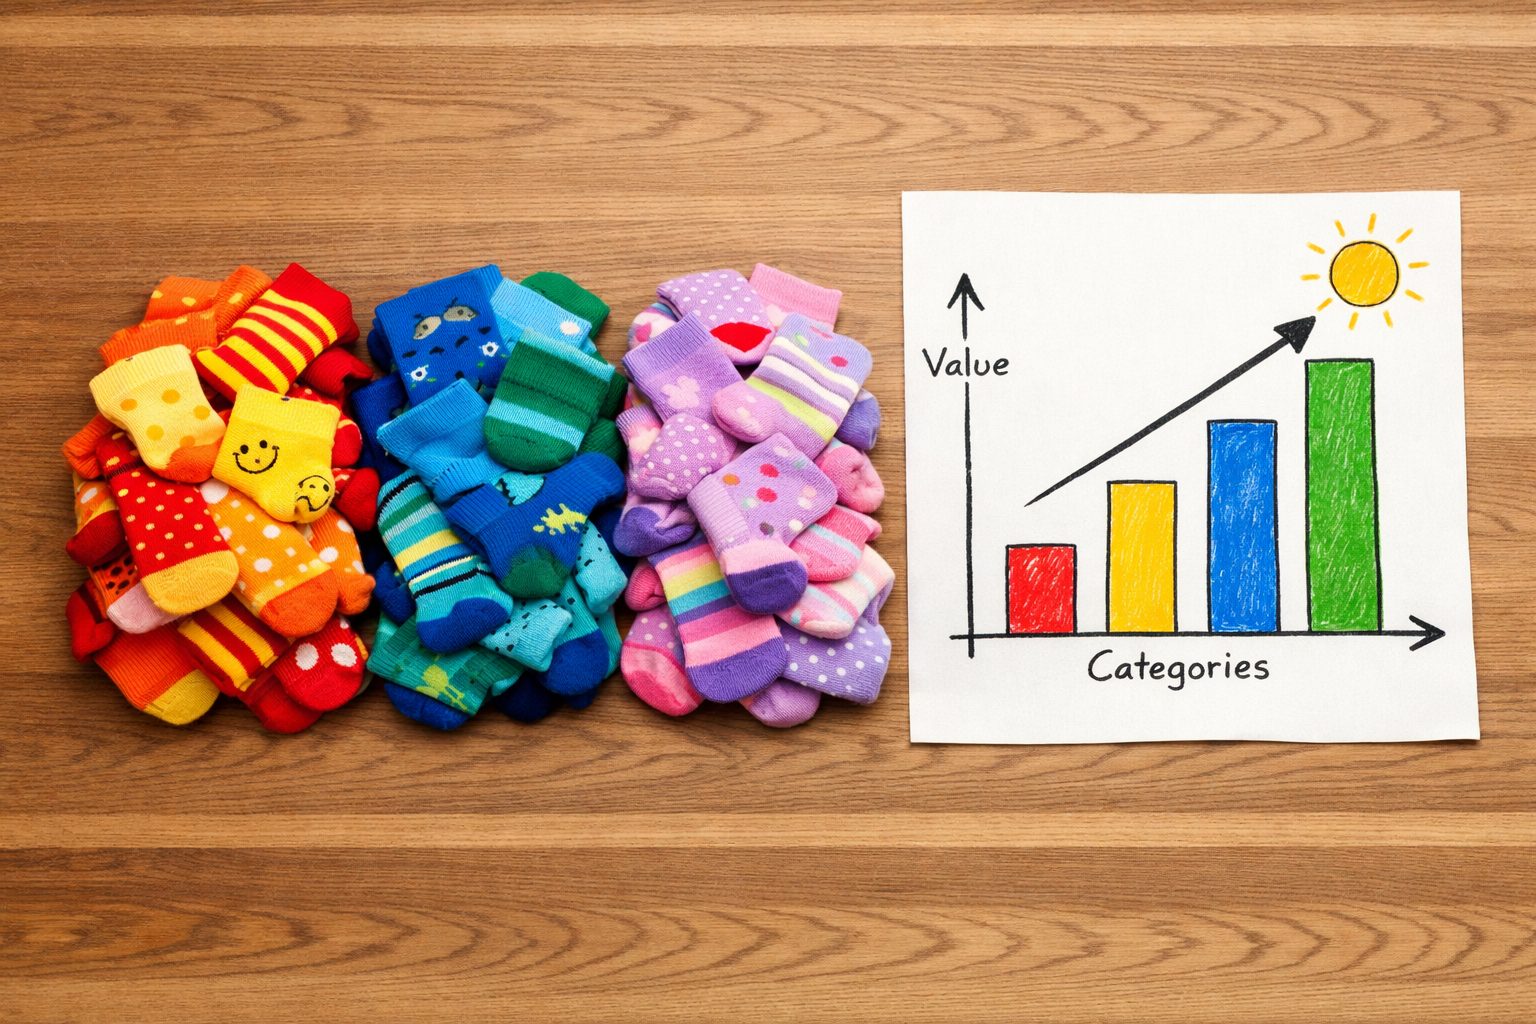
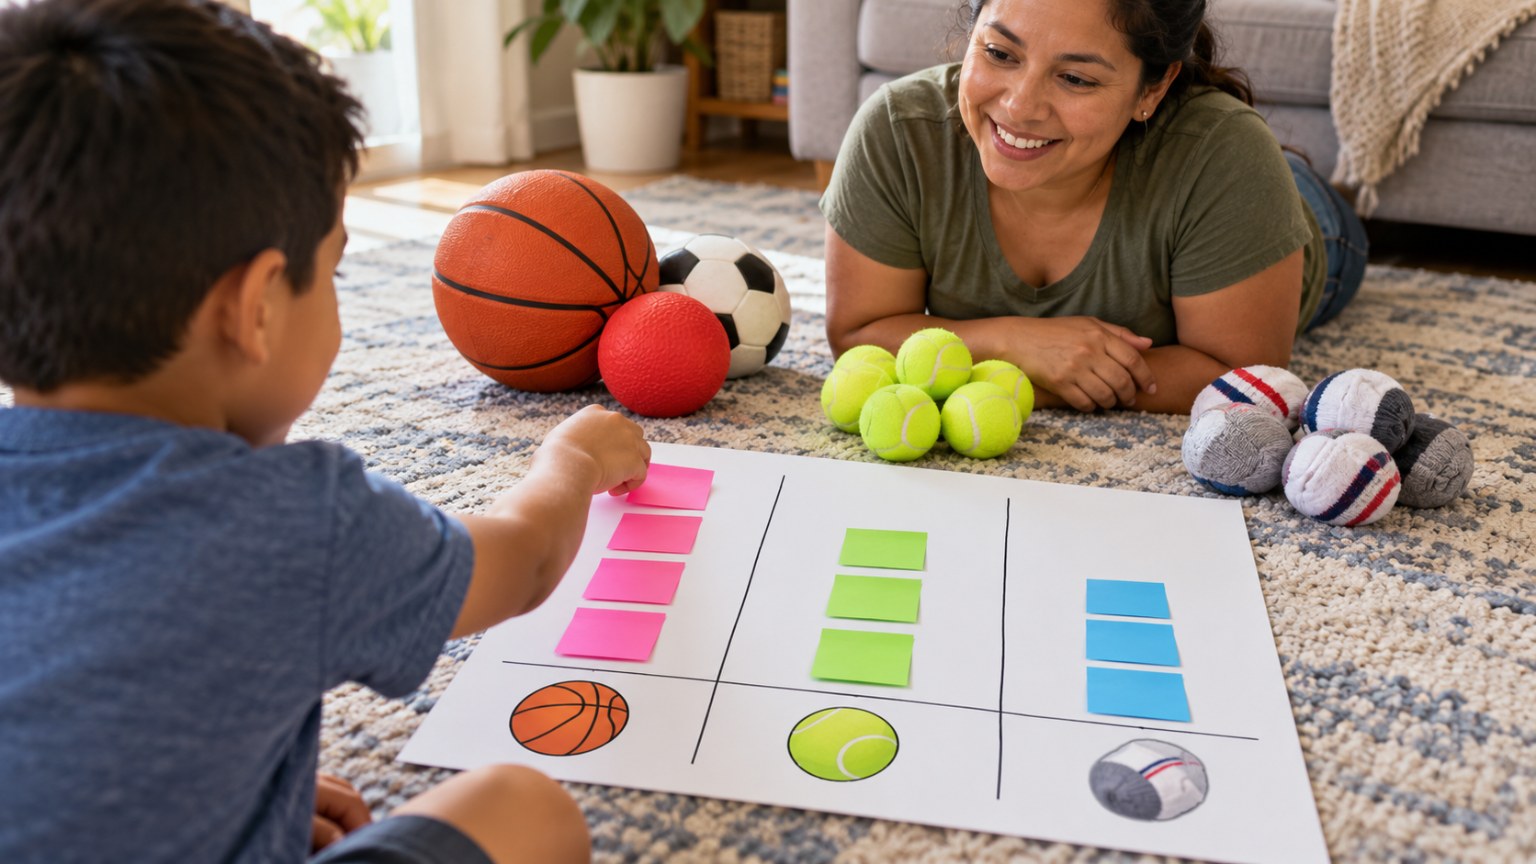
Your child empties the sports-day equipment bin, sorts the balls three ways (by size, by bounce, by what game they are for), counts each group and builds a floor graph with sticky notes to answer questions about the bin.
Objective
Your child will sort sports equipment into categories, count how many are in each, and use a simple graph to answer 'how many more' and 'how many in all' questions.
Standards
Materials
| Item | Quantity |
|---|---|
| Balls and soft equipment from around the house (playground ball, tennis ball, ping-pong ball, beach ball, sock balls, beanbags) | 10-15 items |
| Sticky notes | about 20 |
| Painter's tape | 1 roll |
| Pencil or crayon | 1 |
| Laundry basket as the equipment bin | 1 |
Vocabulary
Preparation
- Collect 10 to 15 balls and soft items. Socks rolled into balls count; use what you have.
- Tape a long line on the floor for the bottom of the graph, with three short labels (big, medium, small) drawn on sticky notes.
Introduction
Dump the bin on the floor and say: 'The coach needs to know how many of each kind of ball we have for sports day. Can you be the equipment manager?'
How could we put these balls into groups?
Do you think there are more big balls or small balls?
Steps
Conclusion
Ask: if we bought 2 more small balls, which column would grow? Keep the graph idea for your next sports day inventory.
Make your own lesson plan in minutes
Describe a topic and Resource Portal AI writes the objectives, materials and steps for your group.
Try Resource Portal AI