Safari Spotting Tally and Picture Graph

Overview
Spot hidden safari animals, tally them and graph them.
Description
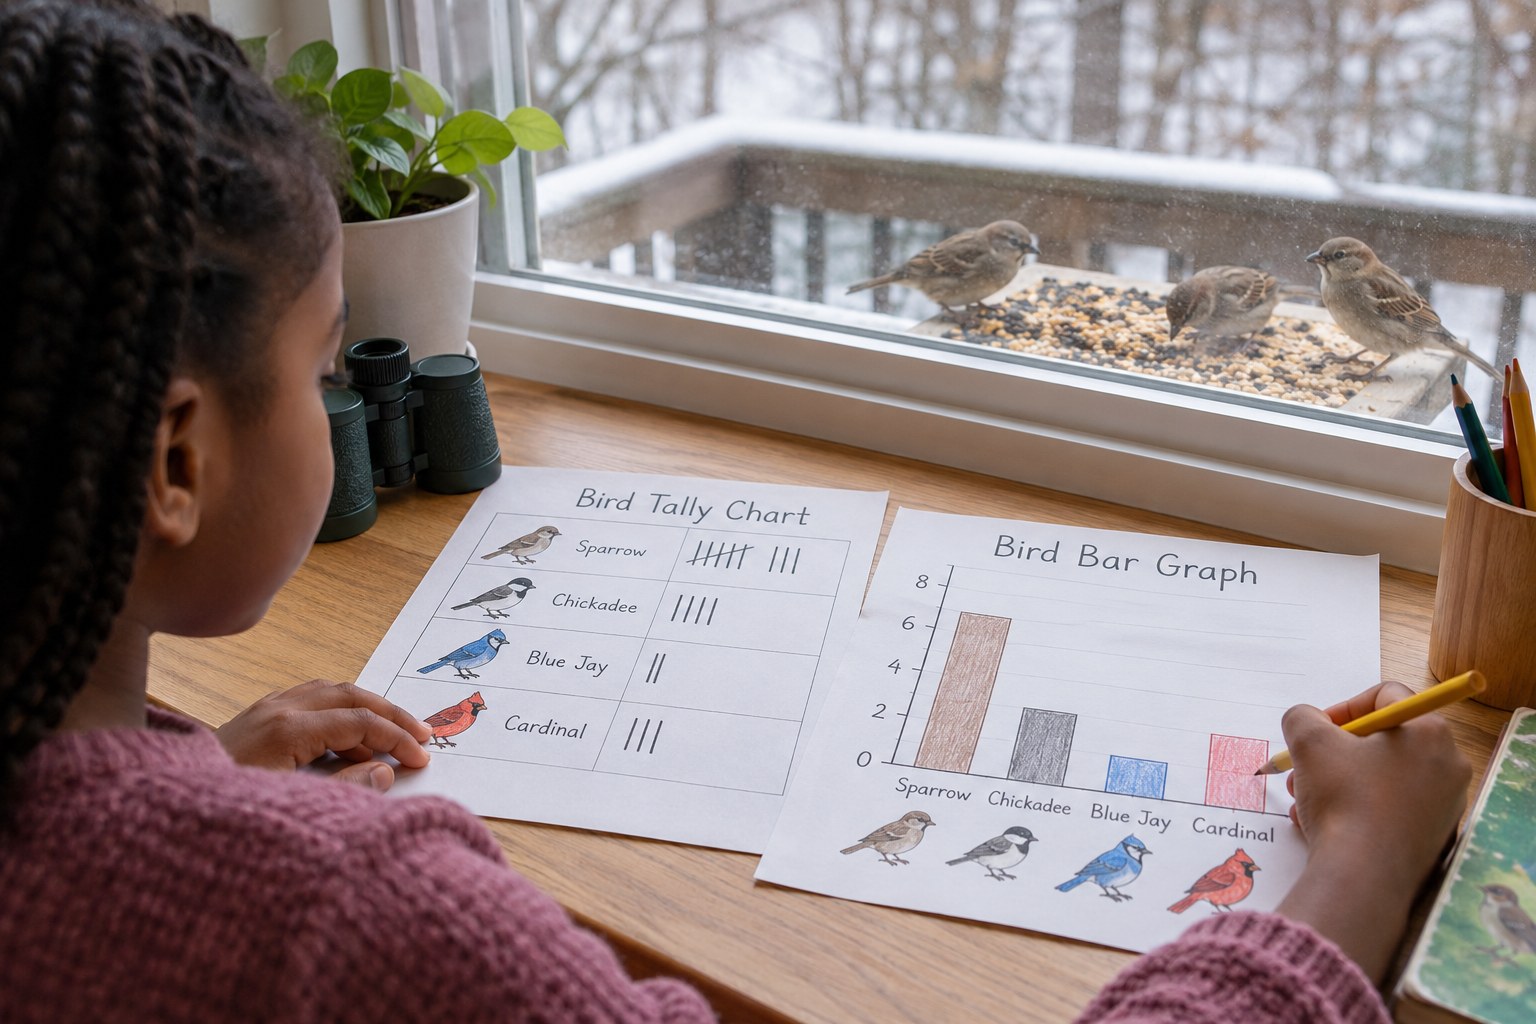
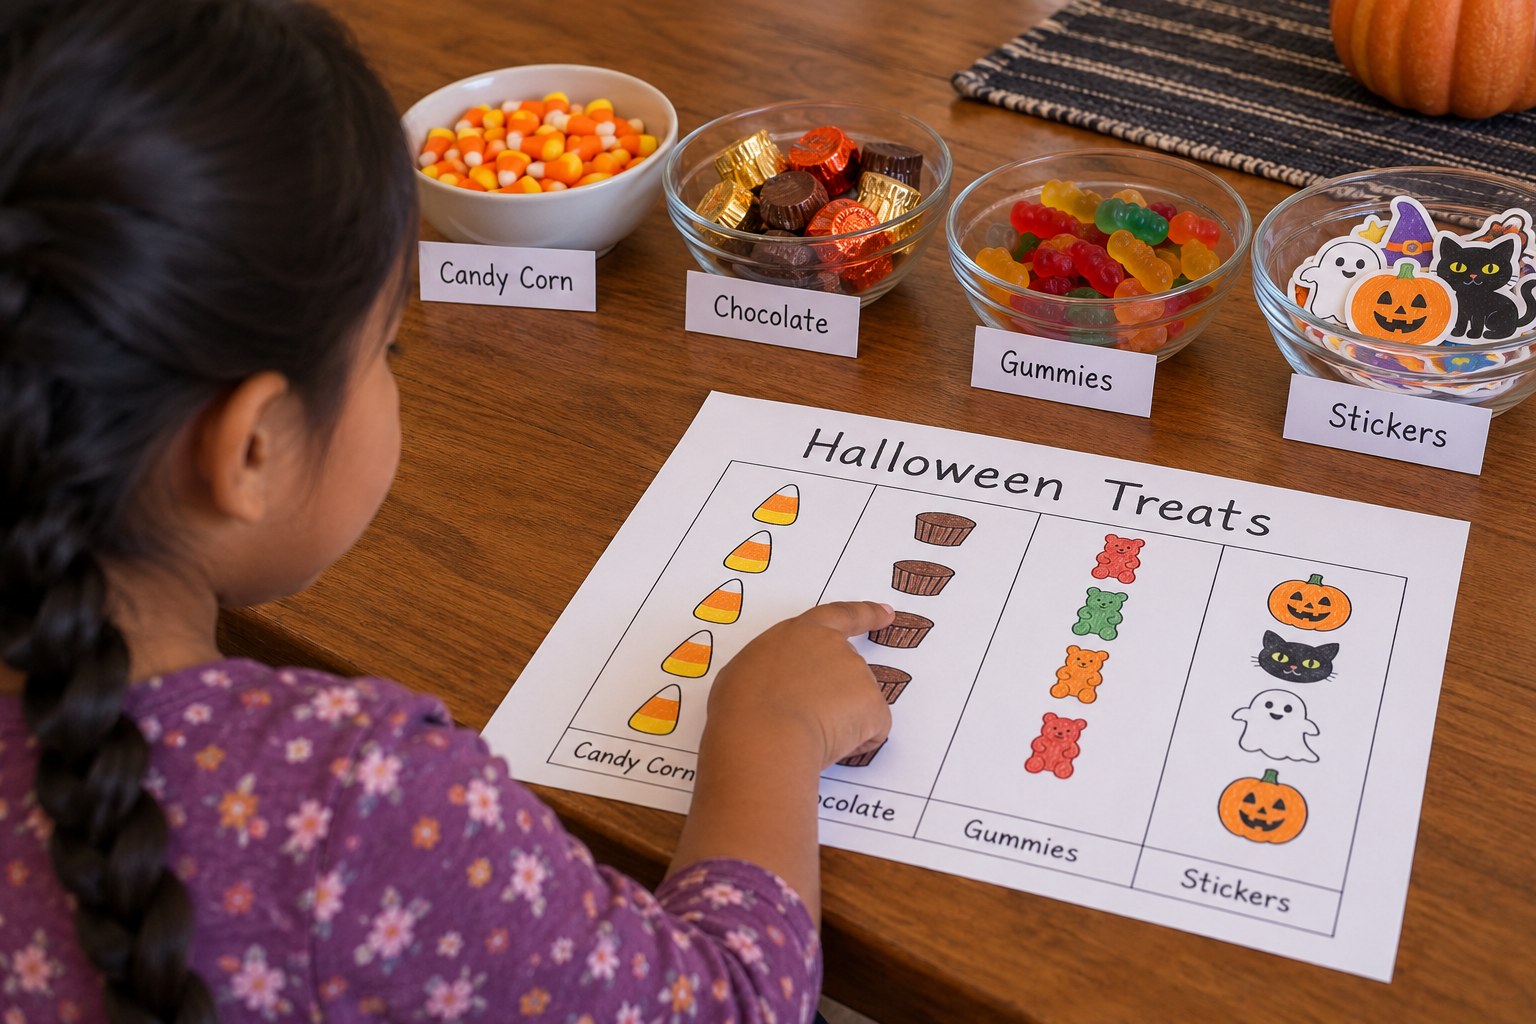
Your child rides a pretend safari vehicle (a laundry basket or a chair) around the house spotting hidden paper savanna animals, keeps a tally like a wildlife guide, then turns the tally into a picture graph and answers questions about it.
Objective
Your child will collect data with tally marks, organize it into a picture graph with three or four categories, and answer how-many, more and fewer questions.
Standards
Materials
| Item | Quantity |
|---|---|
| Small paper cards with simple drawings of zebras, elephants, giraffes and lions (or 4 colors of sticky notes, one color per animal) | About 20 total, in uneven numbers |
| Clipboard or hardcover book with paper and a pencil | 1 per child |
| Sheet of paper for the graph and crayons | 1 per child |
| Laundry basket, box or chair to be the safari vehicle | 1 |
| Binoculars made from 2 toilet paper tubes taped together (optional) | 1 |
Vocabulary
Preparation
- Draw or label the animal cards so there are uneven amounts, for example 7 zebras, 5 elephants, 3 giraffes and 2 lions. Write the numbers down so you can check later.
- Hide the cards around one or two rooms, some easy to see and some tricky. For a group, hide more cards and let children work in pairs.
- On the tally sheet, write or draw the 4 animals down the left side with space for tally marks.
Introduction
Hand your child the binoculars and say, 'Welcome, safari guide! Wildlife guides in places like Kenya and Tanzania count the animals they see so scientists know how the animals are doing. Today you will count the animals on our safari.'
Which savanna animal do you think we will see the most of?
Why would scientists want to count animals?
Steps
Conclusion
Ask: which animal did you spot the most? The fewest? How did the graph make it easier to tell than the tally sheet?
Make your own lesson plan in minutes
Describe a topic and Resource Portal AI writes the objectives, materials and steps for your group.
Try Resource Portal AI