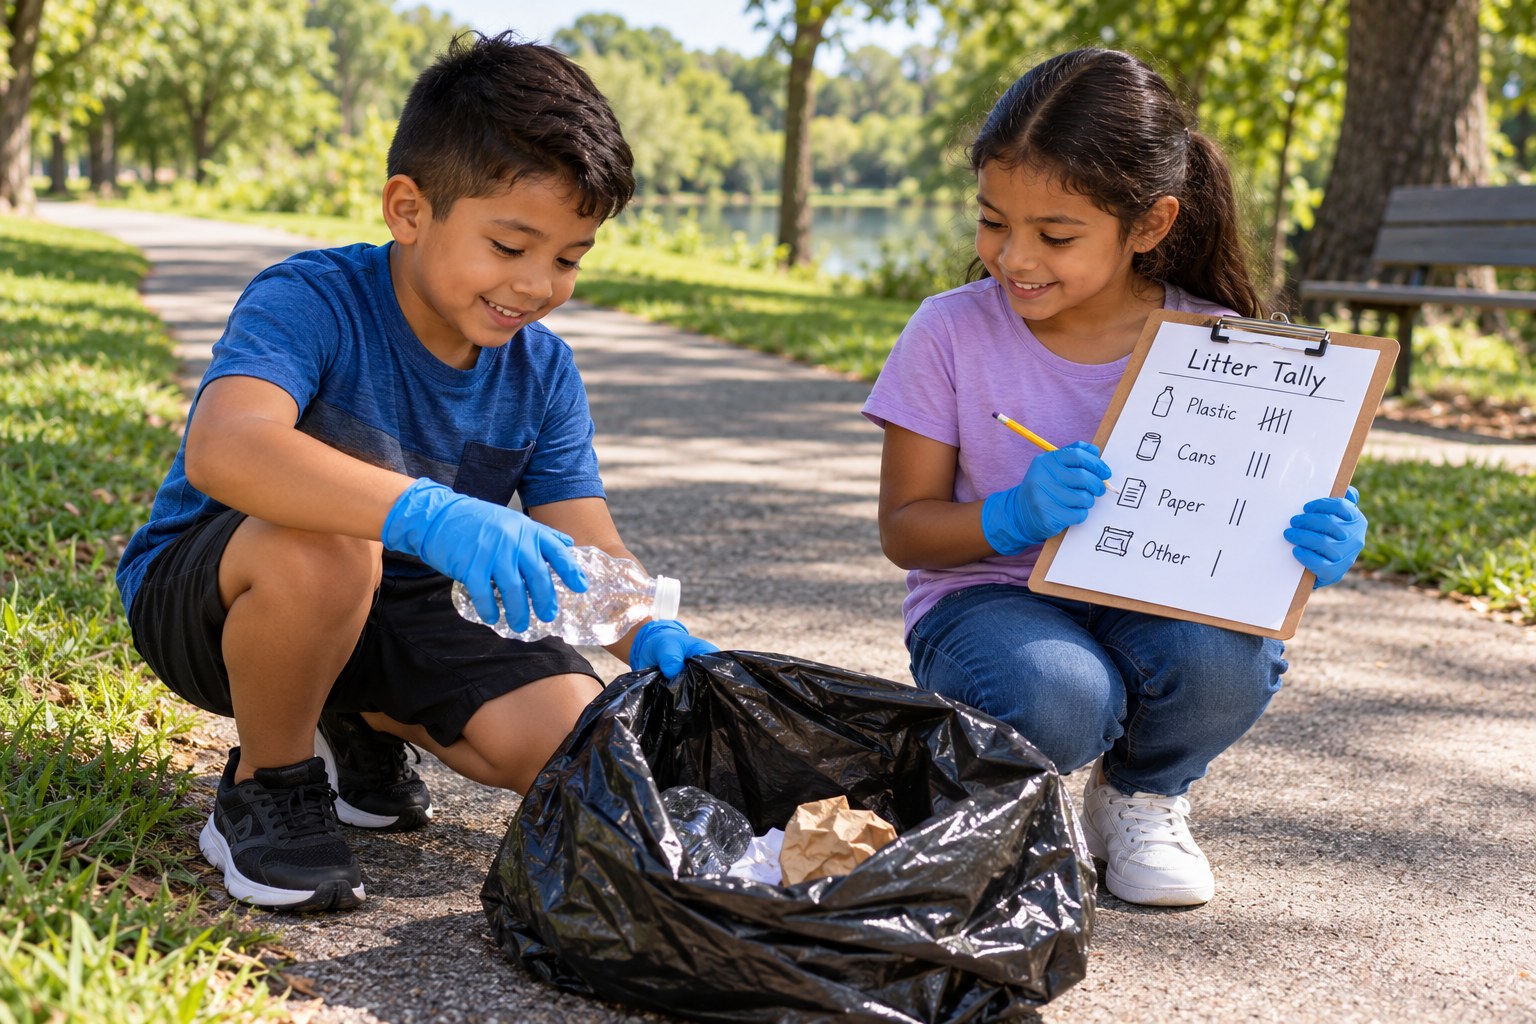
Earth Day Litter Tally and Picture Graph
Overview
Pick up litter, tally it and graph what you found.
Description
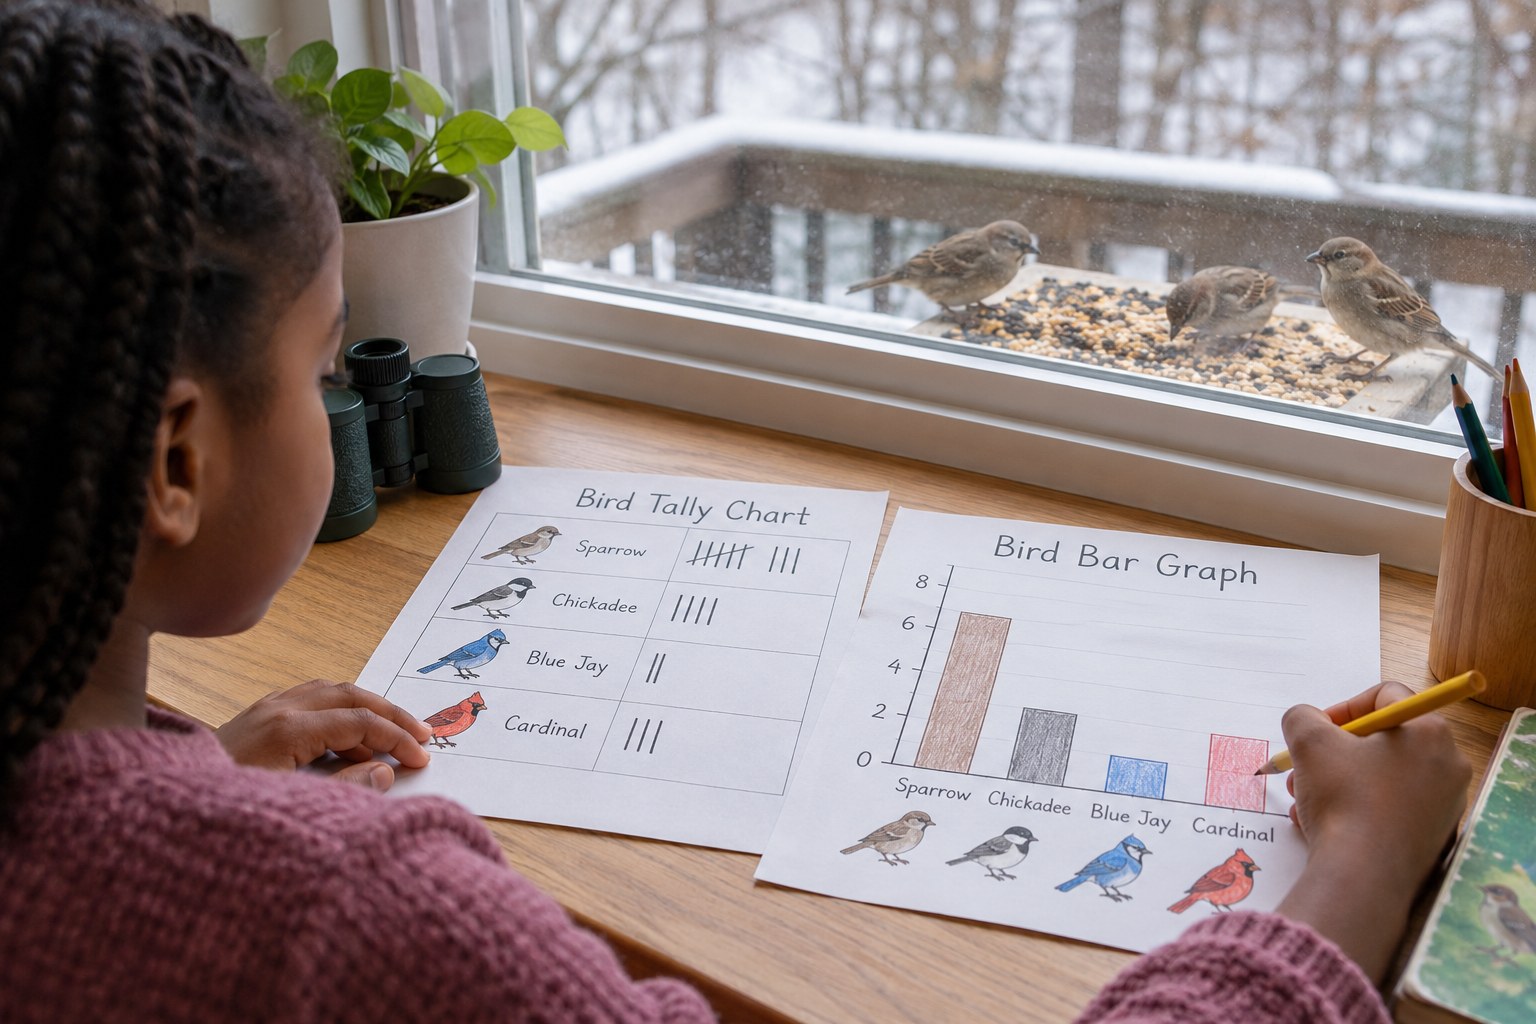
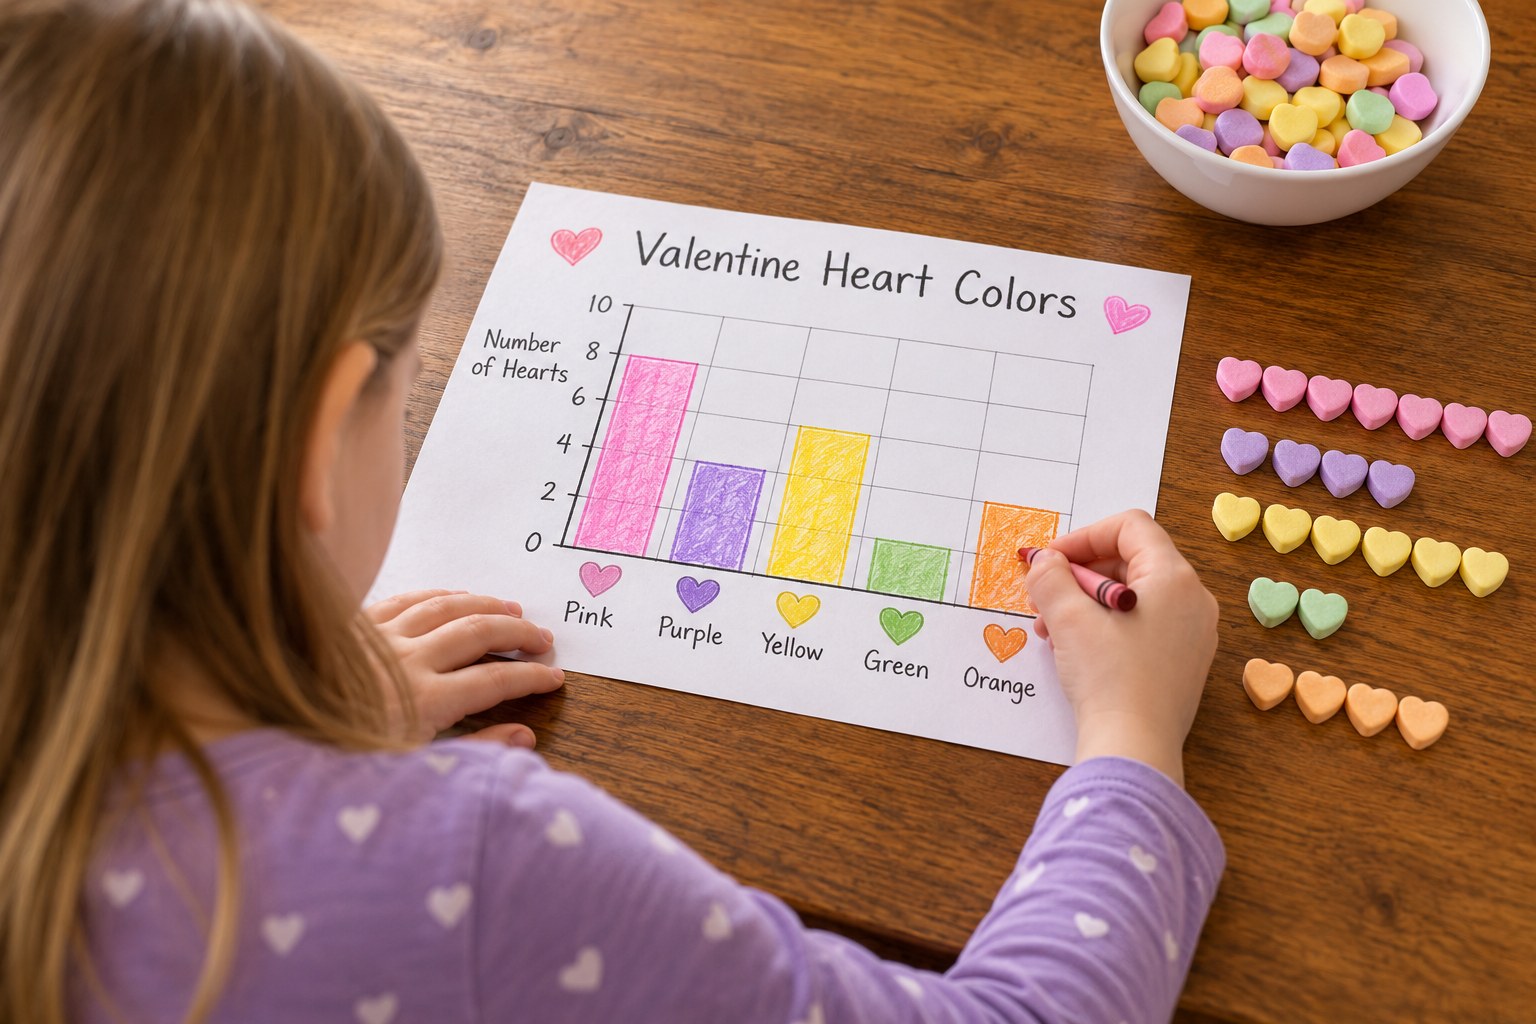
Your child takes an Earth Day clean-up walk, keeps tally marks for each kind of litter the family picks up, then turns the tallies into a picture graph and answers how-many and how-many-more questions about it.
Objective
Your child will collect data with tally marks in up to four categories, show it in a picture graph and answer put-together, take-apart and compare questions.
Standards
Materials
| Item | Quantity |
|---|---|
| Disposable or garden gloves | 1 pair per person |
| Trash bag and a separate recycling bag | 1 each per group |
| Trash grabber or tongs (optional) | 1 per group |
| Clipboard or stiff cardboard with the tally sheet | 1 per child |
| Pencil and crayons | 1 each per child |
| Sheet of paper for the picture graph | 1 per child |
Vocabulary
Preparation
- Draw a tally sheet with four rows: Paper, Plastic, Metal, Other. Leave room for tally marks next to each.
- Pick a short route such as a sidewalk, school edge or park path. Set the rules: an adult picks up anything sharp, broken glass, needles or anything unknown; children only touch items an adult says are safe, and always with gloves.
Introduction
Show your child a candy wrapper and ask: if every person in our neighborhood dropped just one, how many would there be? On Earth Day, people all over the world clean up litter. Today you will be litter scientists and count what you find.
What kind of litter do you think we will find the most of?
Why does litter hurt animals and plants?
Steps
Conclusion
Ask: was your prediction right? What could people do to stop the most common kind of litter? Hang the graph up as your Earth Day report.
Make your own lesson plan in minutes
Describe a topic and Resource Portal AI writes the objectives, materials and steps for your group.
Try Resource Portal AI