Who Lives Where? Rainforest Layer Graph
Overview
Sort rainforest animals by layer and graph them.
Description
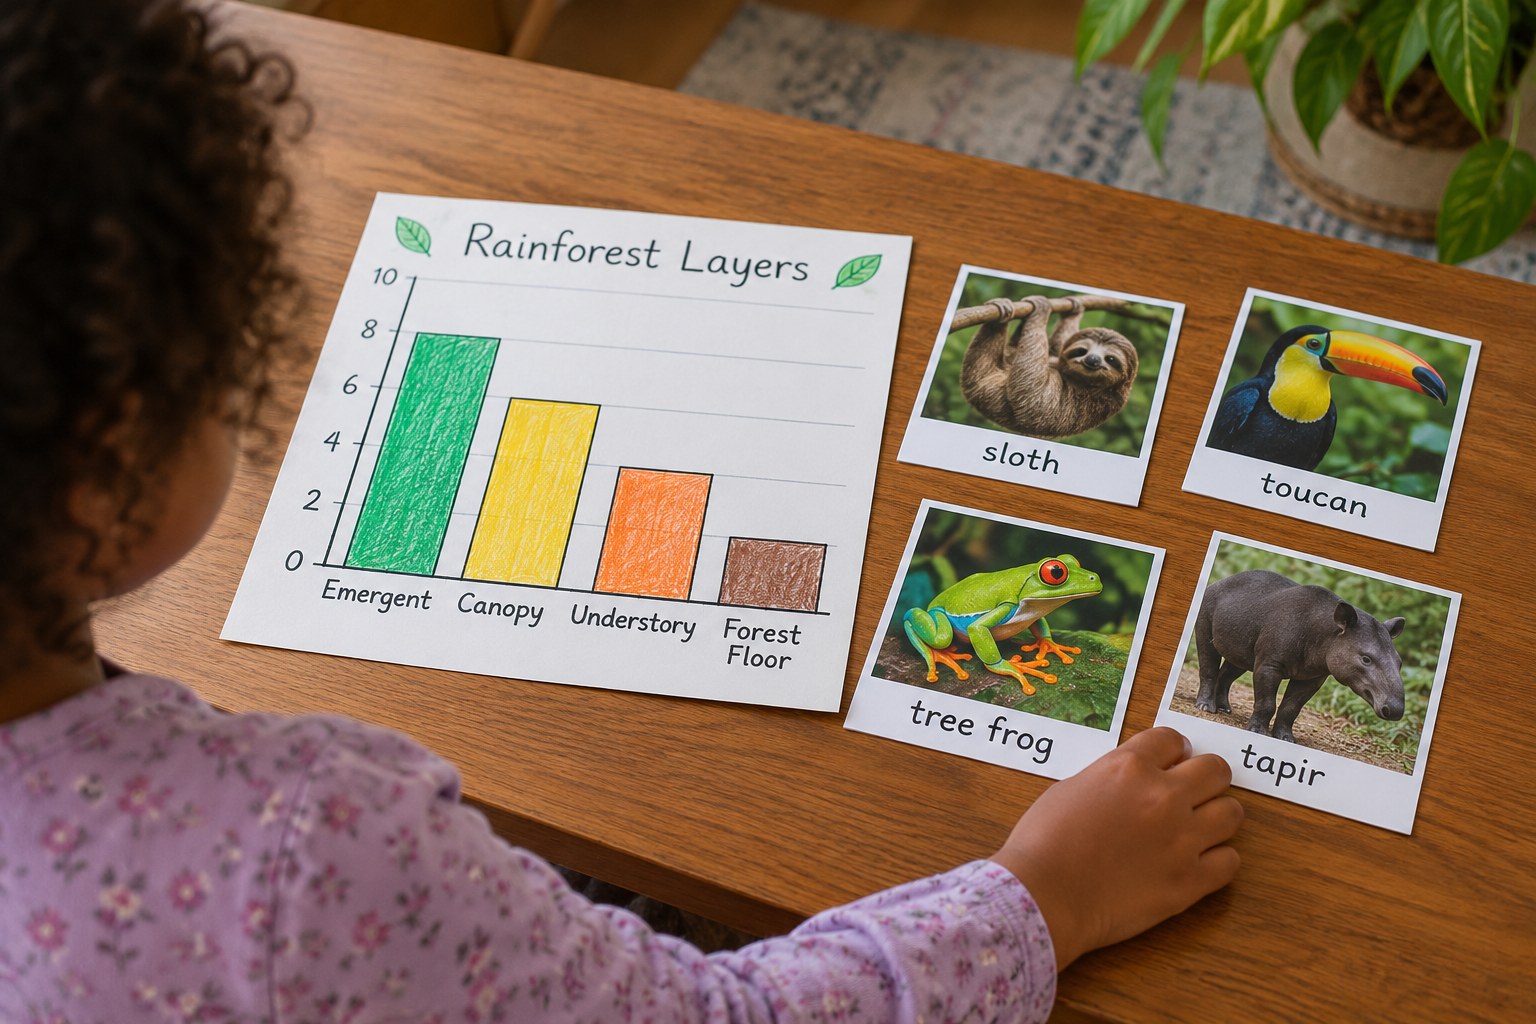
Your child sorts rainforest animal picture cards into the canopy, understory and forest floor, then builds a picture graph and bar graph to show how many live on each layer, answering questions about which layer has the most.
Objective
Your child will sort animal cards into three layer categories, represent the data in a picture graph and bar graph, and answer how-many-more questions.
Standards
Materials
| Item | Quantity |
|---|---|
| Index cards or paper squares for animal cards | 12 |
| Crayons or markers | 1 set |
| Large sheet of paper or poster board | 1 |
| Ruler | 1 |
| Sticky notes (optional) | 12 |
Vocabulary
Preparation
- Write one animal name on each card and add a quick sketch: canopy (sloth, toucan, spider monkey, howler monkey, parrot), understory (red-eyed tree frog, boa constrictor, jaguar resting on a low branch, leaf-tailed gecko), forest floor (tapir, leafcutter ant, giant anteater). Jaguars hunt on the ground but also climb, so it is fine to discuss either place.
- Draw three columns on the poster labeled Canopy, Understory, Forest Floor. Draw a second blank grid for a bar graph.
Introduction
Hold up the sloth card and ask: do you think this animal lives way up high, in the middle, or on the ground? Let's sort the whole rainforest!
Why would a monkey live up in the canopy?
Which layer do you think has the most animals?
Steps
Conclusion
Ask: which layer had the most animals? Scientists have found that most rainforest animals really do live up in the canopy, where there is the most sunlight and food.
Make your own lesson plan in minutes
Describe a topic and Resource Portal AI writes the objectives, materials and steps for your group.
Try Resource Portal AI