Lesson planLocal vs. Express Train: Compare Speeds on a Distance-Time Graph
Math50 minutesGrades: 7th, 8th
Overview
Graph two trains and let the slope reveal which is faster.
Description
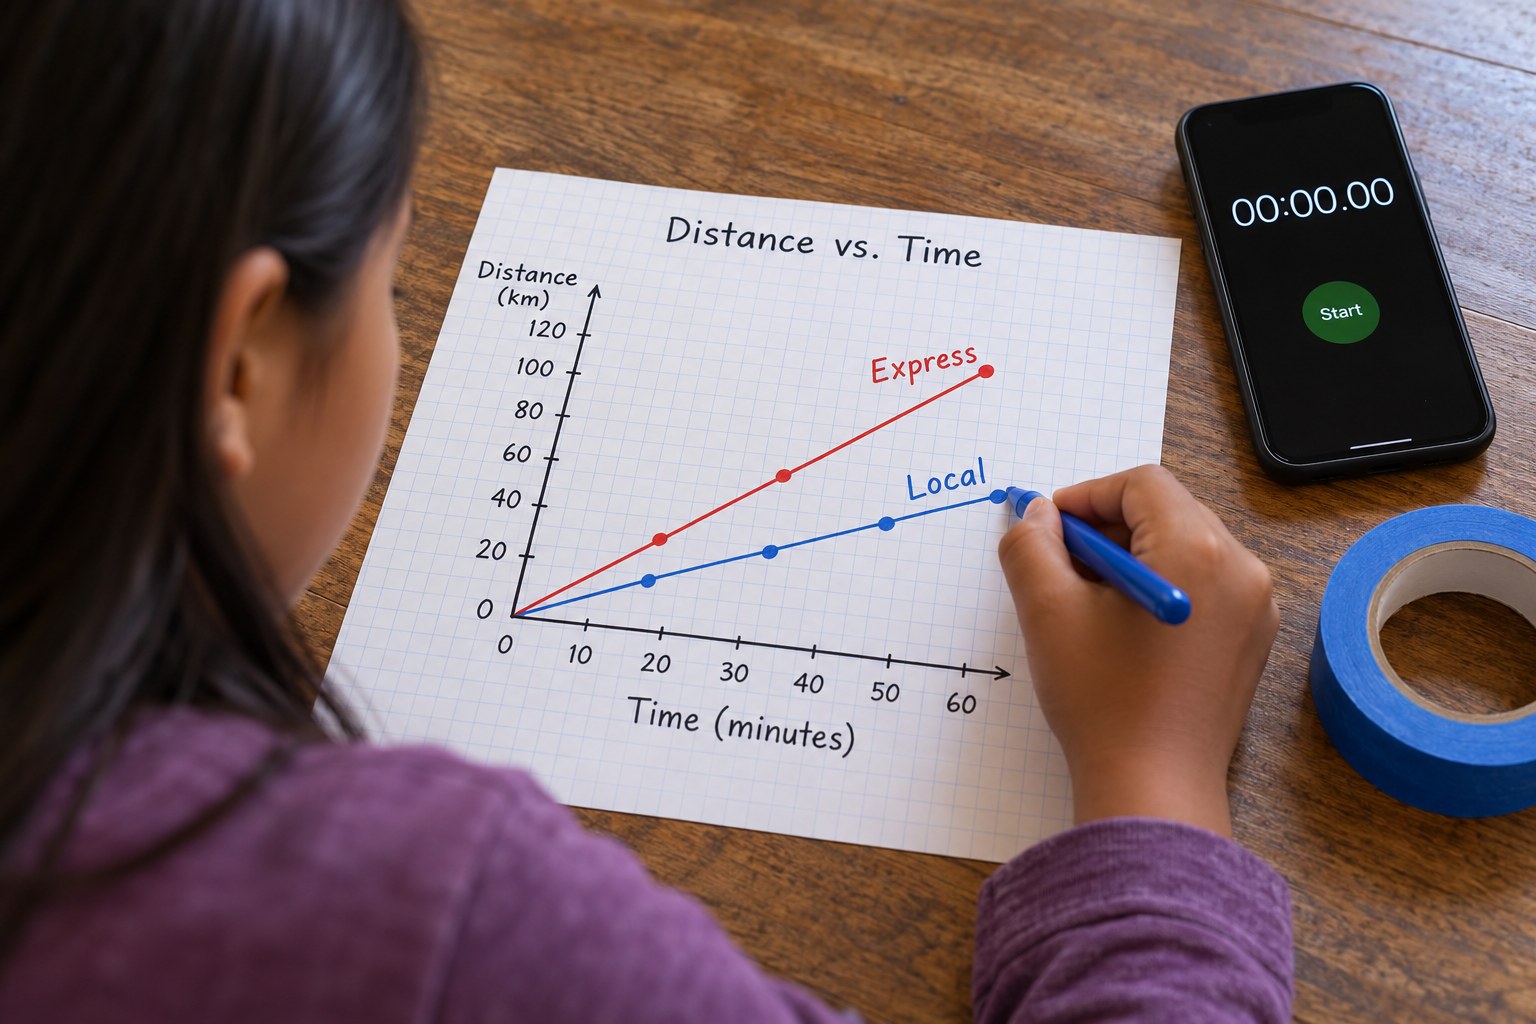
Your teen times 'local' and 'express' walkers along a hallway track, graphs both trips on one distance-time graph, then compares two made-up commuter trains given as a table and an equation to decide which is faster and why stops break the straight line.
Objective
Your teen will graph proportional distance-time relationships, identify the unit rate (speed) as the slope and as the value at t = 1, and compare two proportional relationships given in different forms.
Standards
7.RP.2bMath · Grade 7 · Ratios & Proportional Relationships Identify the constant of proportionality (unit rate) in tables, graphs, equations, diagrams, and verbal descriptions of proportional relationships.
7.RP.2dMath · Grade 7 · Ratios & Proportional Relationships Explain what a point (x, y) on the graph of a proportional relationship means in terms of the situation, with special attention to the points (0, 0) and (1, r) where r is the unit rate.
8.EE.5Math · Grade 8 · Expressions & Equations Graph proportional relationships, interpreting the unit rate as the slope of the graph. Compare two different proportional relationships represented in different ways.
Materials
| Item | Quantity |
|---|
| Tape measure or a ruler and string | 1 |
| Painter's tape or sticky notes to mark distances | 6 pieces |
| Phone stopwatch | 1 |
| Graph paper and pencil | 2-3 sheets |
| Two colored pencils | 2 |
| Calculator (optional) | 1 |
Vocabulary
Unit rate
The amount of one quantity for exactly one unit of another, such as meters per second.
Constant of proportionality
The fixed number k in y = kx that relates two proportional quantities.
Slope
The steepness of a line: how much y changes for each one-unit change in x.
Timetable
A schedule listing when a train or bus reaches each stop.
Proportional
A relationship where y = kx, so its graph is a straight line through the origin.
Preparation
- Mark a straight 'track' 10 meters long (or 30 feet) in a hallway, driveway or sidewalk with tape every 2 meters, starting at 0.
- Copy the 'Commuter train data' section onto paper so your teen can work from it.
- Choose two walkers: the 'local' walks slowly and steadily; the 'express' walks briskly and steadily (no running indoors).
Introduction
Ask your teen: two trains leave the same station, one an express that skips stops and one a local that stops everywhere. Without watching them, how could you tell from a graph which train was faster? Today you'll make the graph yourself.
If a line on a distance-time graph is steeper, what does that mean?
Why would a real train's graph not be a perfectly straight line?
Steps
1Step 1
Run the walking trains
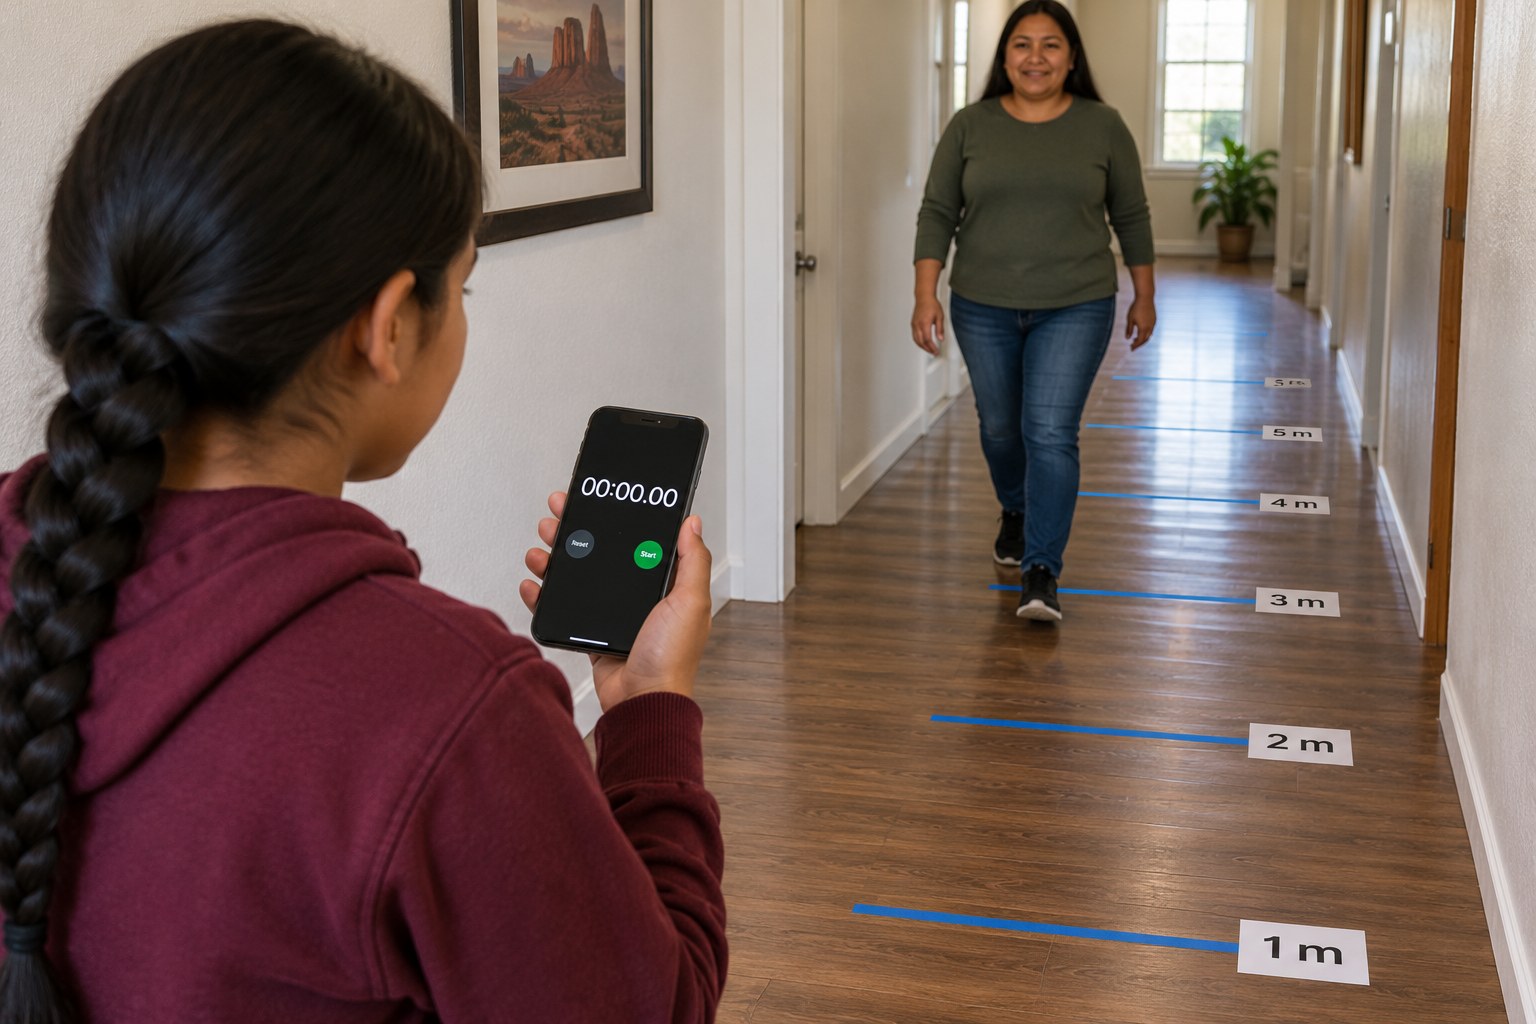
(12 min) The timer calls 'go' and records the time as the local walker passes each 2-meter mark, then repeats for the express walker. Your teen records both in a table of time (seconds) and distance (meters).
2Step 2
Graph both trips
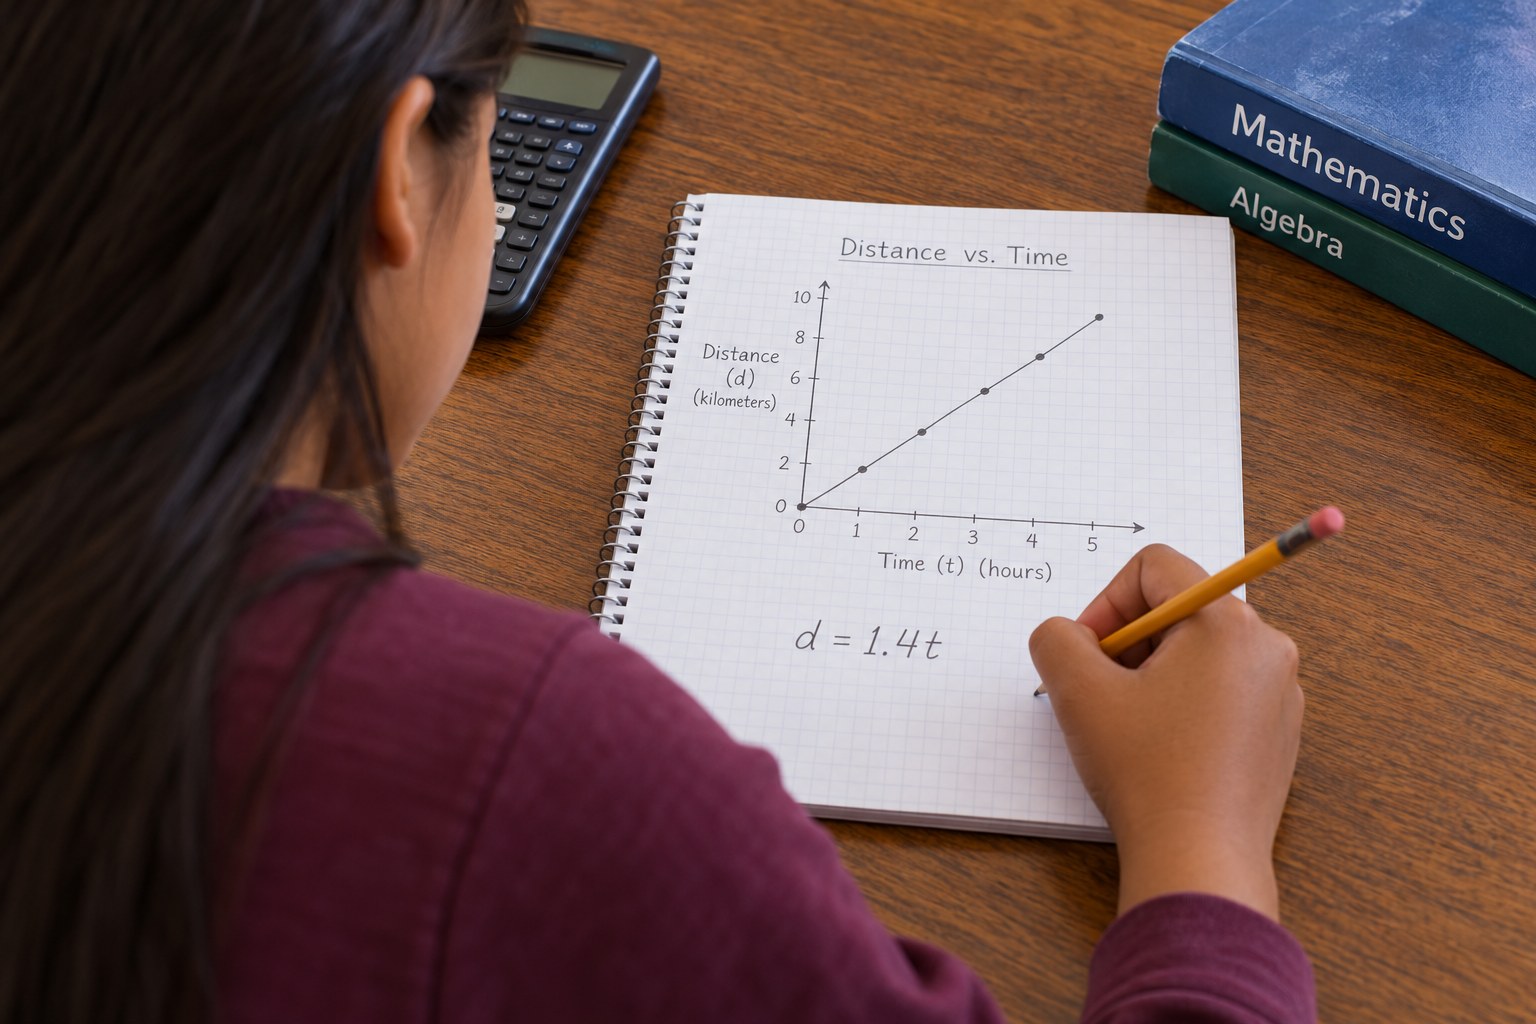
(10 min) Your teen plots both data sets on one graph with time on the x-axis and distance on the y-axis, using a different color for each walker. They draw a best-fit line through the origin for each and label it local or express.

3Step 3
Find the unit rates
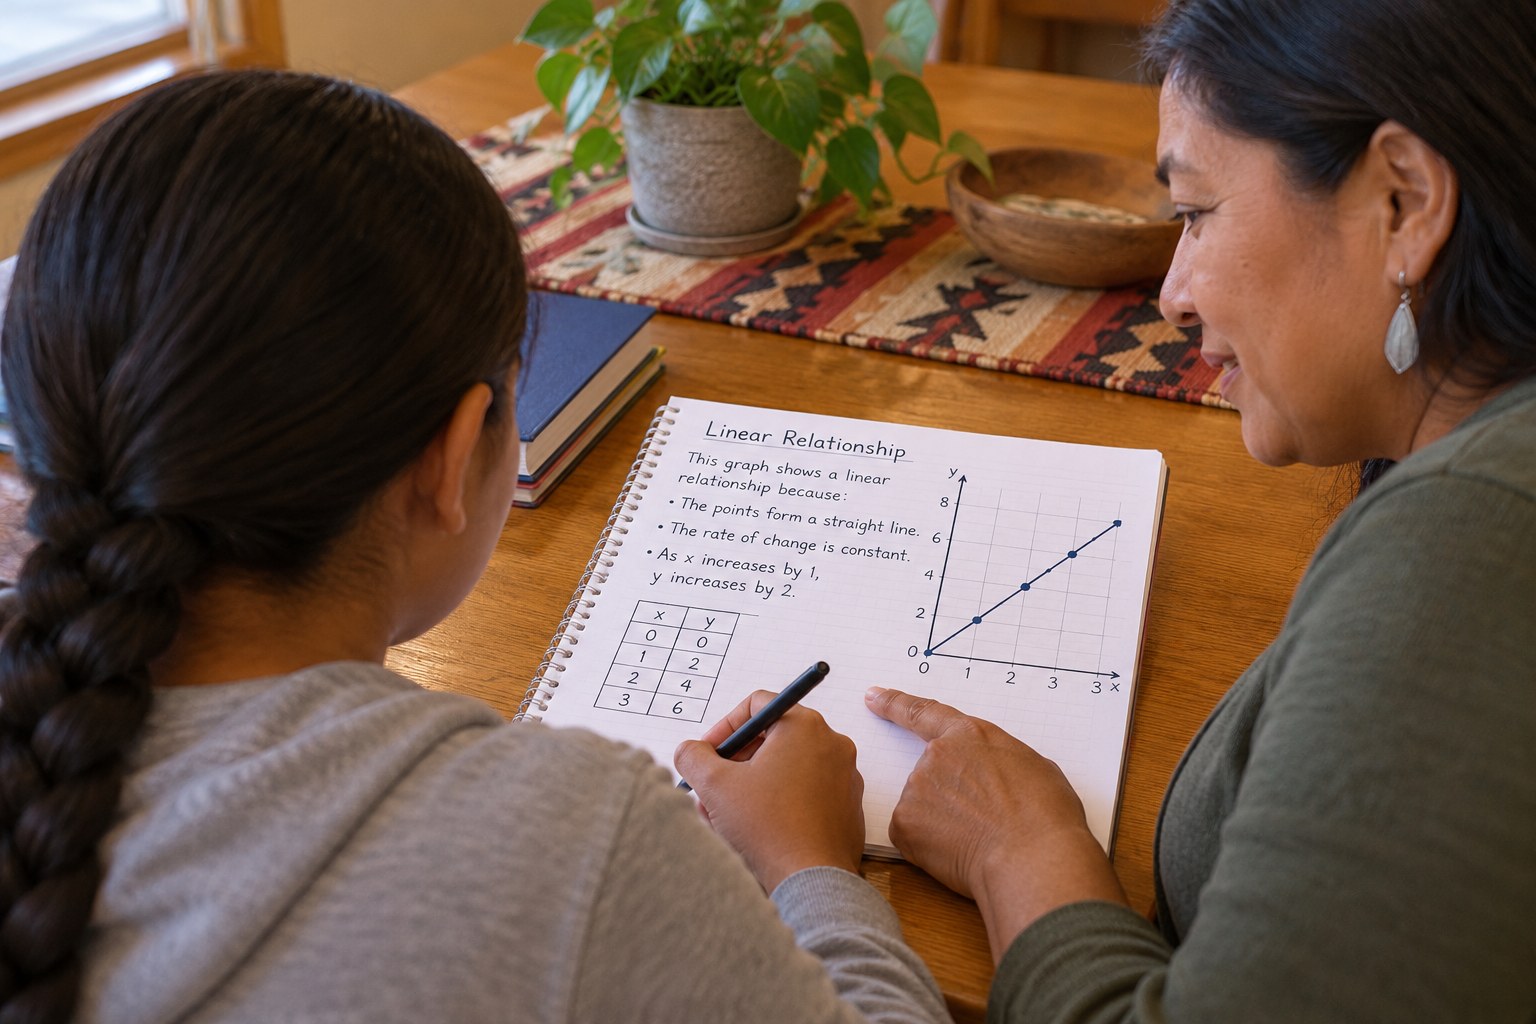
(8 min) For each line, your teen finds the speed in meters per second by dividing distance by time and by reading the point (1, r) on the line. They write each as an equation d = kt and explain why the steeper line is the faster walker.
4Step 4
Compare the commuter trains
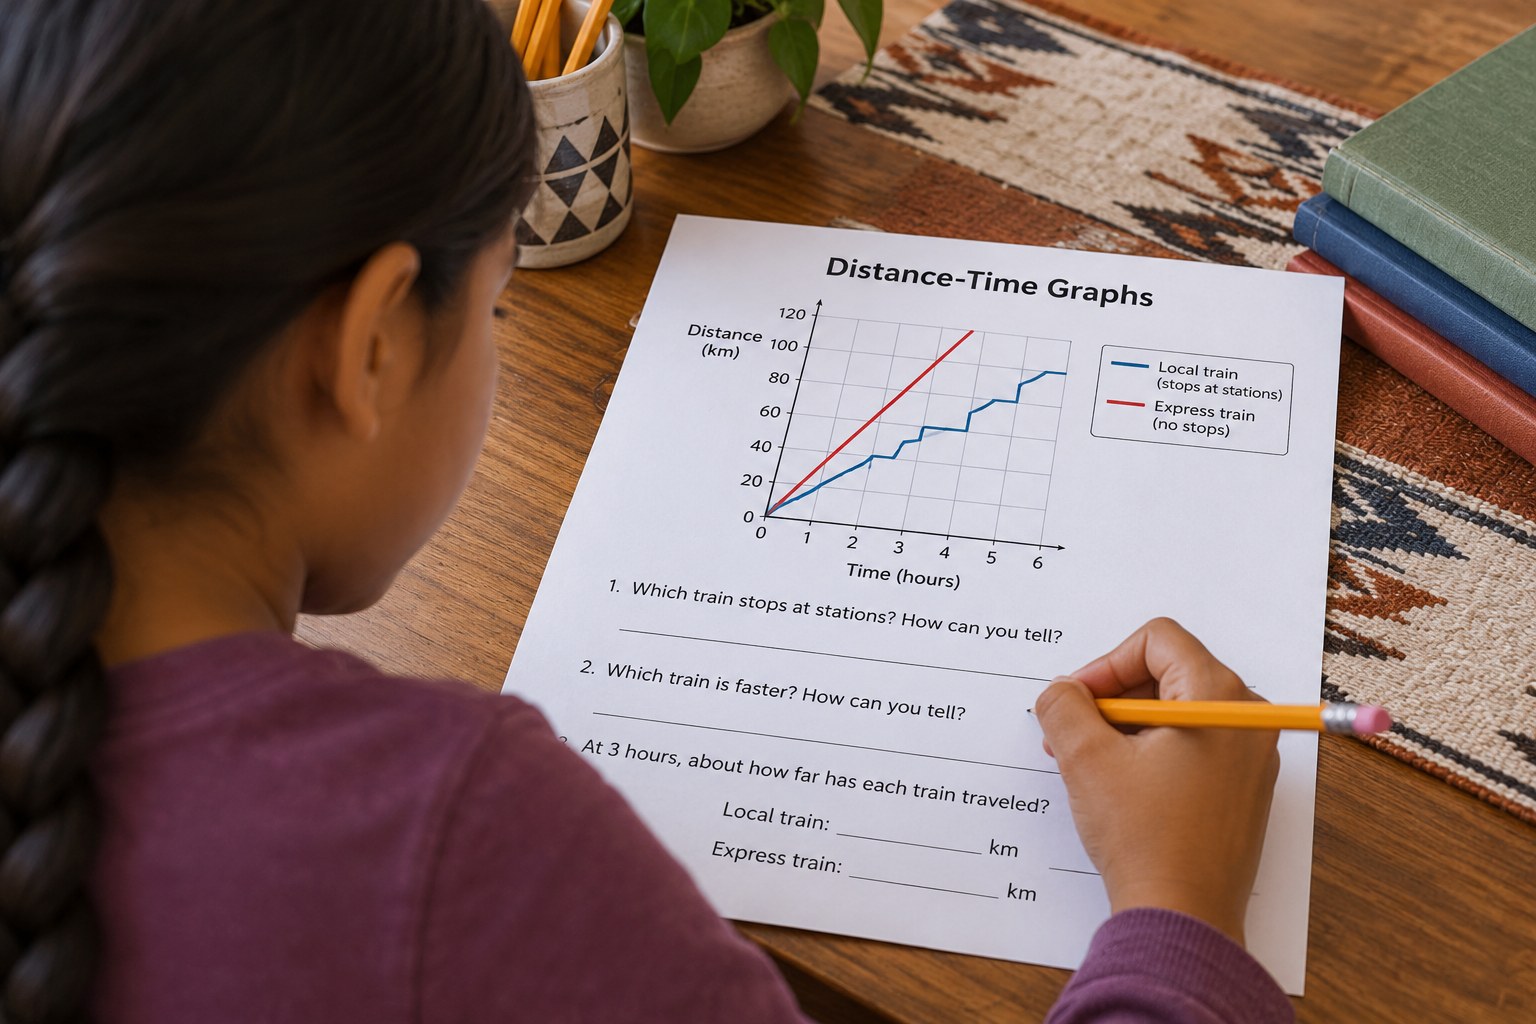
(12 min) Using 'Commuter train data', your teen finds the unit rate for the local train from its table and the express train from its equation, graphs both, and answers: how long does each take to travel 27 miles? Then they graph the local train's real trip with two 3-minute station stops and describe what the flat sections mean.
5Step 5
Explain it in writing
(6 min) Your teen writes three sentences explaining how the table, the equation and the graph each show which train is faster. Compare answers with the key.
Conclusion
Ask: where do you see the unit rate in a table, in an equation and on a graph? Look up a real train or bus timetable for your area and estimate its average speed between two stops.
Make your own lesson plan in minutes
Describe a topic and Resource Portal AI writes the objectives, materials and steps for your group.
Try Resource Portal AI