
Lesson plans for 7.RP.2d
Math · Grade 7 · Ratios & Proportional Relationships
Explain what a point (x, y) on the graph of a proportional relationship means in terms of the situation, with special attention to the points (0, 0) and (1, r) where r is the unit rate.
5 ready-to-teach lesson plans aligned to this standard. Each includes objectives, a materials list, vocabulary and step-by-step activities.
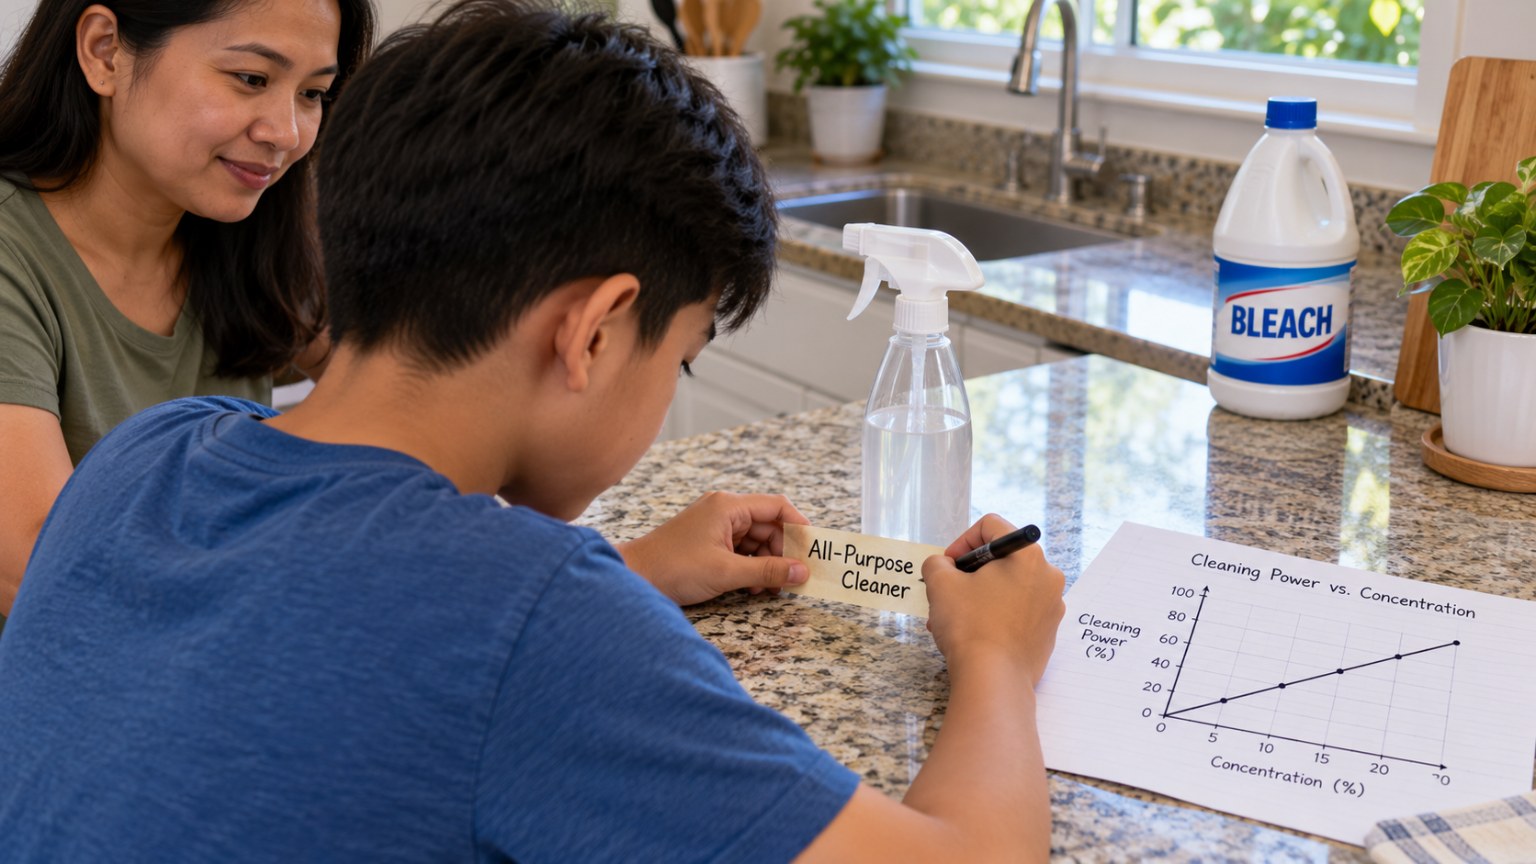
Mix It Right: Graphing a Safe Disinfectant Ratio
Graph a safe cleaning ratio and label your spray bottle.
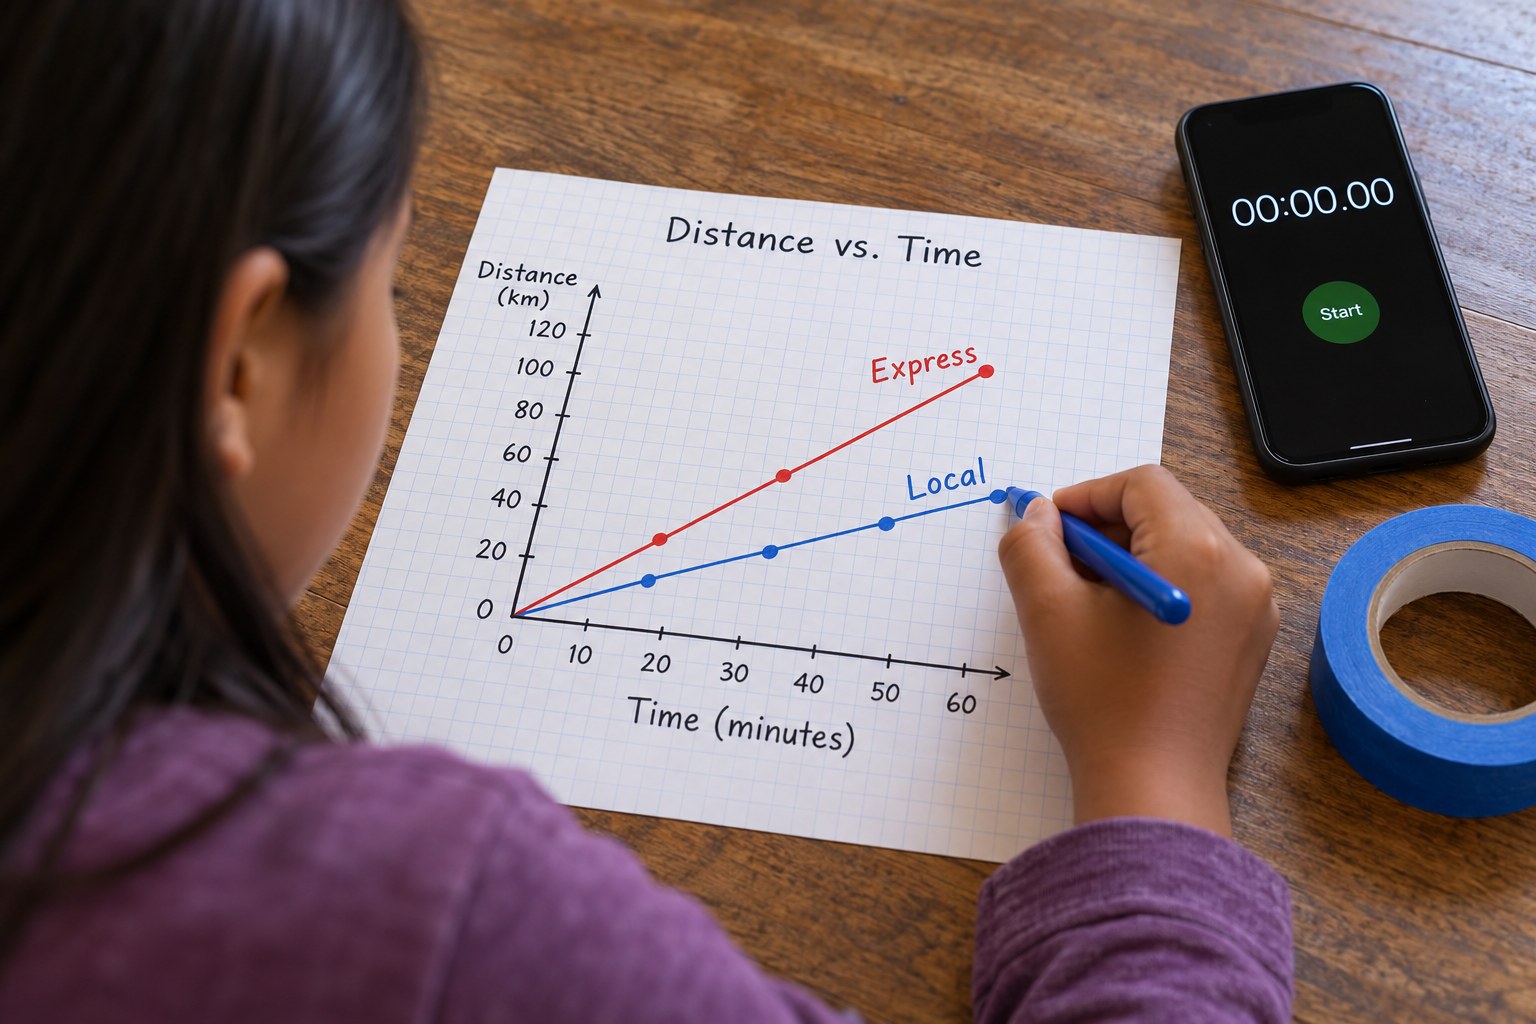
Local vs. Express Train: Compare Speeds on a Distance-Time Graph
Graph two trains and let the slope reveal which is faster.
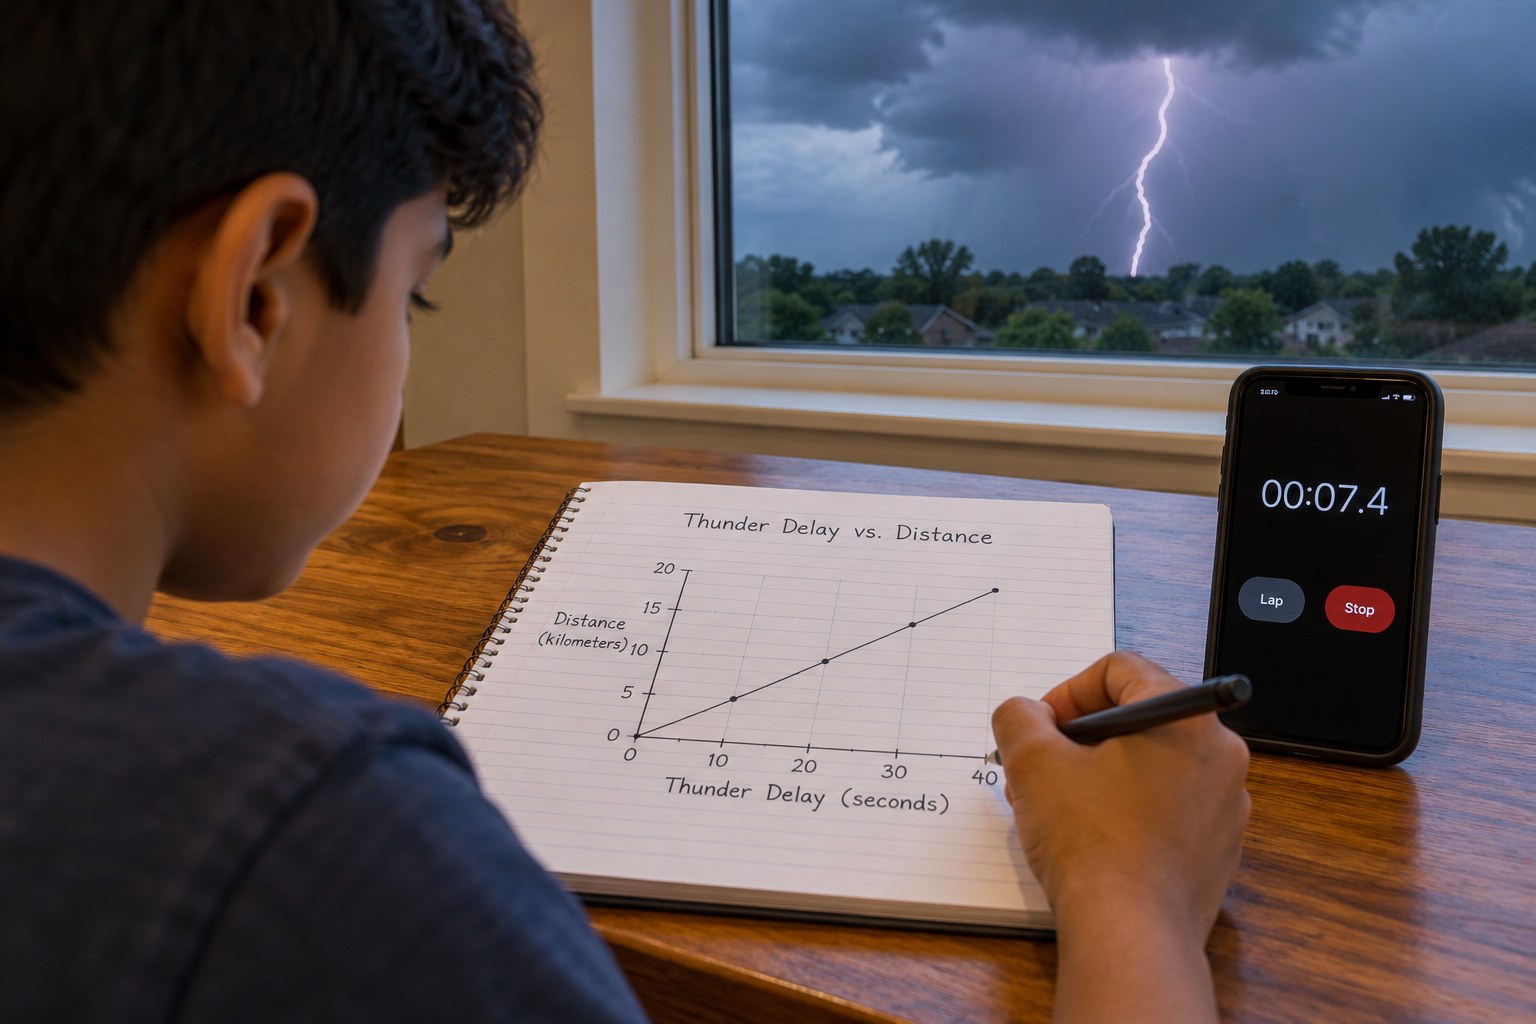
Flash-to-Bang Math: Graph How Far Away the Lightning Struck
Turn flash-to-bang seconds into miles with a proportional graph.
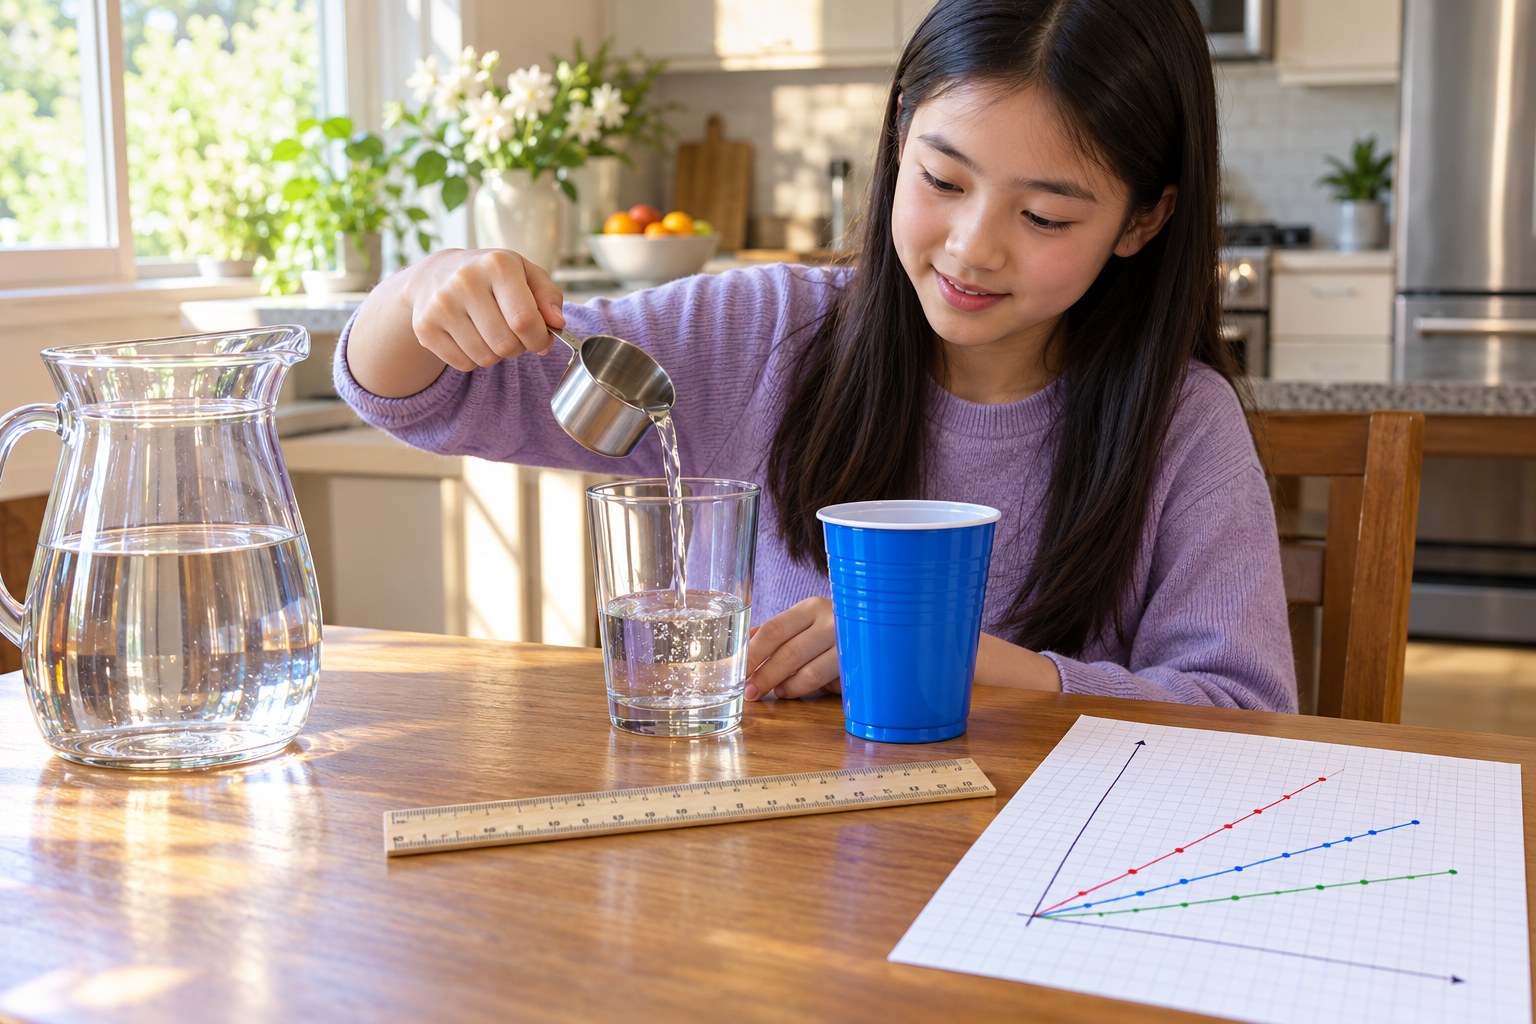
Straight Glass or Party Cup? Testing Whether Water Height Is Proportional
Pour quarter cups into two cups and test proportionality.
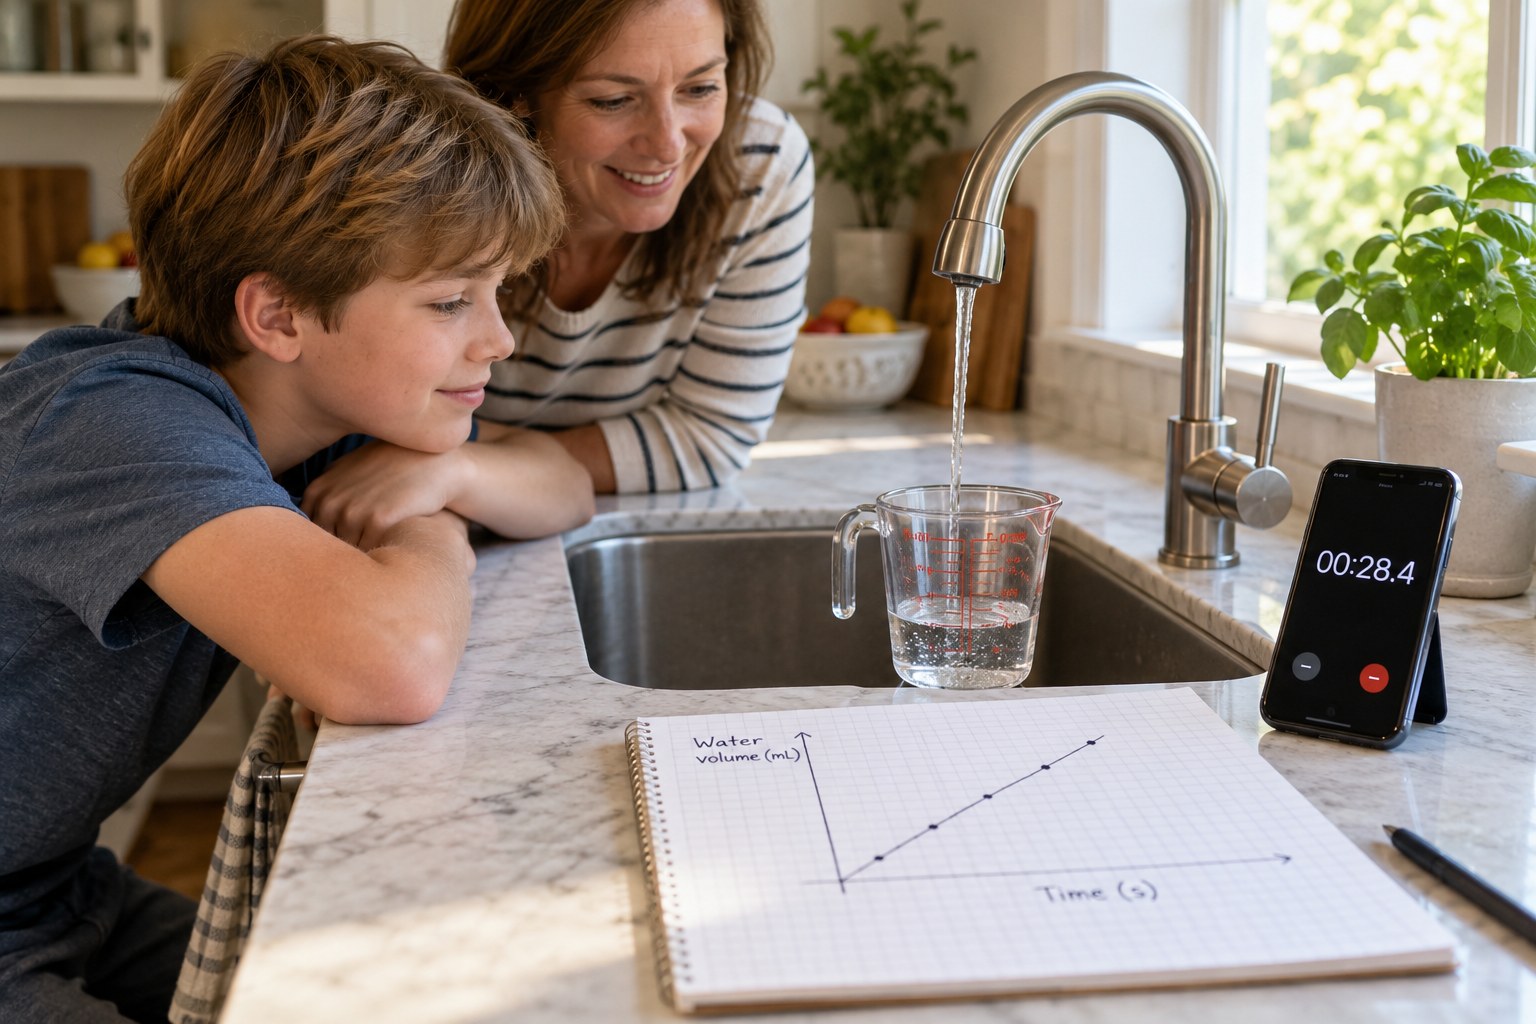
Kitchen Faucet Fill Rate: Table, Graph and Equation
Time a faucet to find a rate, equation and graph.
See all grade 7 standards with lesson plans
Make a lesson like this in a minute
Pick a topic, grade, group size and length. Resource Portal AI writes the objectives, materials, steps and pictures.
Sign up FREEFree forever · no credit card needed. Members get all 5,100+ lessons for $14.99/month, with the first 7 days free.