Kitchen Science Fizz Ratio: When Does More Baking Soda Stop Helping?
Overview
Graph balloon gas to find where proportional stops.
Description
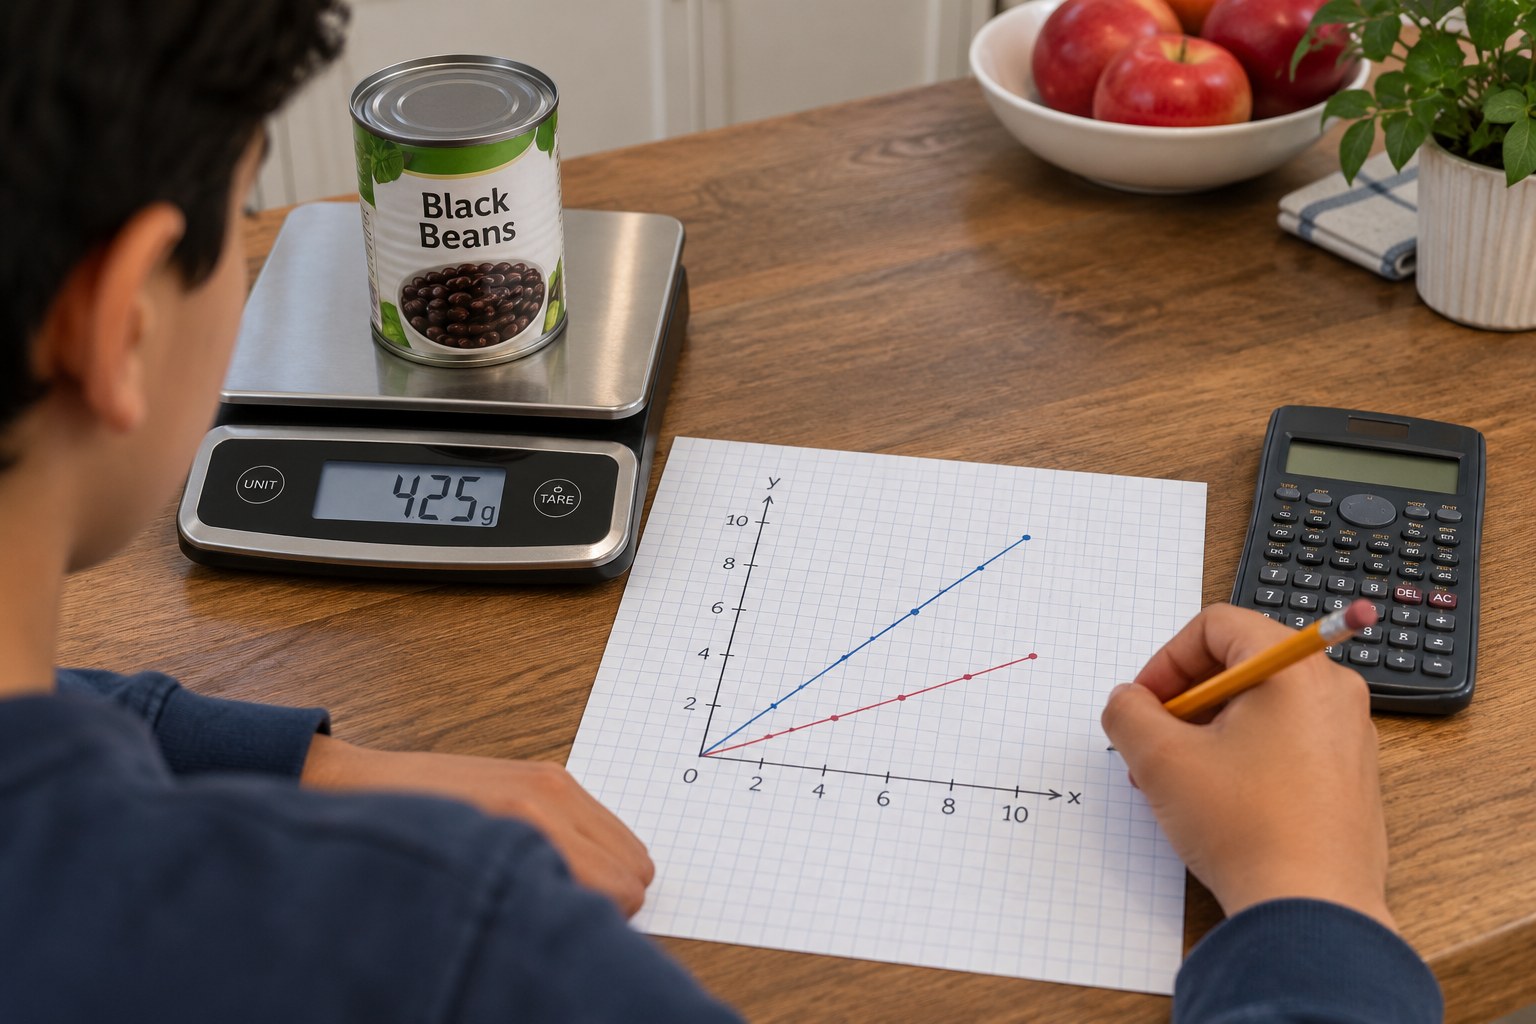
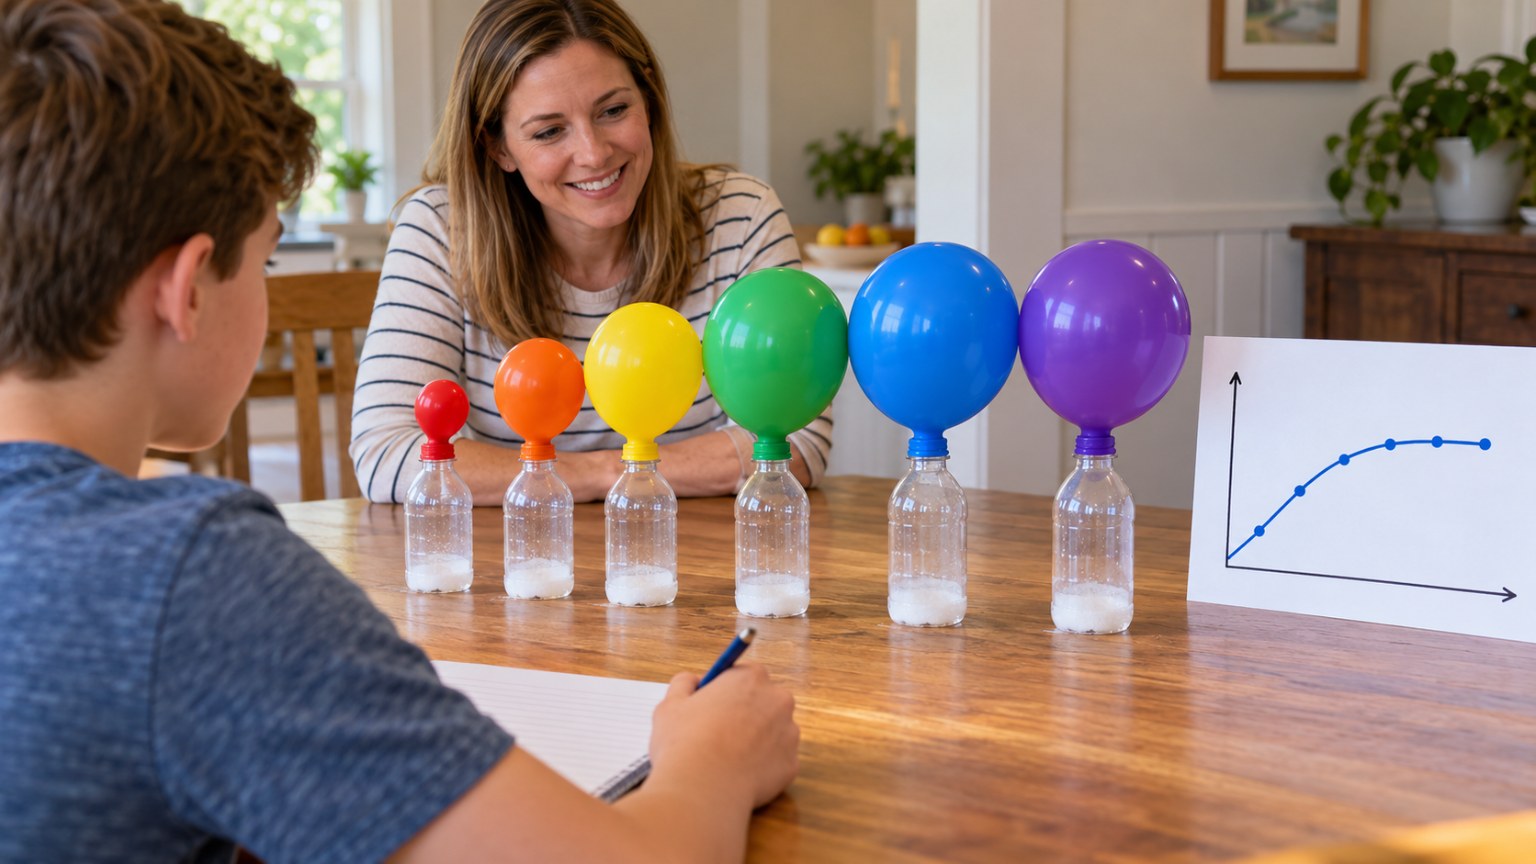
Your teen keeps the vinegar the same and adds more and more baking soda, catching the gas in balloons. They estimate each balloon's gas volume from its circumference, graph the results, and decide where the relationship is proportional and where it stops because the vinegar runs out.
Objective
Your teen will collect data on baking soda vs. gas volume, use a table and graph to decide whether the relationship is proportional, find the unit rate in the proportional part, and explain why it levels off.
Standards
Materials
| Item | Quantity |
|---|---|
| White vinegar (5% acidity) | 1 1/2 cups |
| Baking soda | 1/4 cup |
| Empty plastic bottles of the same size (16-20 oz) | 6, or reuse 2 with rinsing |
| Balloons (latex-free if anyone is allergic) | 6, plus spares |
| Small funnel or rolled paper cone | 1 |
| Measuring spoons (1/4, 1/2, 1 teaspoon) and 1/4 cup | 1 set |
| String and a ruler or a soft tape measure | 1 |
| Calculator, graph paper and pencil | 1 each |
| Safety glasses | 1 per person |
Vocabulary
Preparation
- Measure 1/4 cup (60 mL) of vinegar into each of 6 bottles.
- Using the funnel, put baking soda into 6 balloons: 1/4, 1/2, 3/4, 1, 1 1/2 and 2 teaspoons. Label each balloon with a marker.
- Copy the data table below. Wear safety glasses.
Introduction
Ask: "If 1 teaspoon of baking soda makes a balloon this big, how big would 2 teaspoons make it? Let's see if the answer is really 'twice as big.'"
What do you expect a graph of a proportional relationship to look like?
Could anything stop the gas from increasing forever?
Steps
Conclusion
Ask: "Was the whole relationship proportional? What would you change to make more gas?" (Add more vinegar; the vinegar was the limiting reactant.)
Make your own lesson plan in minutes
Describe a topic and Resource Portal AI writes the objectives, materials and steps for your group.
Try Resource Portal AI