Lesson planIf Heroes Had Animal Strength: Proportional Relationships
Math45 minutesGrades: 7th, 8th
Overview
Use proportions to calculate what an animal-powered hero could do.
Description
Your teen invents a hero with 'animal-ratio' powers, uses unit rates from real animals (an ant's carrying ratio, a flea's jump-to-body-length ratio) to build tables, graphs and equations for what the hero could do, and checks whether the relationships are proportional.
Objective
Your teen will identify the constant of proportionality in tables, graphs and equations, represent the relationship as y = kx, and decide whether a relationship is proportional by checking for a straight line through the origin.
Standards
7.RP.2aMath · Grade 7 · Ratios & Proportional Relationships Decide whether two quantities are in a proportional relationship, e.g., by testing for equivalent ratios in a table or graphing on a coordinate plane and observing whether the graph is a straight line through the origin.
7.RP.2bMath · Grade 7 · Ratios & Proportional Relationships Identify the constant of proportionality (unit rate) in tables, graphs, equations, diagrams, and verbal descriptions of proportional relationships.
7.RP.2cMath · Grade 7 · Ratios & Proportional Relationships Represent proportional relationships by equations.
Materials
| Item | Quantity |
|---|
| Graph paper | 2 sheets per teen |
| Ruler and pencil | 1 each per teen |
| Calculator | 1 per teen |
| Tape measure | 1 to share |
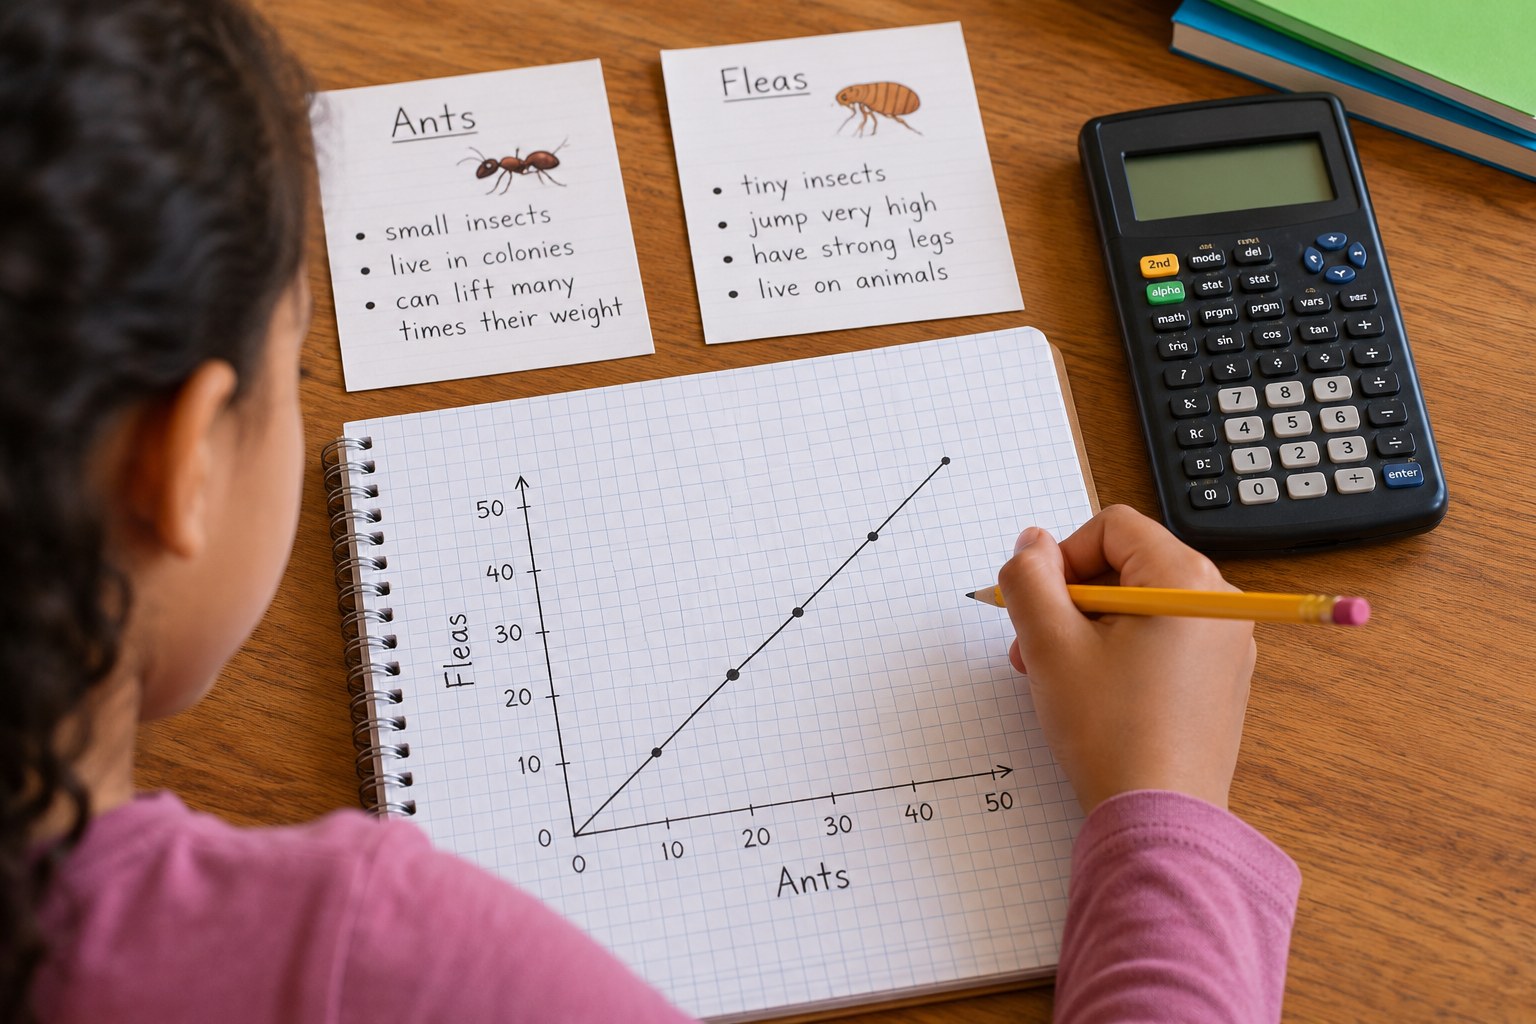
| Animal ratio cards (see Additional Sections) | 1 set |
Vocabulary
Proportional relationship
Two quantities that always have the same ratio, so y = kx.
Constant of proportionality
The number k that you multiply x by to get y; the unit rate.
Unit rate
A rate per one unit, such as 50 pounds of load per pound of body weight.
Origin
The point (0, 0) on a graph.
Preparation
- Copy the animal ratio cards. Measure your teen's height with the tape measure (or use a known value).
- Draw two empty tables with columns x and y on the board or paper.
Introduction
Ask: 'Some ants can carry 50 times their body weight. If you could do that, could you lift a car?' Let your teen estimate before calculating.
What does 'times their body weight' mean as a ratio?
Would a heavier person lift more with the same ratio?
Steps
1Step 1
Pick the hero's power
(5 min) Your teen chooses an animal ratio card and invents an original hero who has that ratio, like a hero with flea-jump legs. They write the unit rate as a constant k with units.
2Step 2
Build the table
(10 min) Your teen makes a table for 5 different hero sizes (for example, body weights of 50, 80, 100, 120 and 150 pounds) and calculates what each could lift or jump using y = kx. They divide y by x in each row to confirm the ratio stays the same.
3Step 3
Graph it
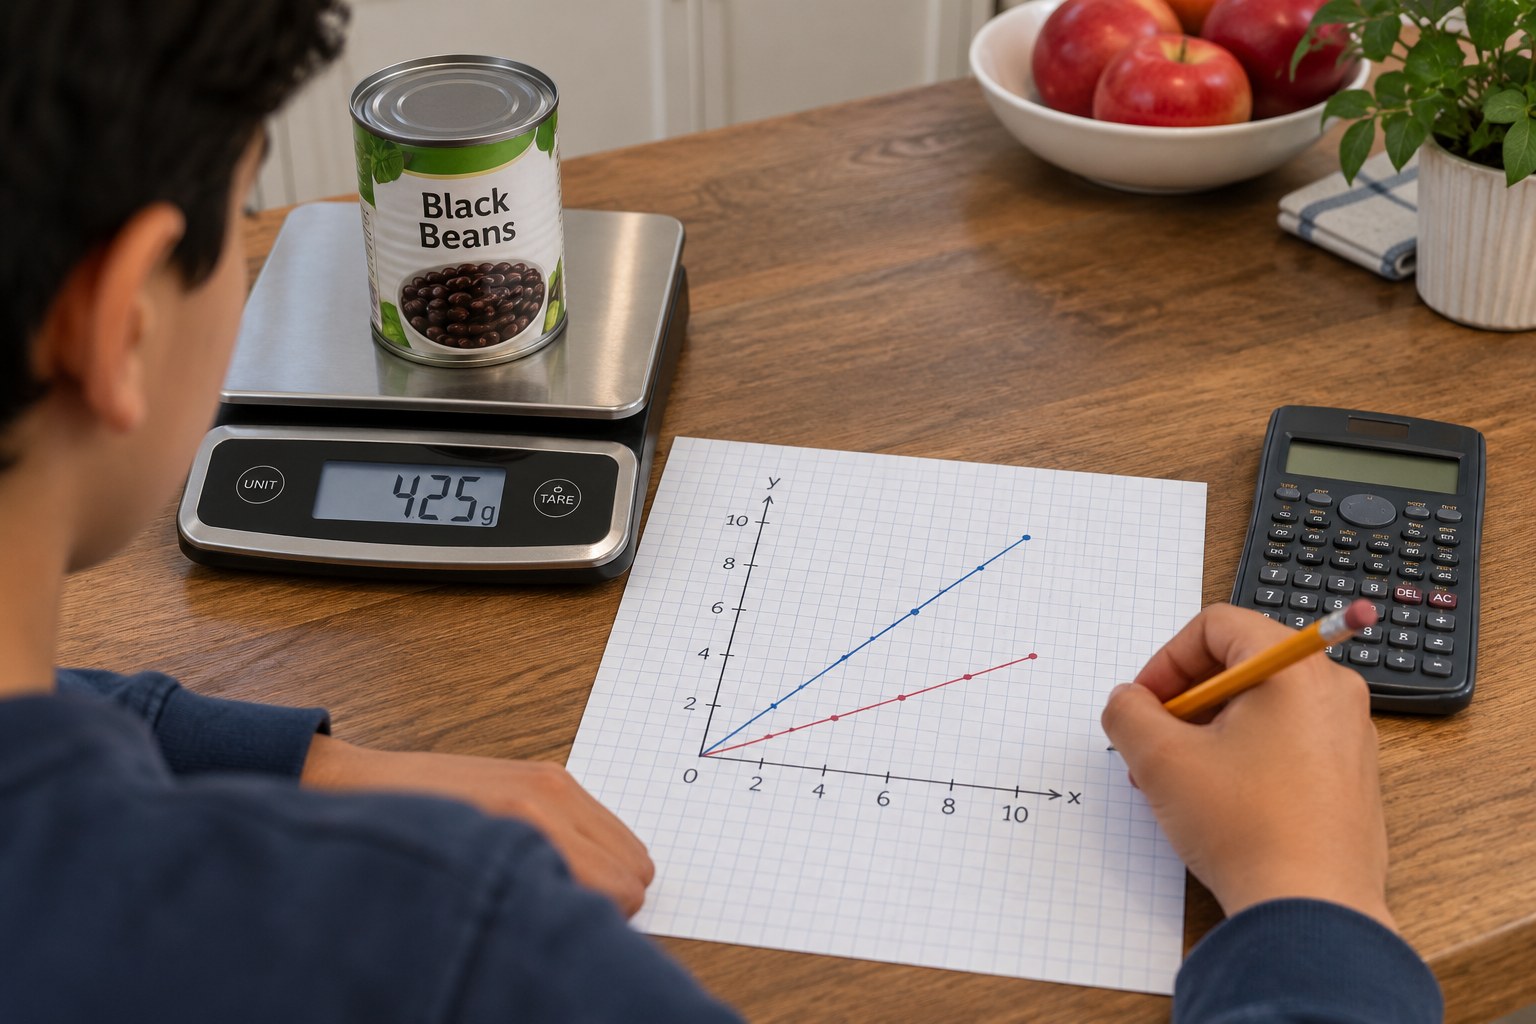
(10 min) Your teen graphs the table on graph paper, labeling the axes with units. They check that the points form a straight line through the origin and find the point (1, k) on the line.
4Step 4
Proportional or not?
(10 min) Your teen compares two new tables: a hero who lifts 50 times body weight, and a hero whose suit always adds a 200-pound lift on top of human strength. They decide which relationship is proportional and explain why using the graph and the equation.
5Step 5
Reality check
(7 min) Your teen calculates their own hero numbers using their real weight or height, then discusses why real animal ratios do not scale up to human size (bigger bodies have more weight per unit of muscle area). They write two sentences comparing their hero's numbers with the human comparison on the ratio card.
Conclusion
Ask: 'How can you spot the constant of proportionality in a table, a graph and an equation? Why did the suit hero's graph not go through the origin?'
Make your own lesson plan in minutes
Describe a topic and Resource Portal AI writes the objectives, materials and steps for your group.
Try Resource Portal AI