
Lesson plans for 8.EE.5
Math · Grade 8 · Expressions & Equations
Graph proportional relationships, interpreting the unit rate as the slope of the graph. Compare two different proportional relationships represented in different ways.
6 ready-to-teach lesson plans aligned to this standard. Each includes objectives, a materials list, vocabulary and step-by-step activities.

Vinaigrette Ratios as Slopes: Two Dressings, One Graph
Graph two dressing recipes, taste them, then dress dinner.

Density Is a Slope: Graphing Mass vs. Volume for Water and Oil
Find density as the slope of a mass-volume graph.

Local vs. Express Train: Compare Speeds on a Distance-Time Graph
Graph two trains and let the slope reveal which is faster.
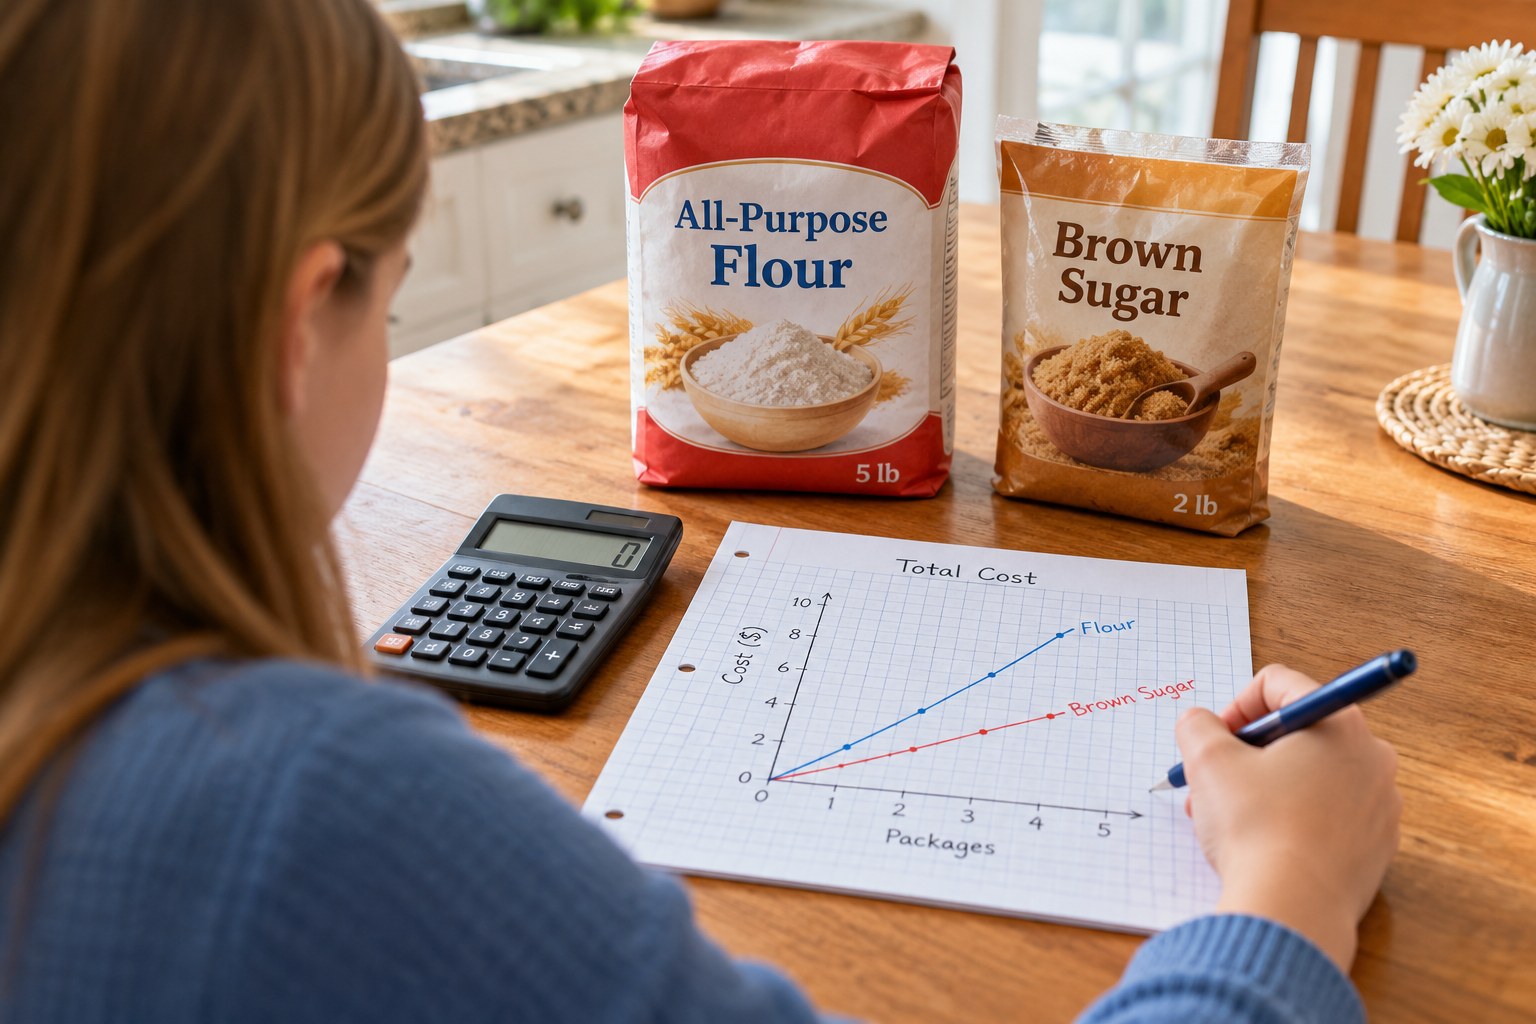
Trail Mix Price Showdown: Unit Rate as Slope Across a Table, an Equation and a Graph
Compare trail mix prices as slopes on a graph.

Two Faucets, Two Rates: Graphing Fill Speed as Slope
Time two faucets and compare their rates as slopes.

Tin-Can Phones to 5G: Analog vs. Digital Signals
Explore the world of communication technology by building tin-can phones and understanding the evolution of signals from analog to digital.
See all grade 8 standards with lesson plans
Make a lesson like this in a minute
Pick a topic, grade, group size and length. Resource Portal AI writes the objectives, materials, steps and pictures.
Sign up FREEFree forever · no credit card needed. Members get all 5,100+ lessons for $14.99/month, with the first 7 days free.