Lesson planHalloween Treat Sort and Picture Graph
Math30 minutesGrades: K, 1st, 2nd
Overview
Sort a treat pile and build a picture graph.
Description
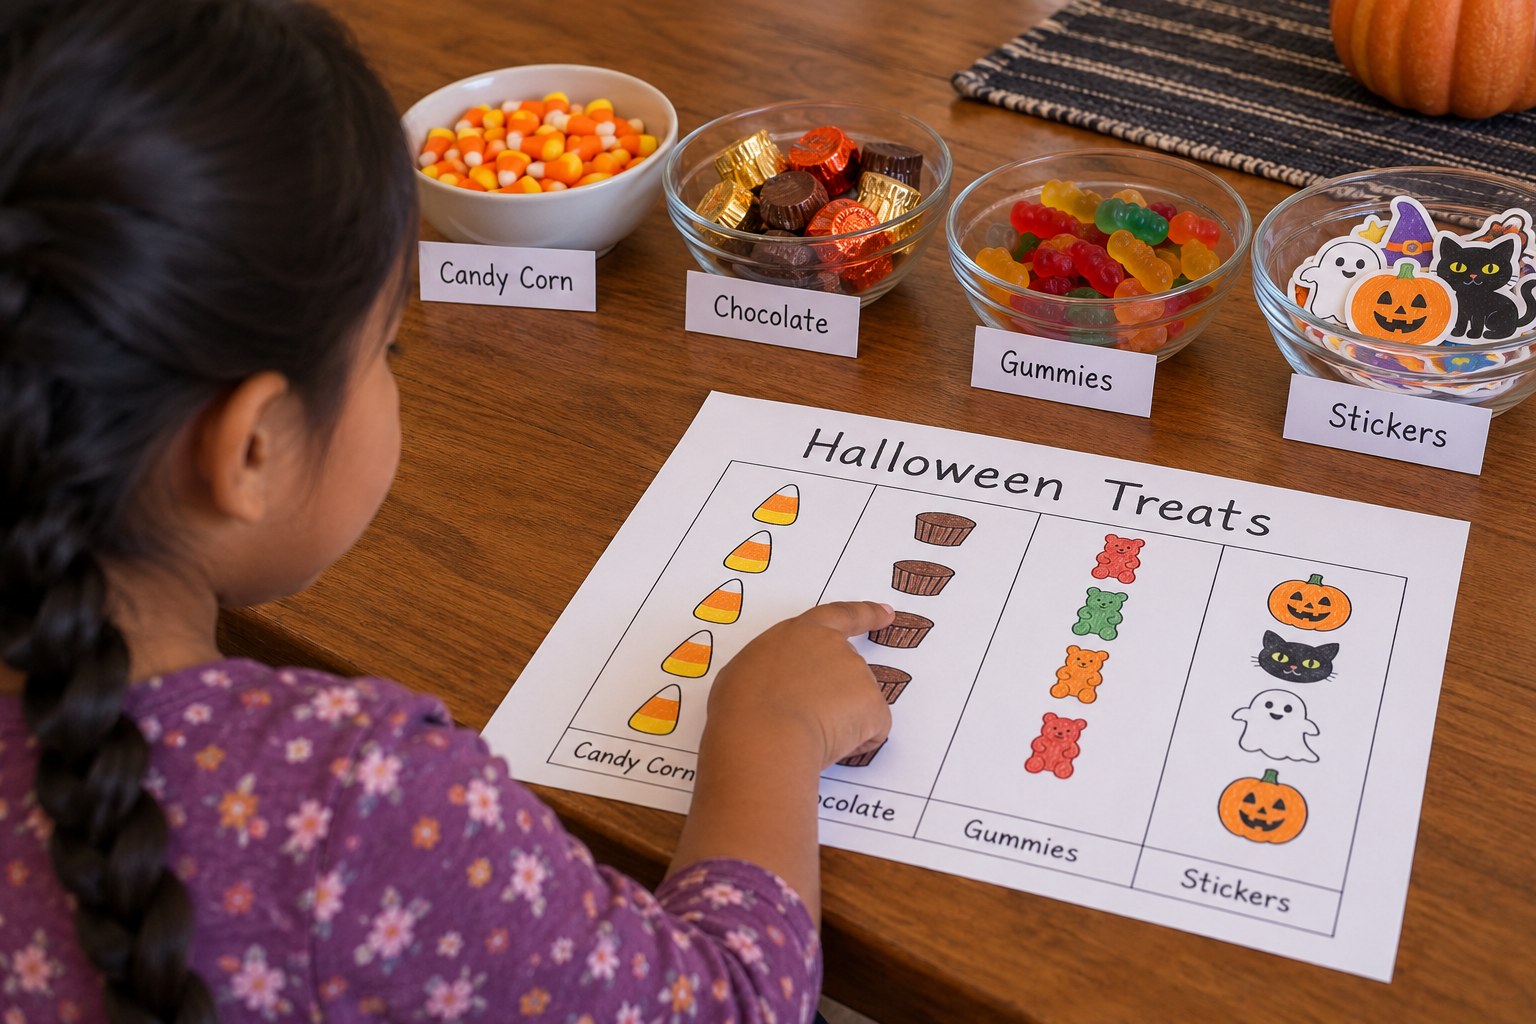
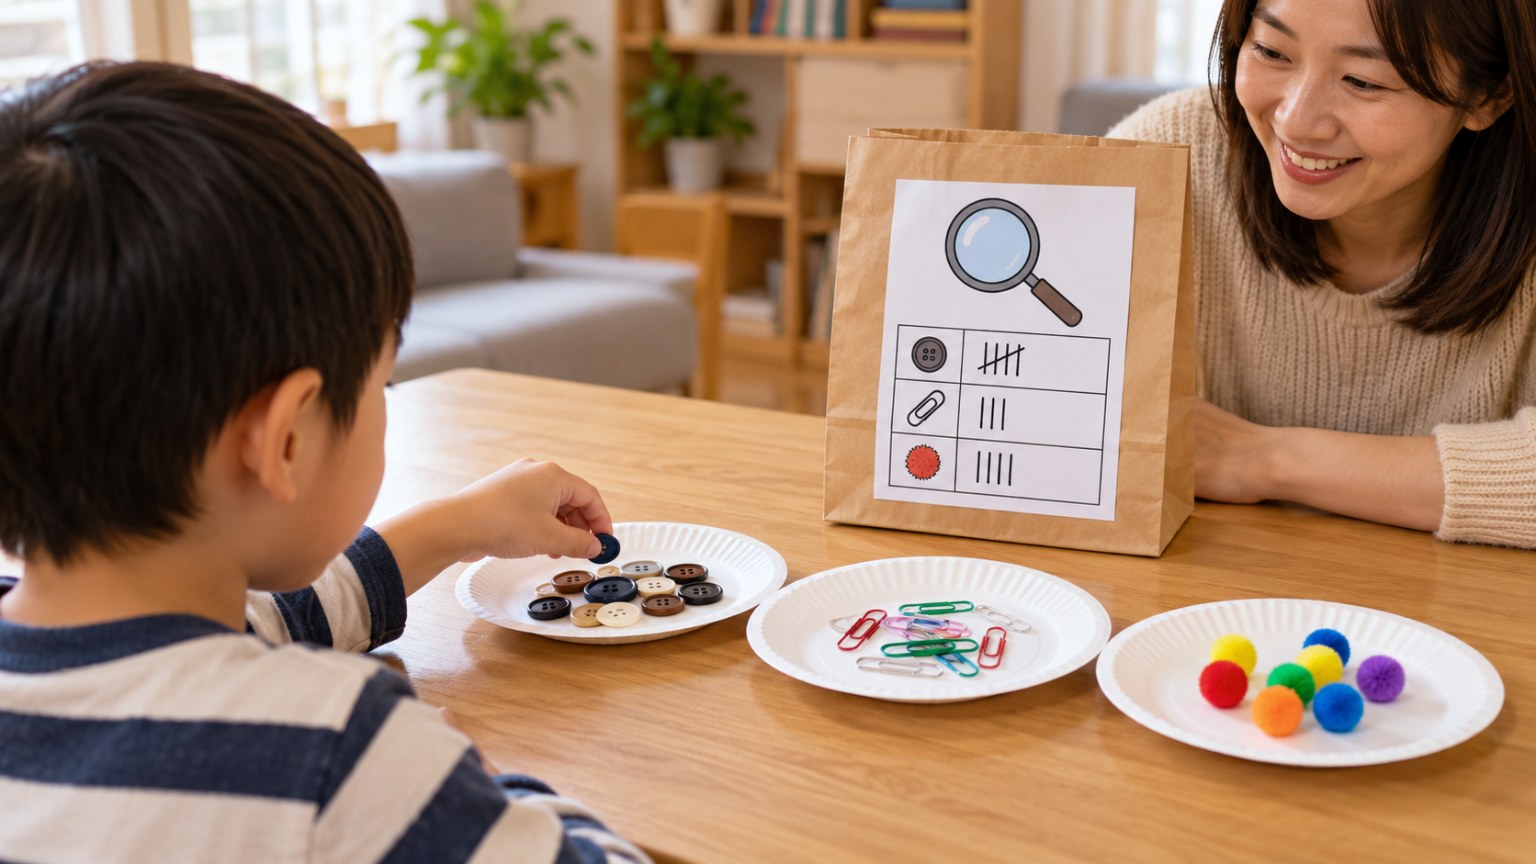
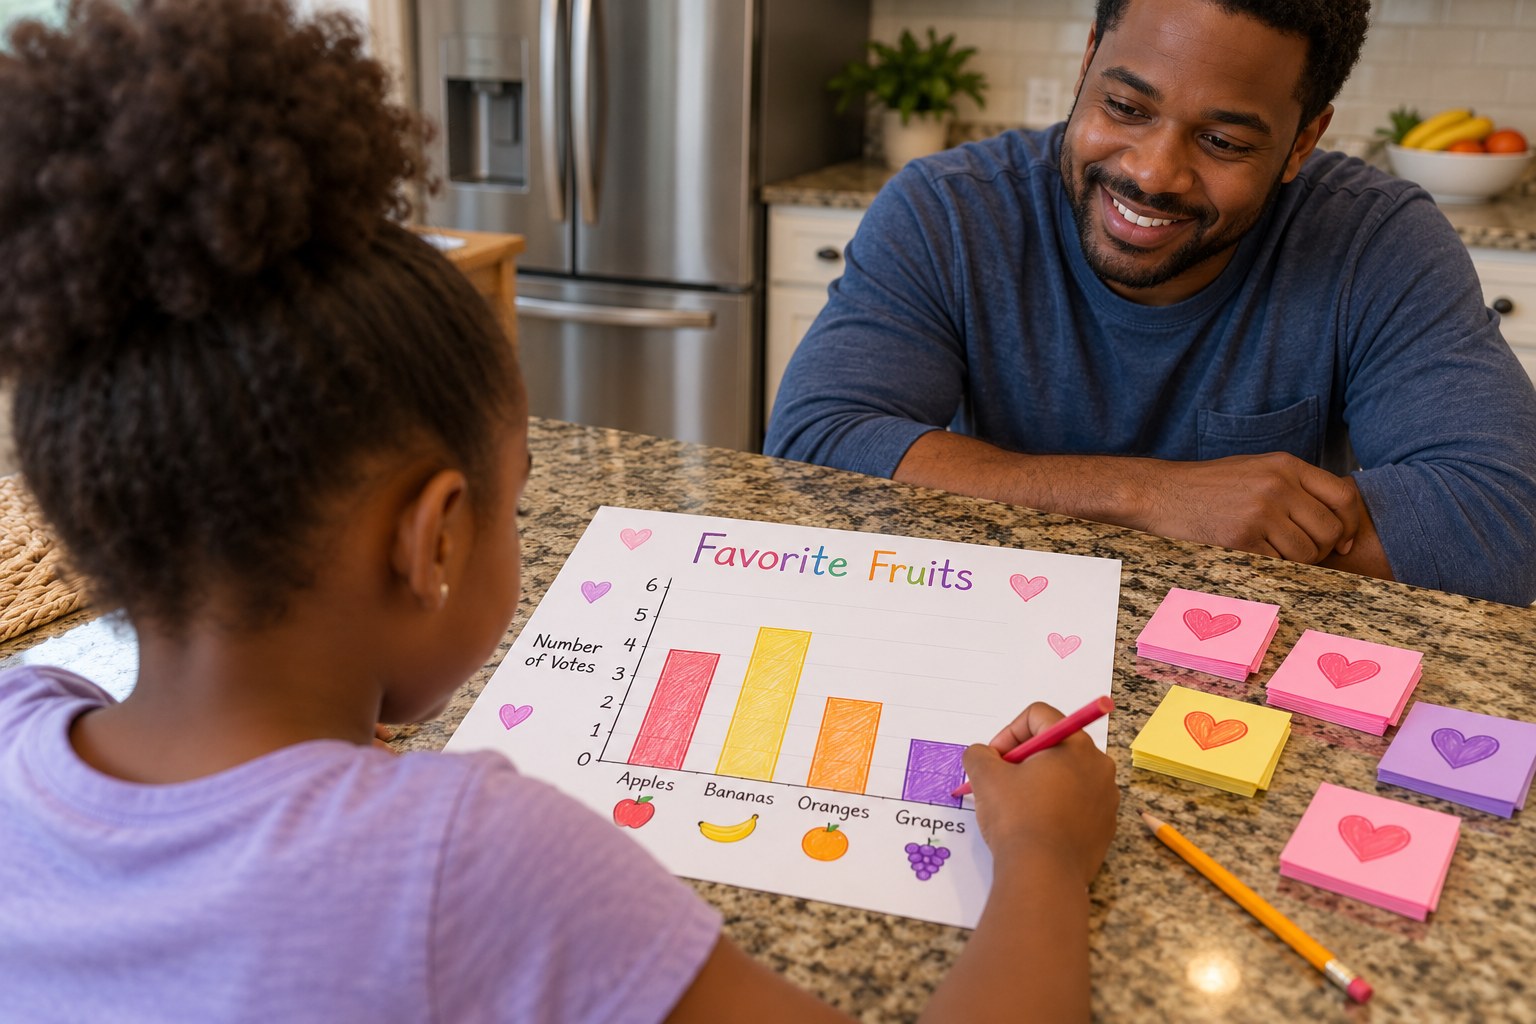
Your child sorts a small pile of Halloween treats (or stickers, erasers and small toys) into categories, counts each group, builds a picture graph on a paper grid, and answers 'how many more' and 'how many in all' questions.
Objective
Your child will sort objects into categories, count how many are in each, show the data on a picture graph, and answer questions comparing the groups.
Standards
1.MD.4Math · Grade 1 · Measurement & Data Organize, represent, and interpret data with up to three categories; ask and answer questions about the total number of data points, how many in each category, and how many more or less are in one category than in another.
2.MD.10Math · Grade 2 · Measurement & Data 10. Draw a picture graph and a bar graph (with single-unit scale) to represent a data set with up to four categories. Solve simple put-together, take-apart, and compare problems using information presented in a bar graph.
K.MD.3Math · Grade K · Measurement & Data Classify objects into given categories; count the numbers of objects in each category and sort the categories by count.
Materials
| Item | Quantity |
|---|
| Wrapped treats, stickers, small erasers or toy pieces | 15-25 items per child or group |
| Large paper with a 4-column grid drawn on it | 1 per child |
| Crayons or markers | 1 set to share |
| Bowls or muffin tin for sorting | 1-4 |
| Ruler | 1 |
Vocabulary
Sort
To put things into groups that are alike.
Category
A group of things that share something, like all the chocolate treats.
Graph
A picture that shows how many are in each group.
Data
Information we collect, like counts.
Preparation
- Draw a grid on paper with 4 columns about 1 inch wide and 10 rows tall. Leave space at the bottom for column labels.
- Gather 15-25 small items. For families who skip Halloween or limit sweets, use fall stickers, leaves, small toys or buttons instead.
Introduction
Dump the pile of treats on the table and ask: 'Which kind do we have the most of? How could we find out without counting all of them in one big messy pile?'
What are different ways we could sort these?
How could a picture help us remember how many of each we have?
Steps
1Step 1
Choose categories and sort
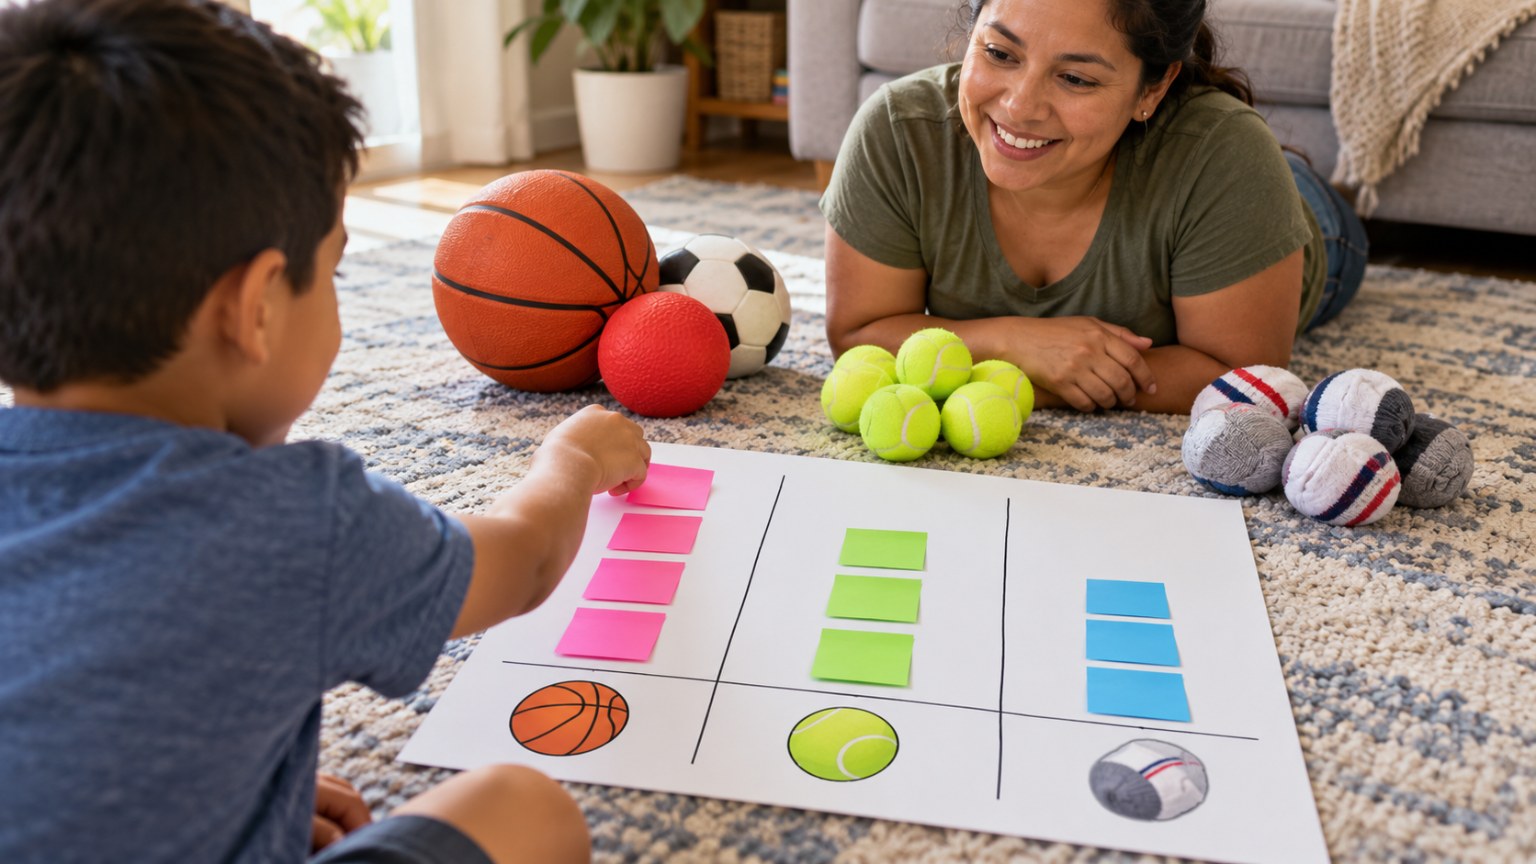
(7 min) Your child decides how to sort the pile, such as chocolate, fruity, lollipops and other, or by color for stickers. They place each item into a bowl or muffin cup for its group.
2Step 2
Count each group
(5 min) Your child counts each group, touching each item once and moving it aside as they count. Kindergartners say the number; 1st and 2nd graders write it on a sticky note by the bowl.
3Step 3
Build the picture graph
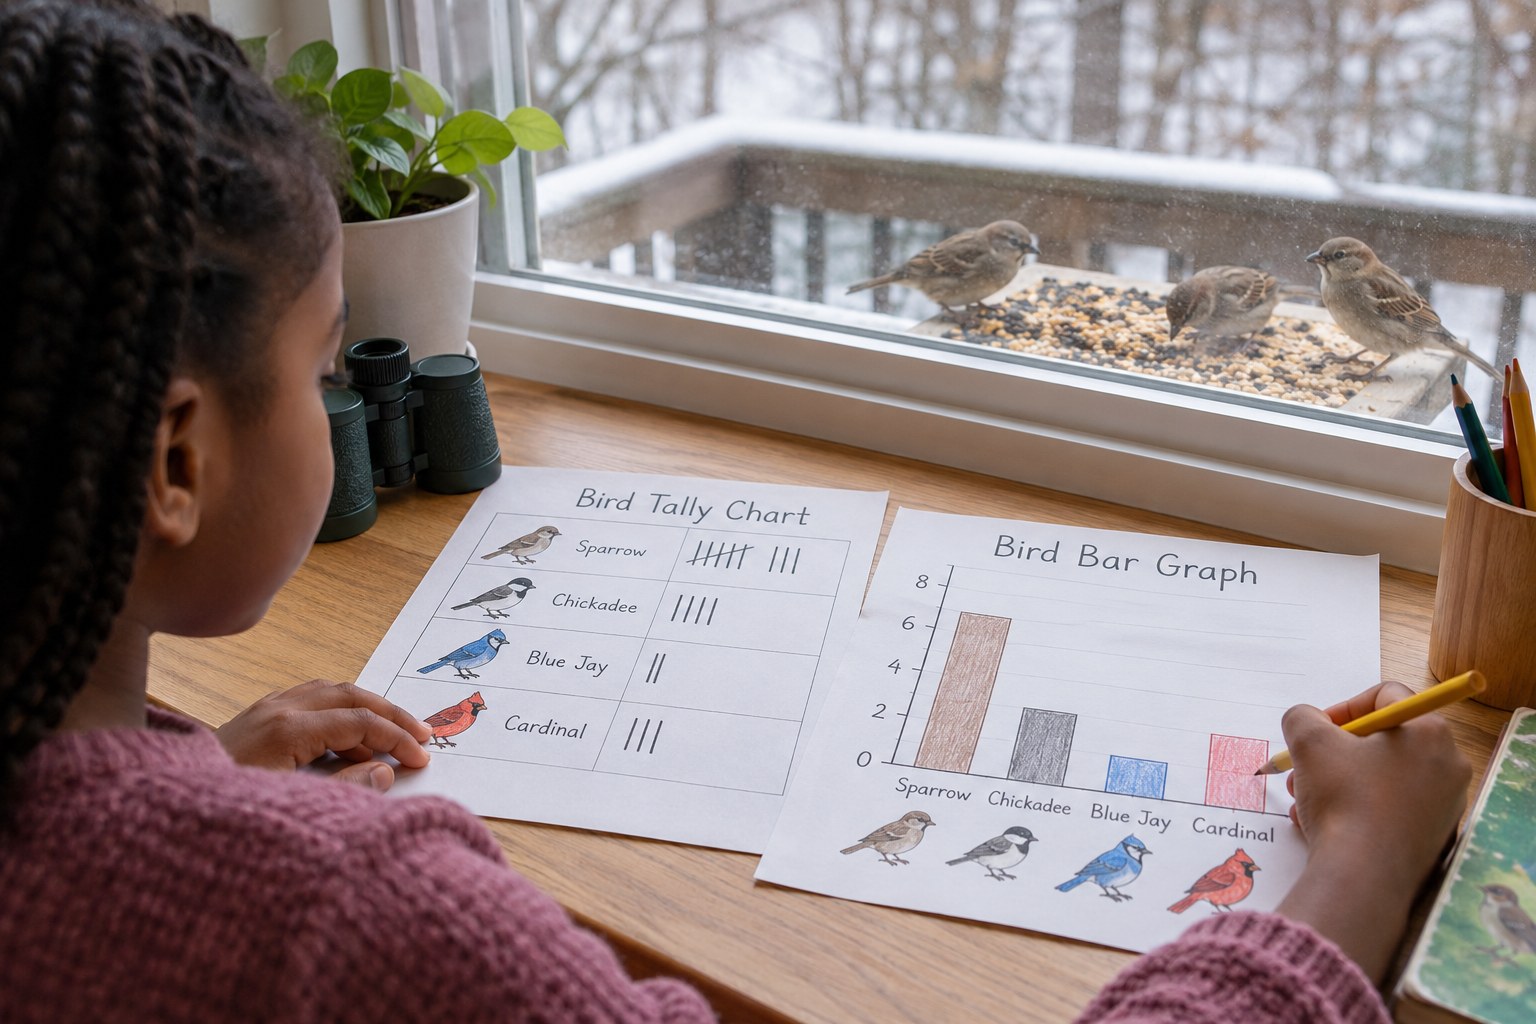
(10 min) Your child writes or draws a label under each column and colors one box or draws one small picture for each item in that group, starting at the bottom. Remind them to fill boxes from the bottom up with no gaps so the columns are fair to compare.
4Step 4
Ask graph questions
(6 min) Take turns asking questions about the graph, such as which group has the most, which has the fewest, how many more chocolate than fruity, and how many treats in all. 2nd graders write a number sentence for each answer.
Conclusion
Ask: how did the graph help you answer questions faster than counting the pile? People use graphs every day to compare amounts.
Make your own lesson plan in minutes
Describe a topic and Resource Portal AI writes the objectives, materials and steps for your group.
Try Resource Portal AI