Spring Brings Longer Days: Sunrise Clocks and a Daylight Bar Graph
Overview
Graph how spring days grow longer each month.
Description
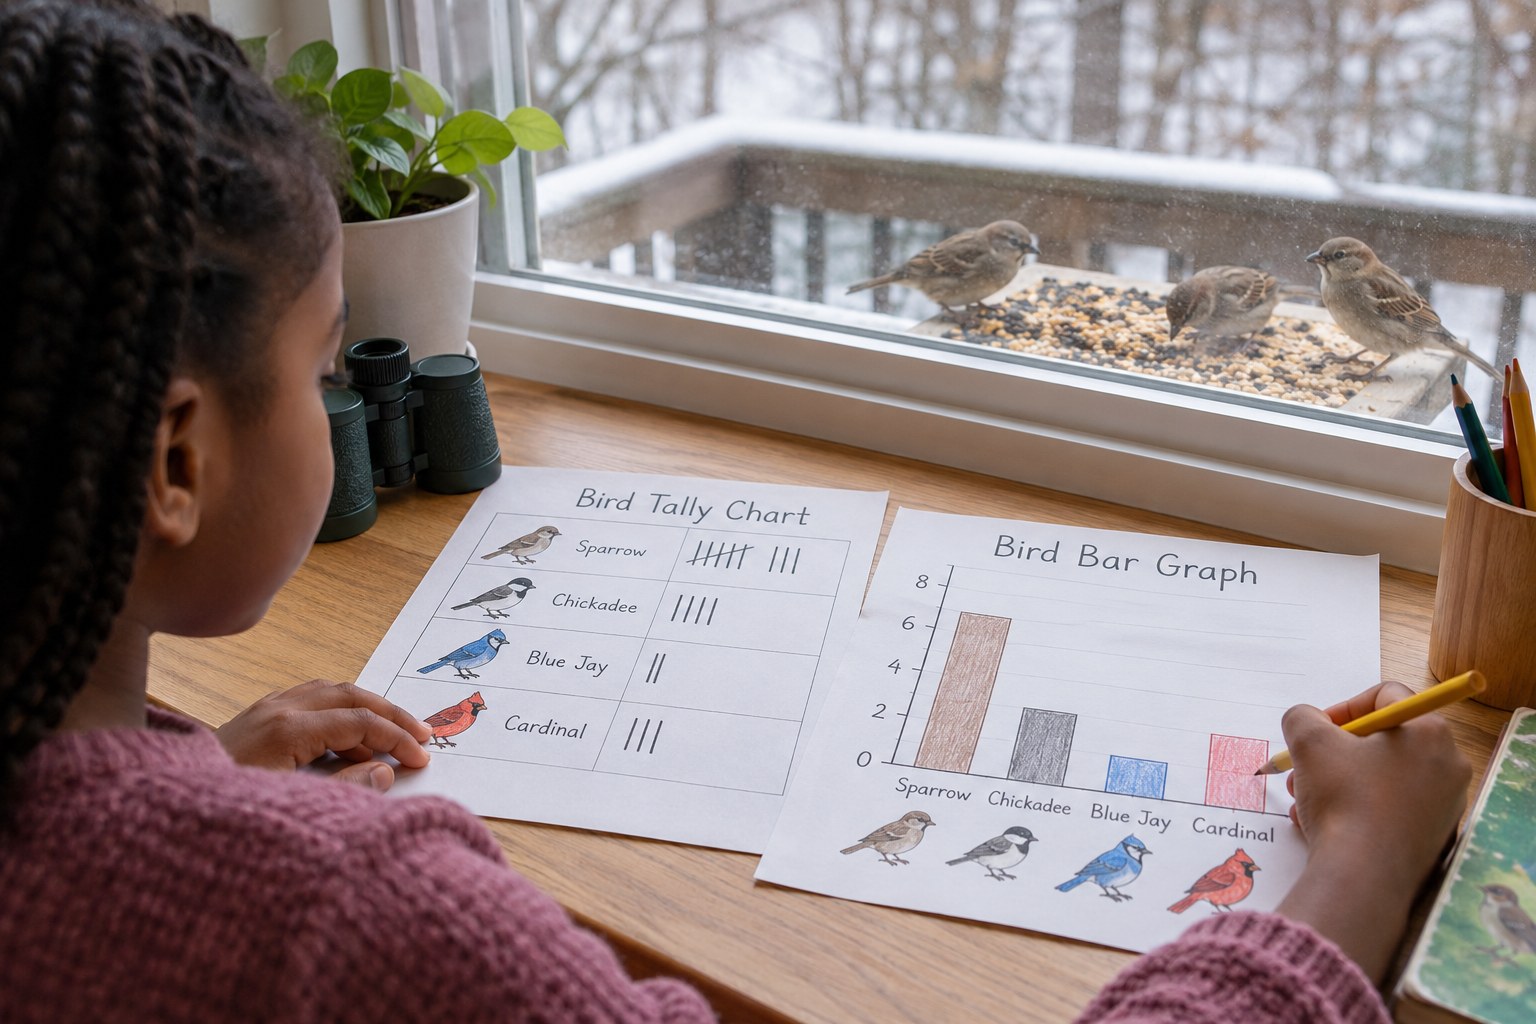
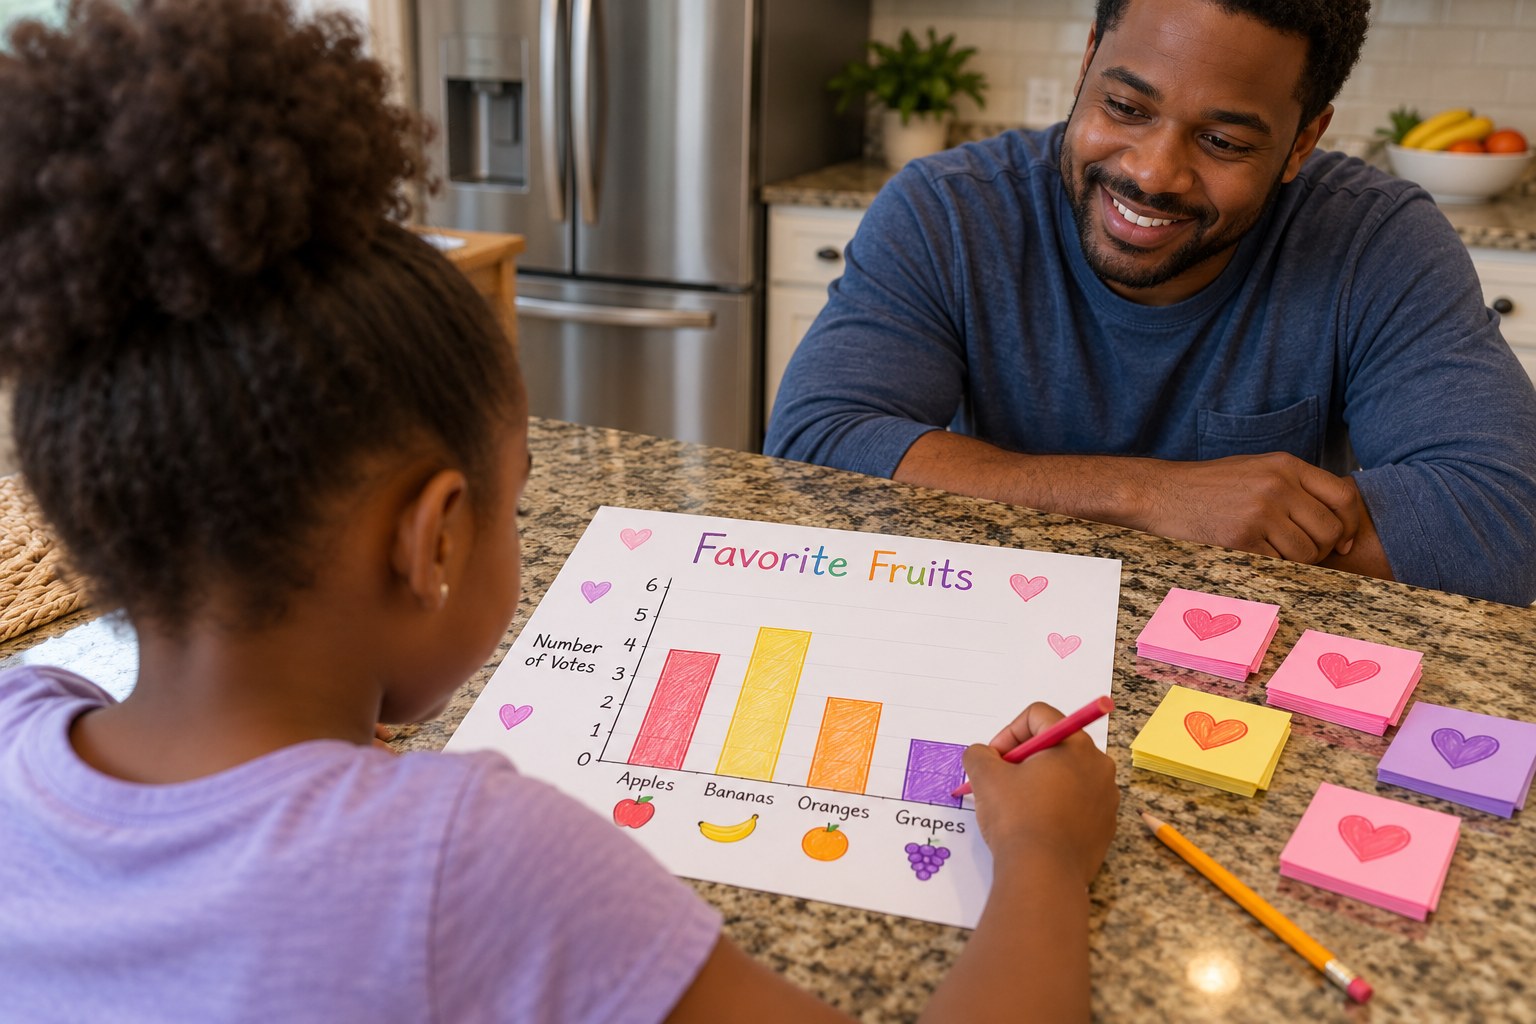
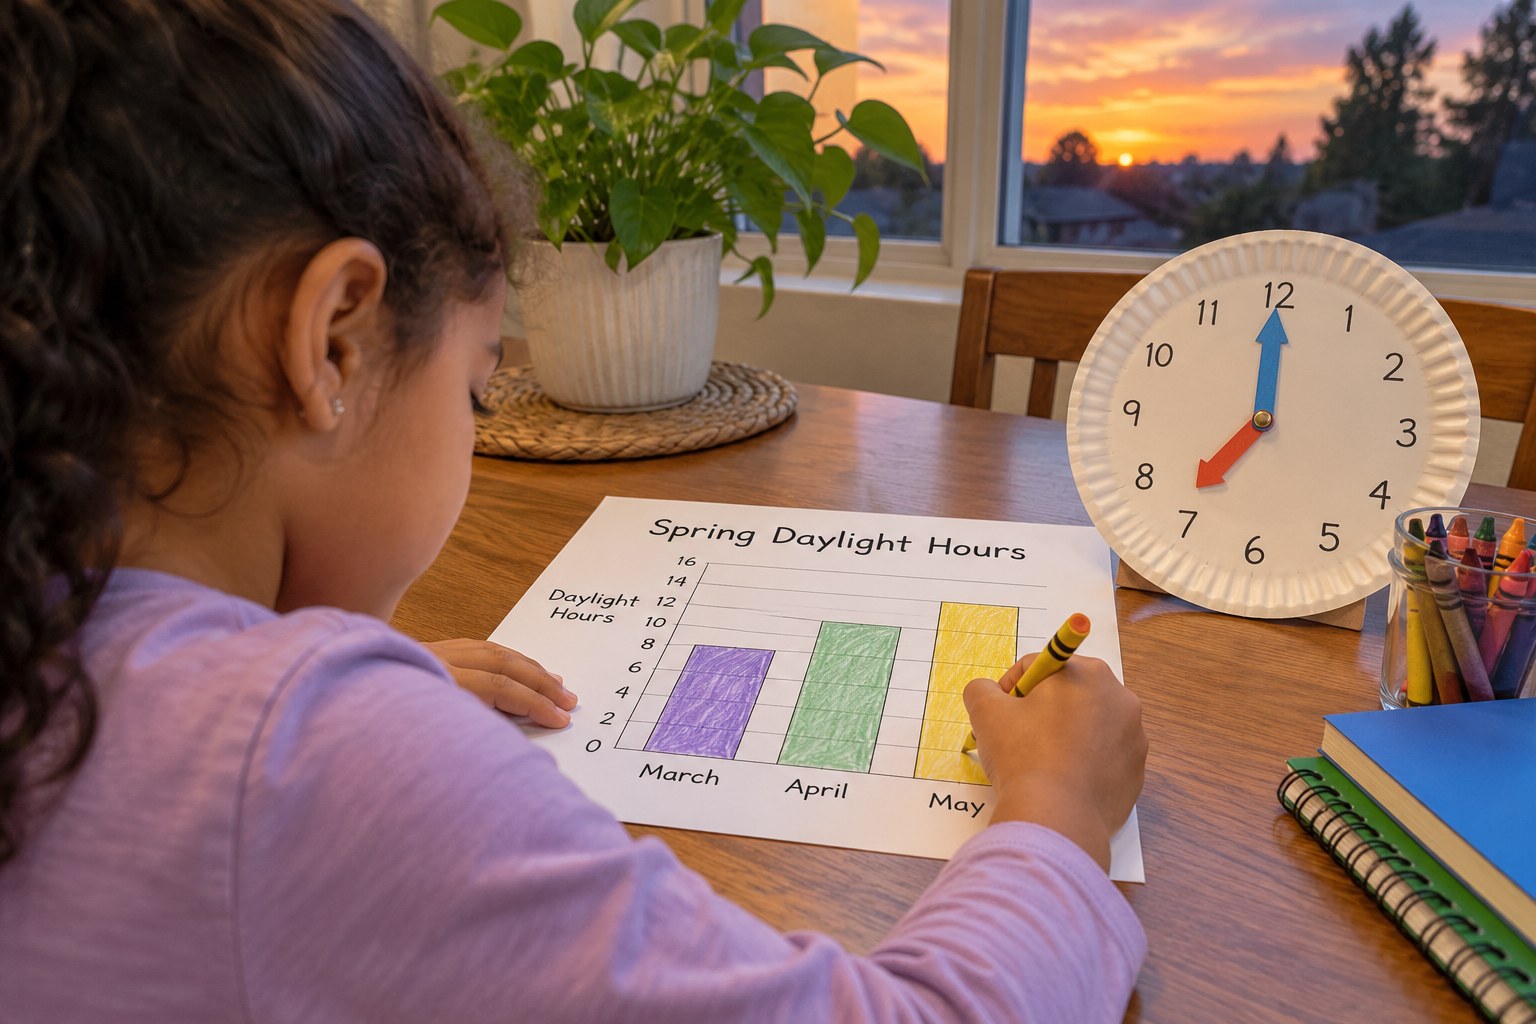
Your child learns that spring days get longer, reads sunrise and sunset times on clocks, and builds a bar graph showing how many hours of daylight a central California town gets in February, March, April and May.
Objective
Your child will tell and write sunrise and sunset times to the nearest five minutes using a.m. and p.m., draw a bar graph of daylight hours for four months, and answer compare questions from the graph.
Standards
Materials
| Item | Quantity |
|---|---|
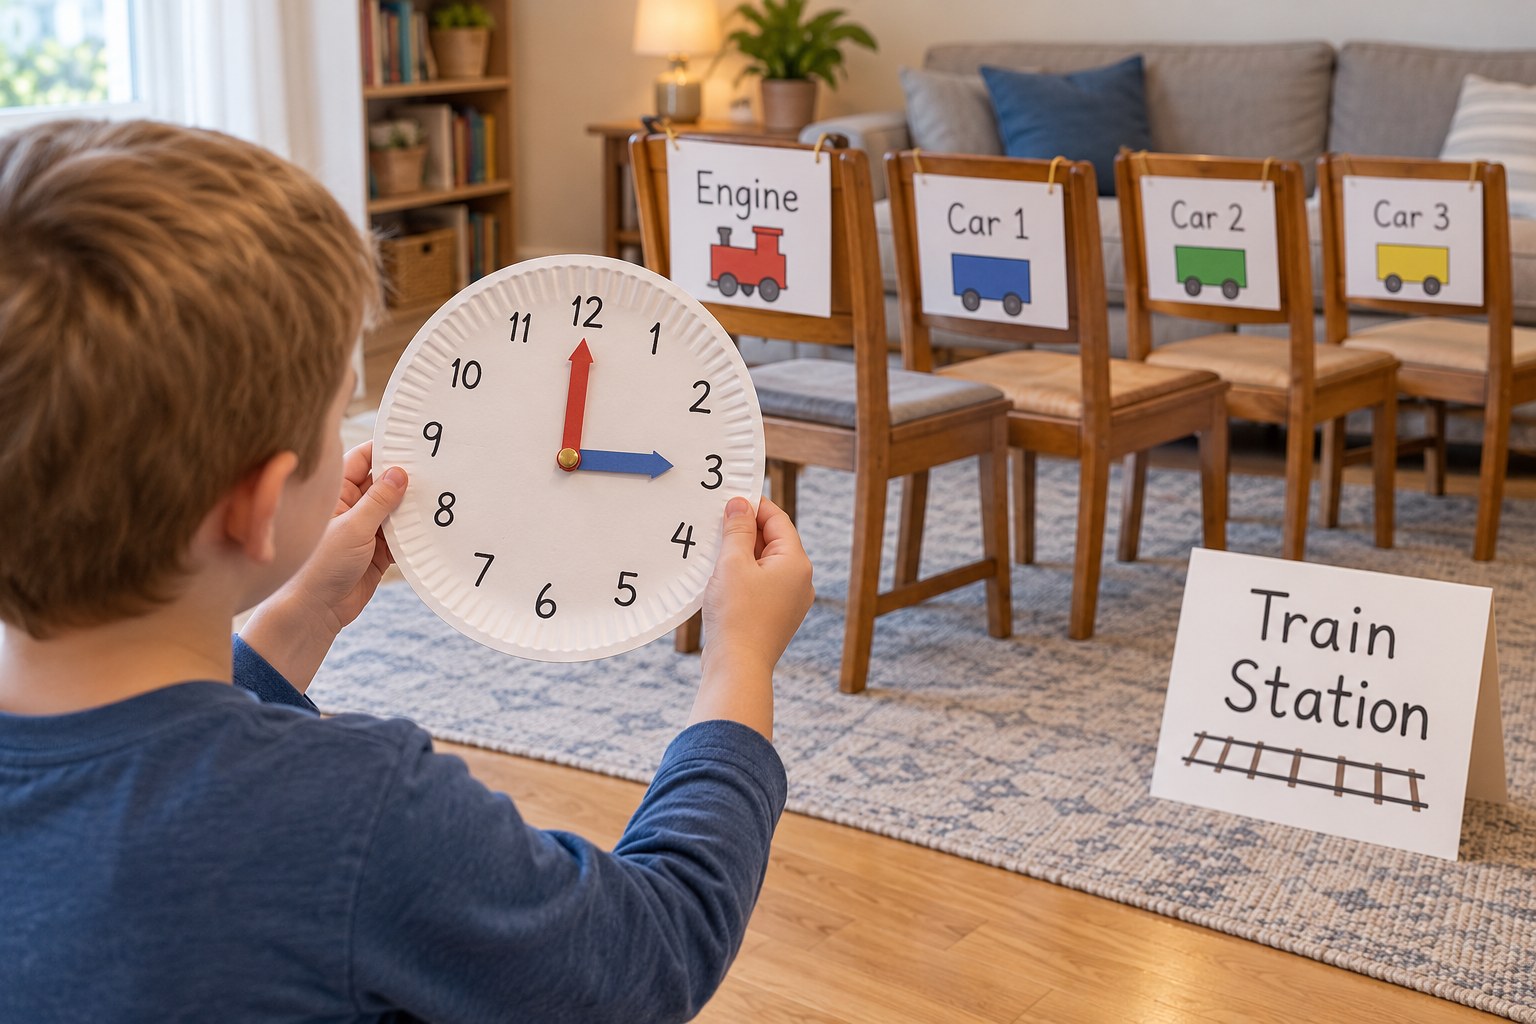
| Paper plate clock with brad and paper hands (or a real analog clock) | 1 |
| Grid or lined paper | 2 sheets per child |
| Crayons in yellow and one other color | 1 set |
| Ruler | 1 |
| Optional: phone weather app showing today's sunrise and sunset | 1 |
Vocabulary
Preparation
- Make a paper plate clock if you don't have an analog clock: write 1-12 around a plate and attach two paper hands with a brad.
- Copy the 'Daylight data' table from the additional sections onto a sheet of paper.
Introduction
Ask: 'In winter, is it dark when you eat dinner? What about in late spring?' Explain that in spring, the sun stays up a little longer every single day.
Have you noticed it staying light later in the evening?
Why might animals and plants like longer days?
Steps
Conclusion
Ask: why do the bars get taller through spring? Explain that the Earth's tilt makes our part of the world lean toward the sun in spring, so we get more daylight until the first day of summer.
Make your own lesson plan in minutes
Describe a topic and Resource Portal AI writes the objectives, materials and steps for your group.
Try Resource Portal AI