
6.SP: lesson ideas
Math · Grade 6 · Statistics & Probability
Statistics and Probability
Teaching this standard
6.SP is part of Grade 6 Math (Statistics & Probability). The lessons below are aligned to standards right next to it, so they build the same skills.
There is no ready-made lesson for this exact standard in the library yet. Ria, the Resource Portal AI assistant, can write one in about a minute: tell it the standard, the grade and how much time you have, and it plans the objectives, materials, vocabulary and step-by-step activities.
Lesson plans for related grade 6 standards
Why Free Kicks Curve: The Magnus Effect
Discover the physics behind why free kicks curve with the Magnus Effect! Engage in experiments and collaborative activities to understand this fascinating concept in…
Engineer a Capsule That Survives a 3m Drop
Students will engineer a capsule to survive a drop, focusing on teamwork and design thinking.
Grow a Garden, for Real
Engage students in hands-on learning by designing and planning a garden project that promotes collaboration, critical thinking, and problem-solving skills.
Real or AI? Spotting Deepfake Images
Explore the world of deepfake images and develop skills to critically analyze media in this engaging lesson focused on technology and its societal impacts.
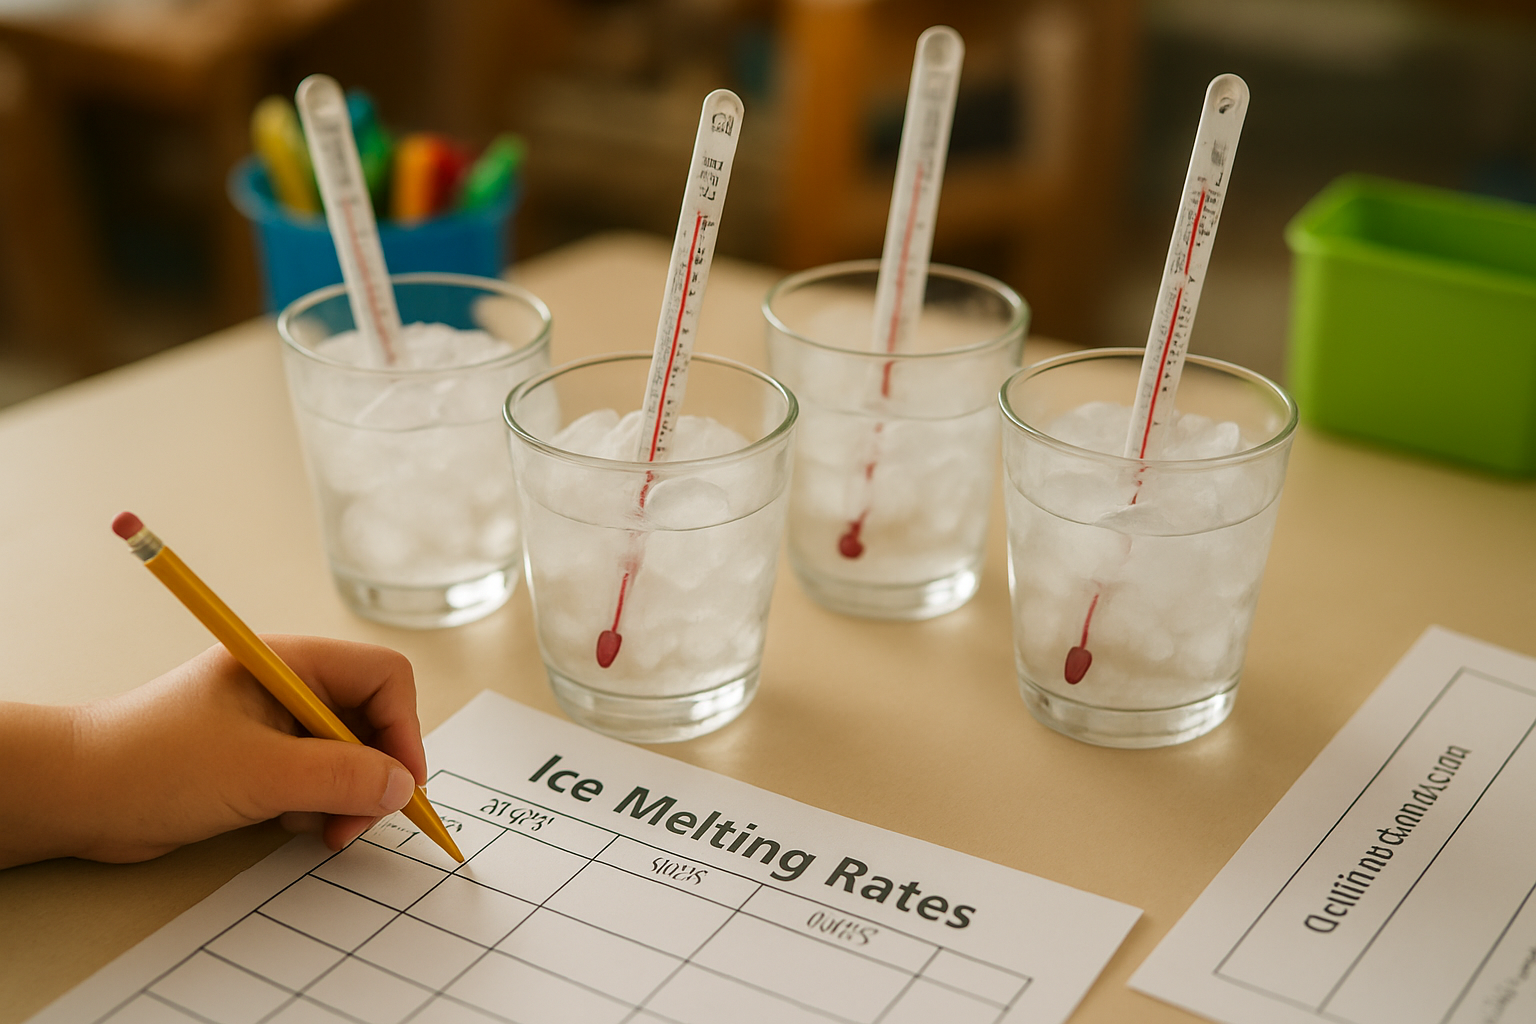
Bottle Wars: Which Tumbler Keeps Ice Longest?
Explore the science of insulation by testing different materials to see which keeps ice from melting the longest!
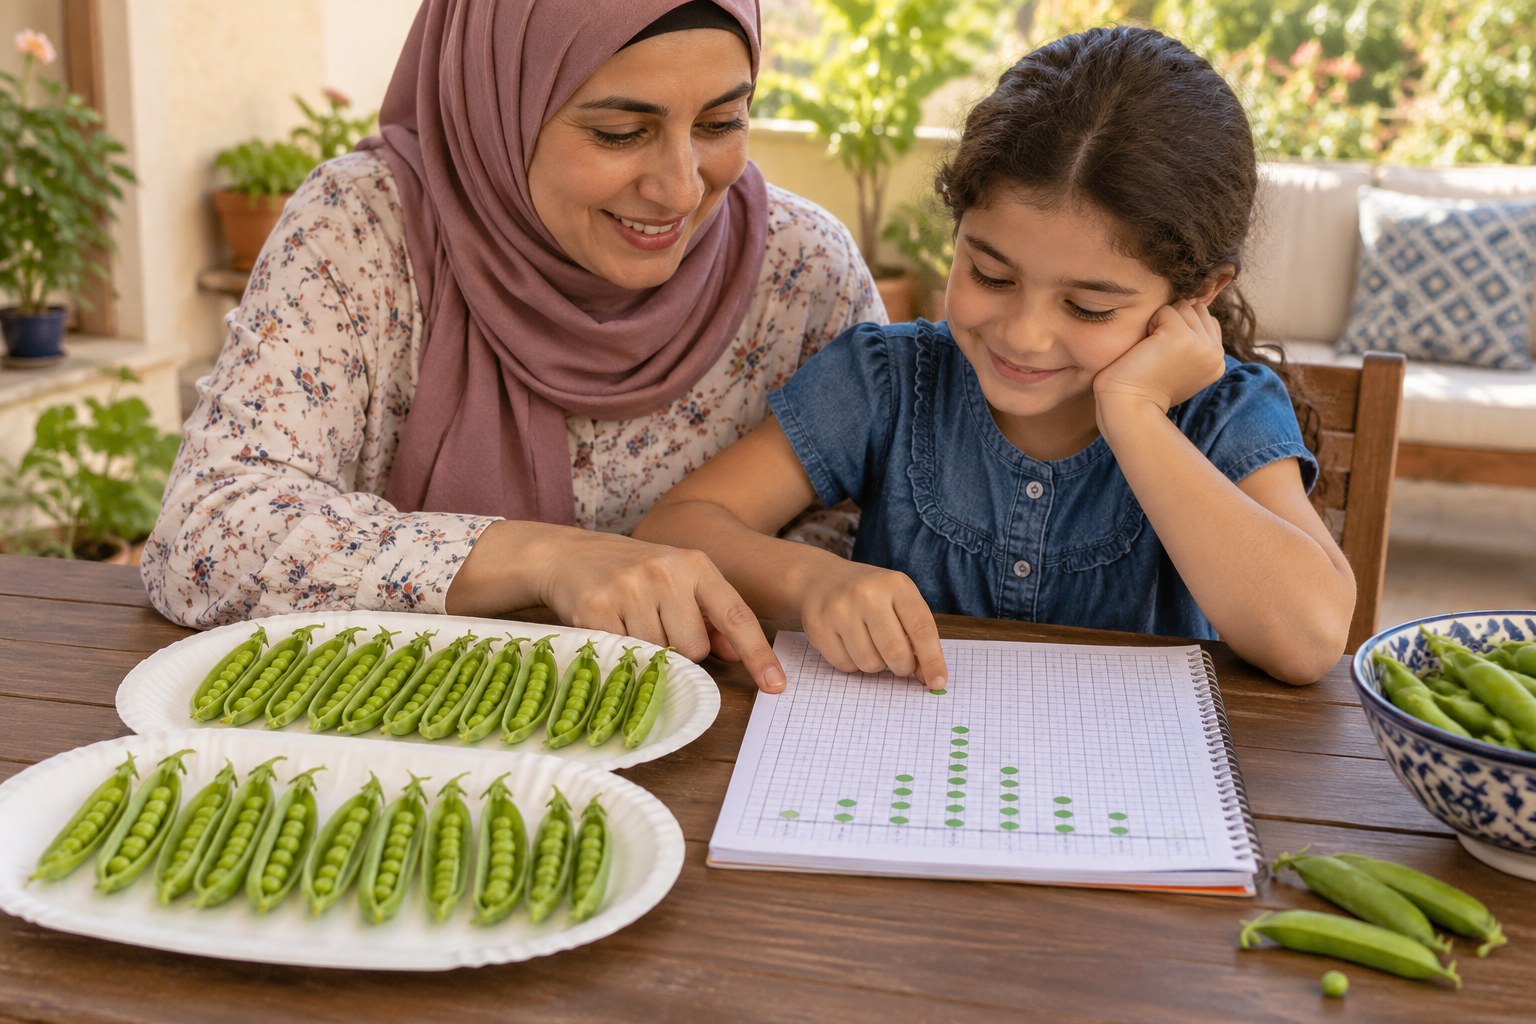
How Many Peas in a Pod? A Garden Dot Plot Investigation
Count peas in 20 pods and make a dot plot.
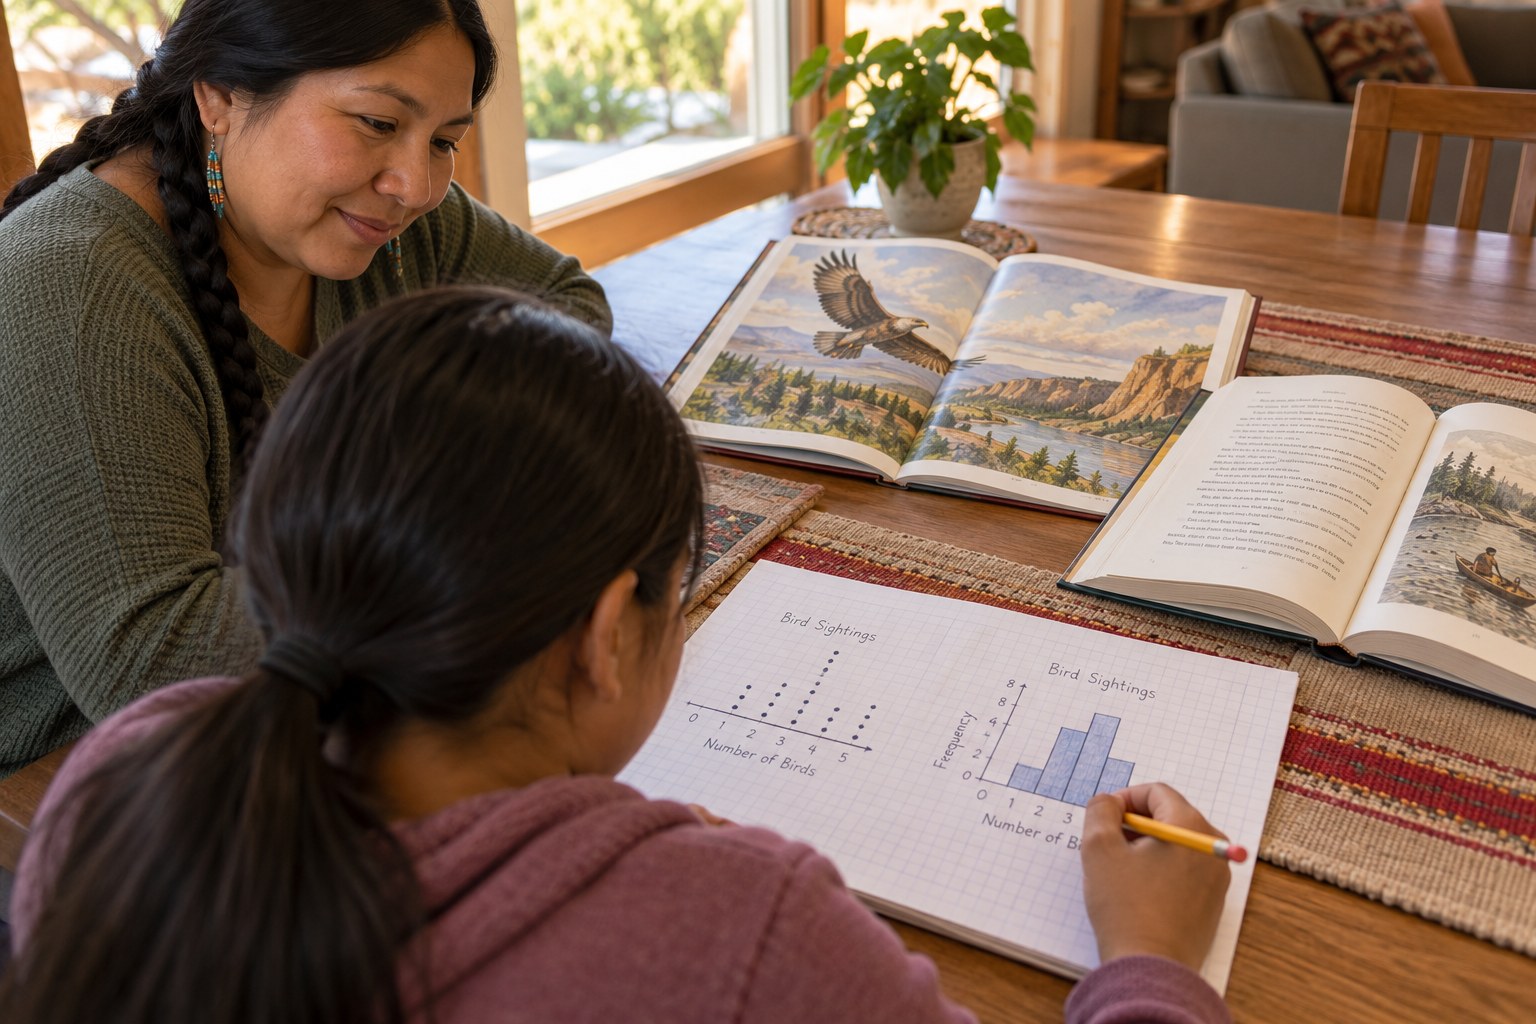
How Long Are the Words? Dot Plots and Histograms from Two Books
Count word lengths in two books and plot the data.
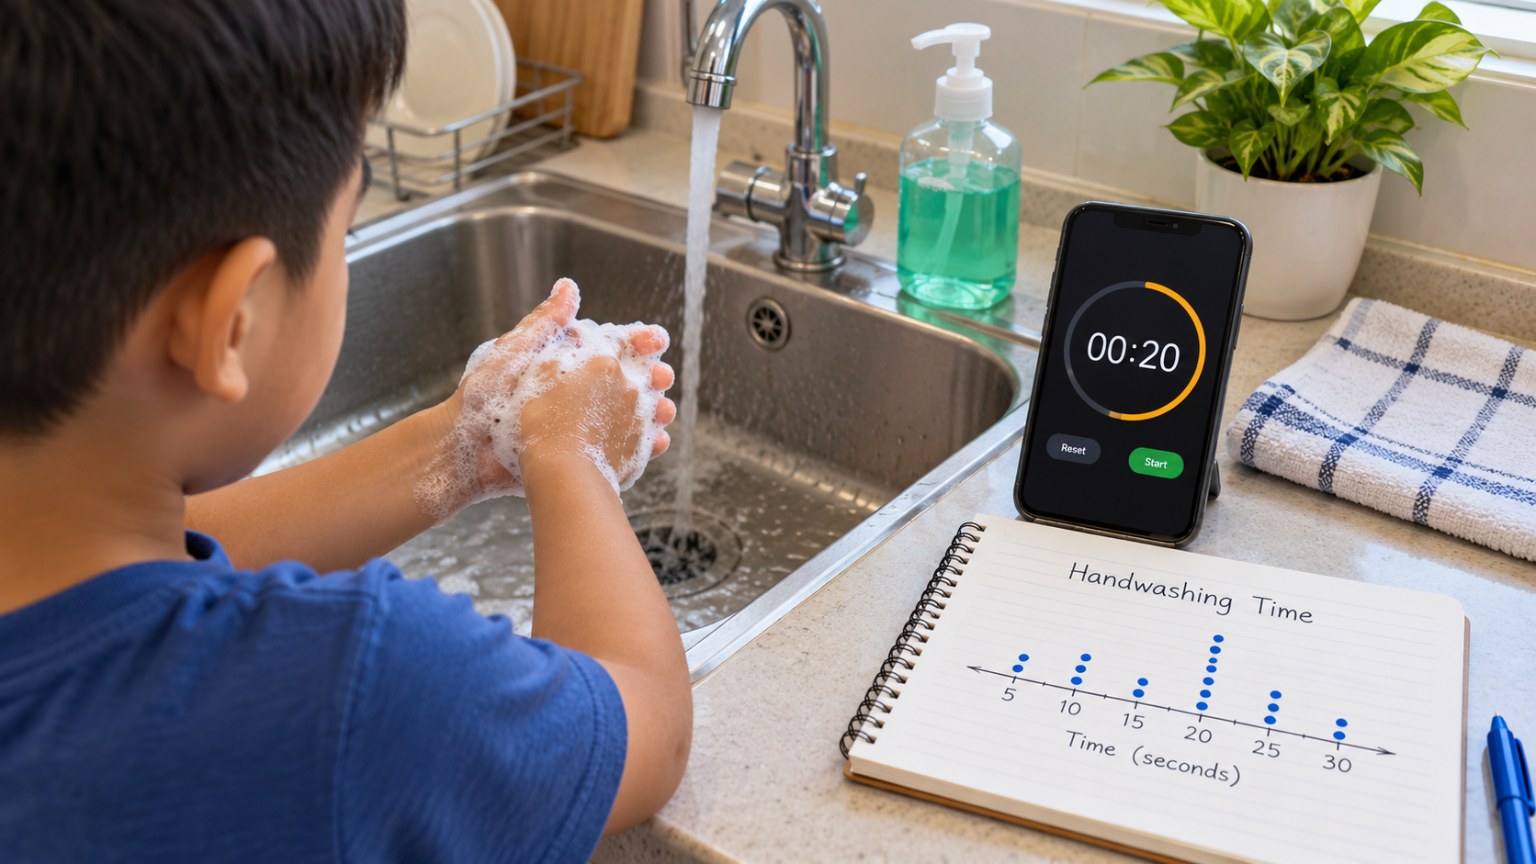
How Long Do We Really Wash? A Family Hand-Washing Data Log
Time family hand-washing and report the data honestly.
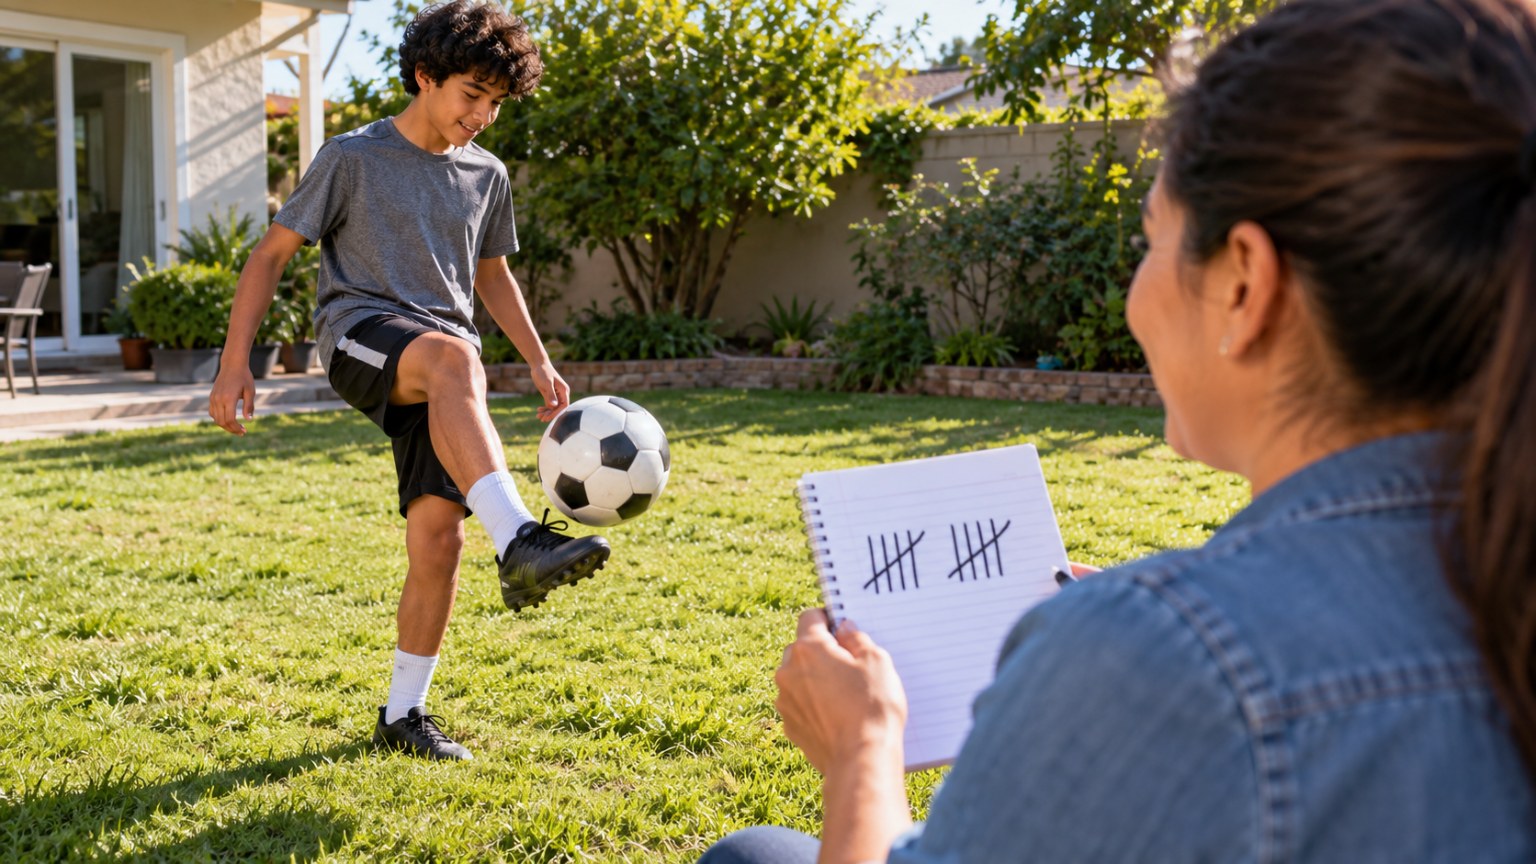
Keepy-Uppy Streaks: How Many Touches Before the Ball Drops?
Juggle a soccer ball and summarize your streaks with stats.
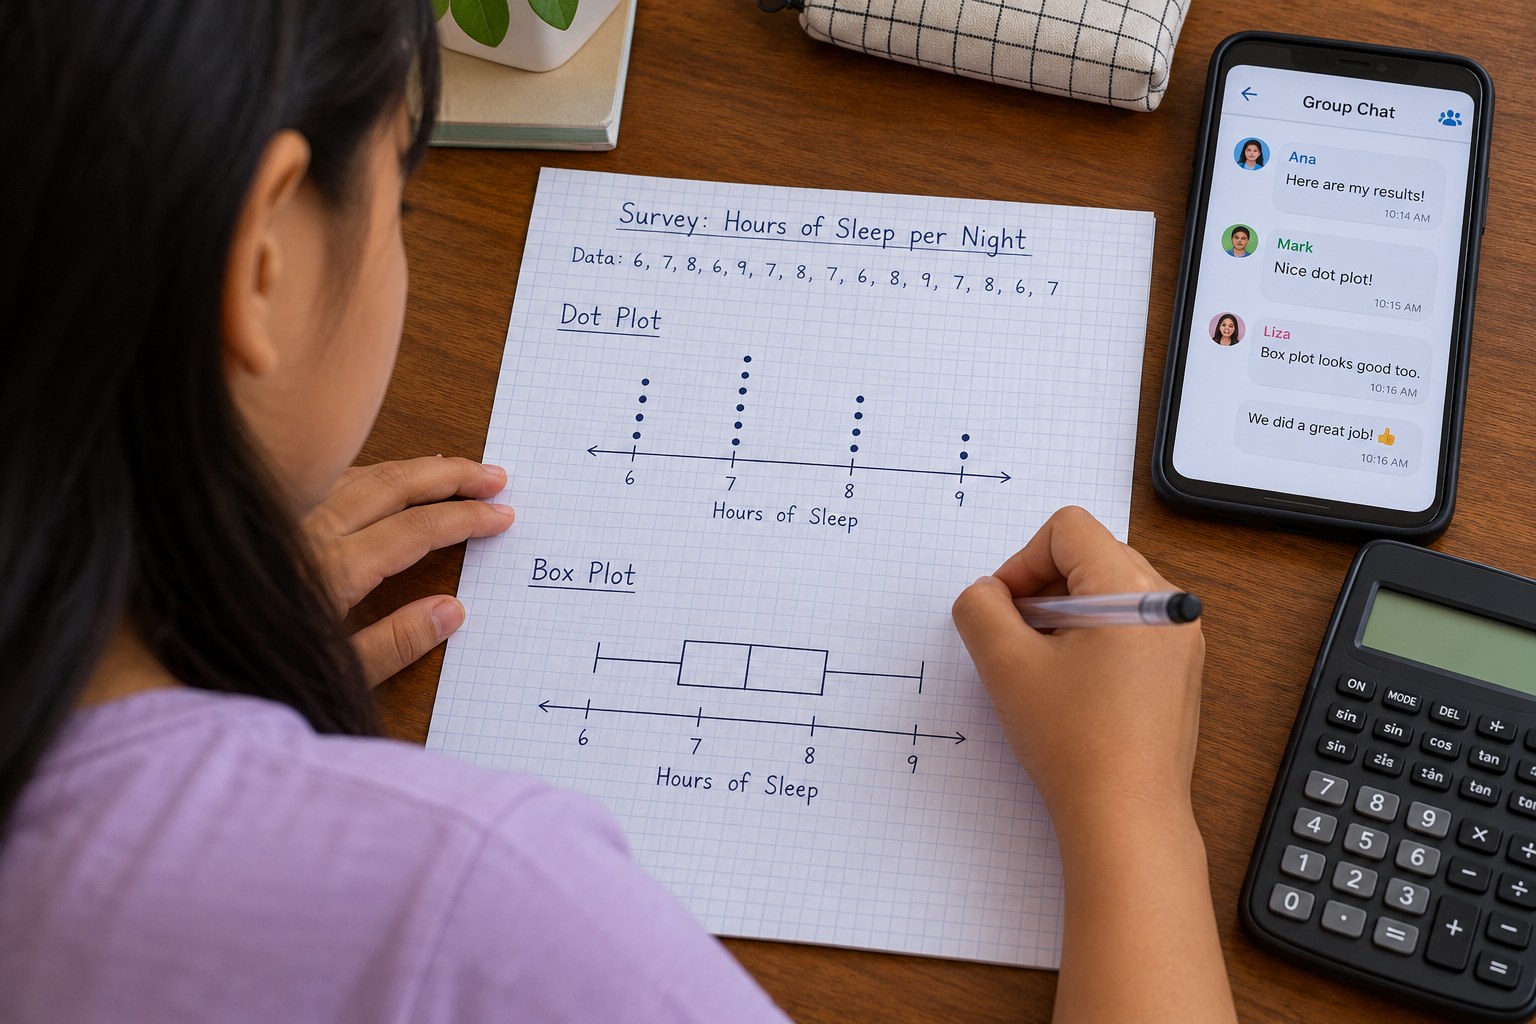
New Year's Resolution Survey: Dot Plots, Median and IQR
Survey people about New Year's resolutions and analyze the data.
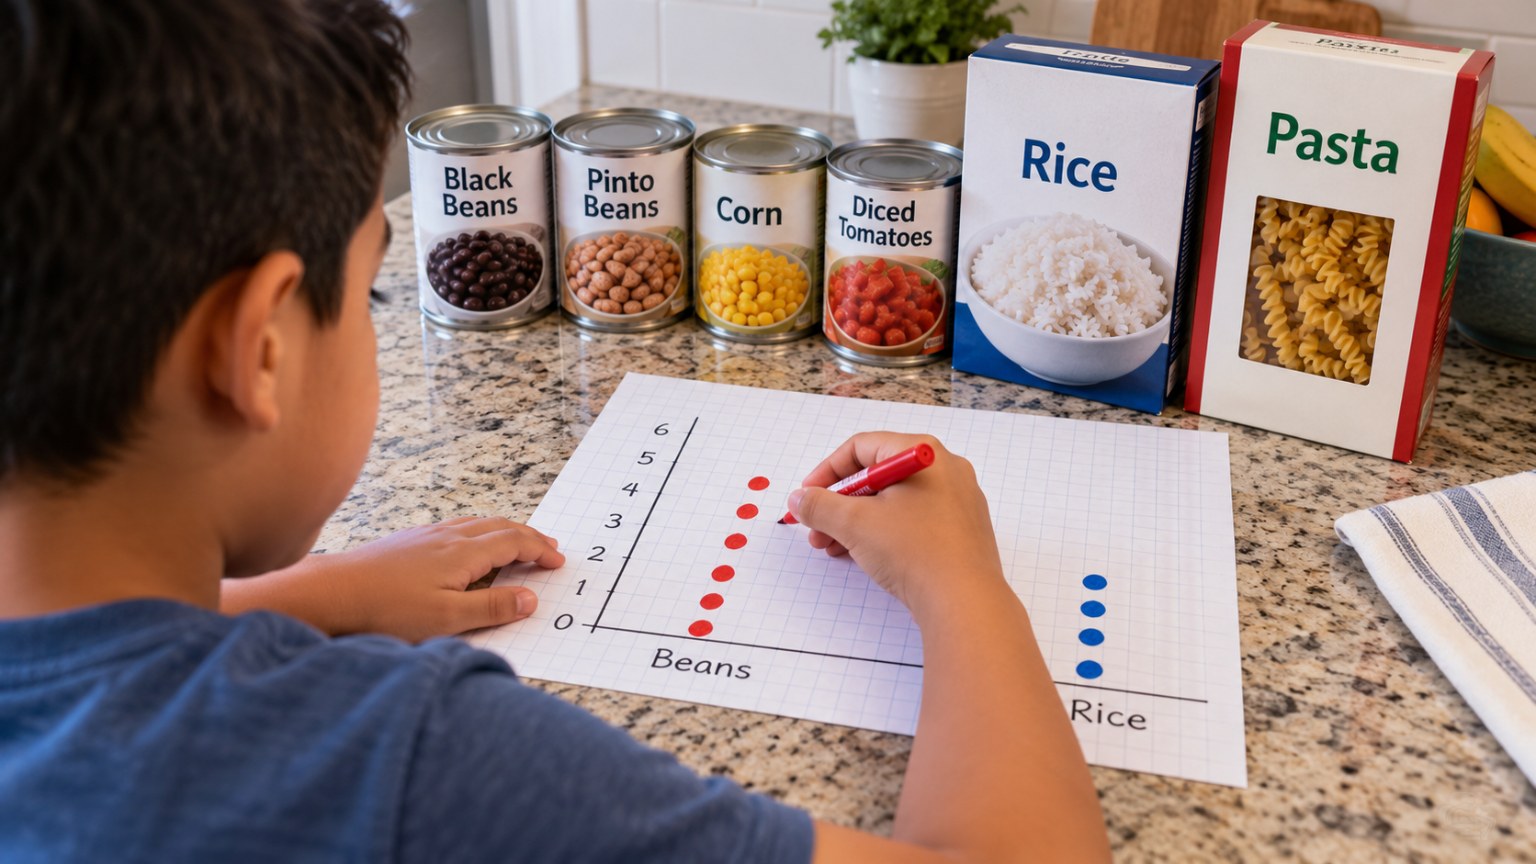
Salt on the Label: A Dot Plot of Sodium Across the Pantry
Plot the sodium %DV of 15 pantry foods.
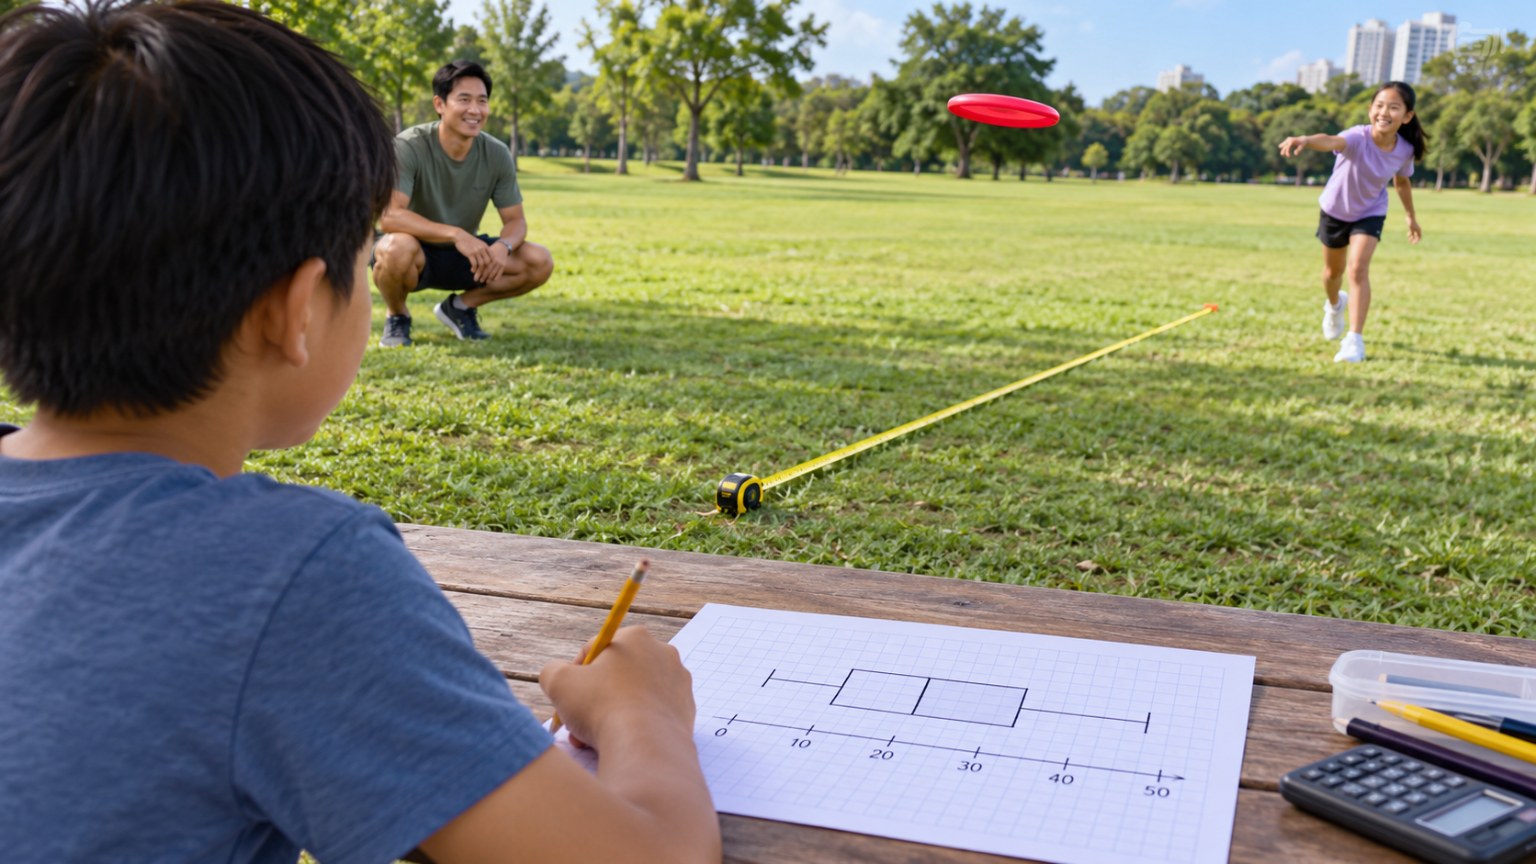
Flying Disc Distance: A Box Plot of 15 Backhand Throws
Throw a disc 15 times and build a box plot.
Related standards with lesson plans: 6.SP.1, 6.SP.2.
See all grade 6 Common Core standards
Make a lesson like this in a minute
Pick a topic, grade, group size and length. Resource Portal AI writes the objectives, materials, steps and pictures.
Sign up FREEFree forever · no credit card needed. Members get all 5,100+ lessons for $14.99/month, with the first 7 days free.