
Lesson plans for 6.SP.2
Math · Grade 6 · Statistics & Probability
Understand that a set of data collected to answer a statistical question has a distribution which can be described by its center, spread, and overall shape.
4 ready-to-teach lesson plans aligned to this standard. Each includes objectives, a materials list, vocabulary and step-by-step activities.
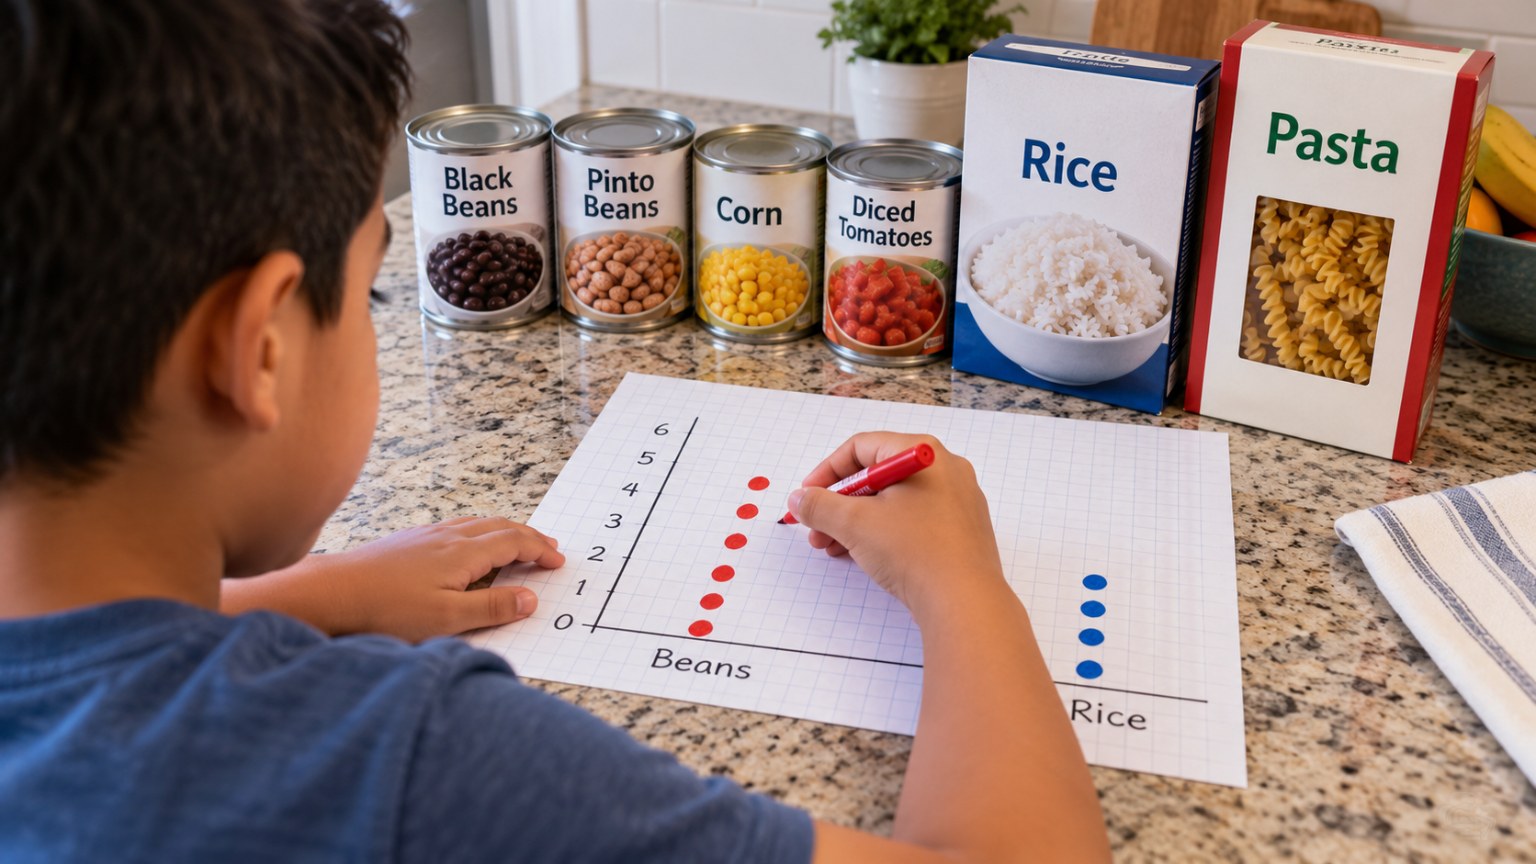
Salt on the Label: A Dot Plot of Sodium Across the Pantry
Plot the sodium %DV of 15 pantry foods.
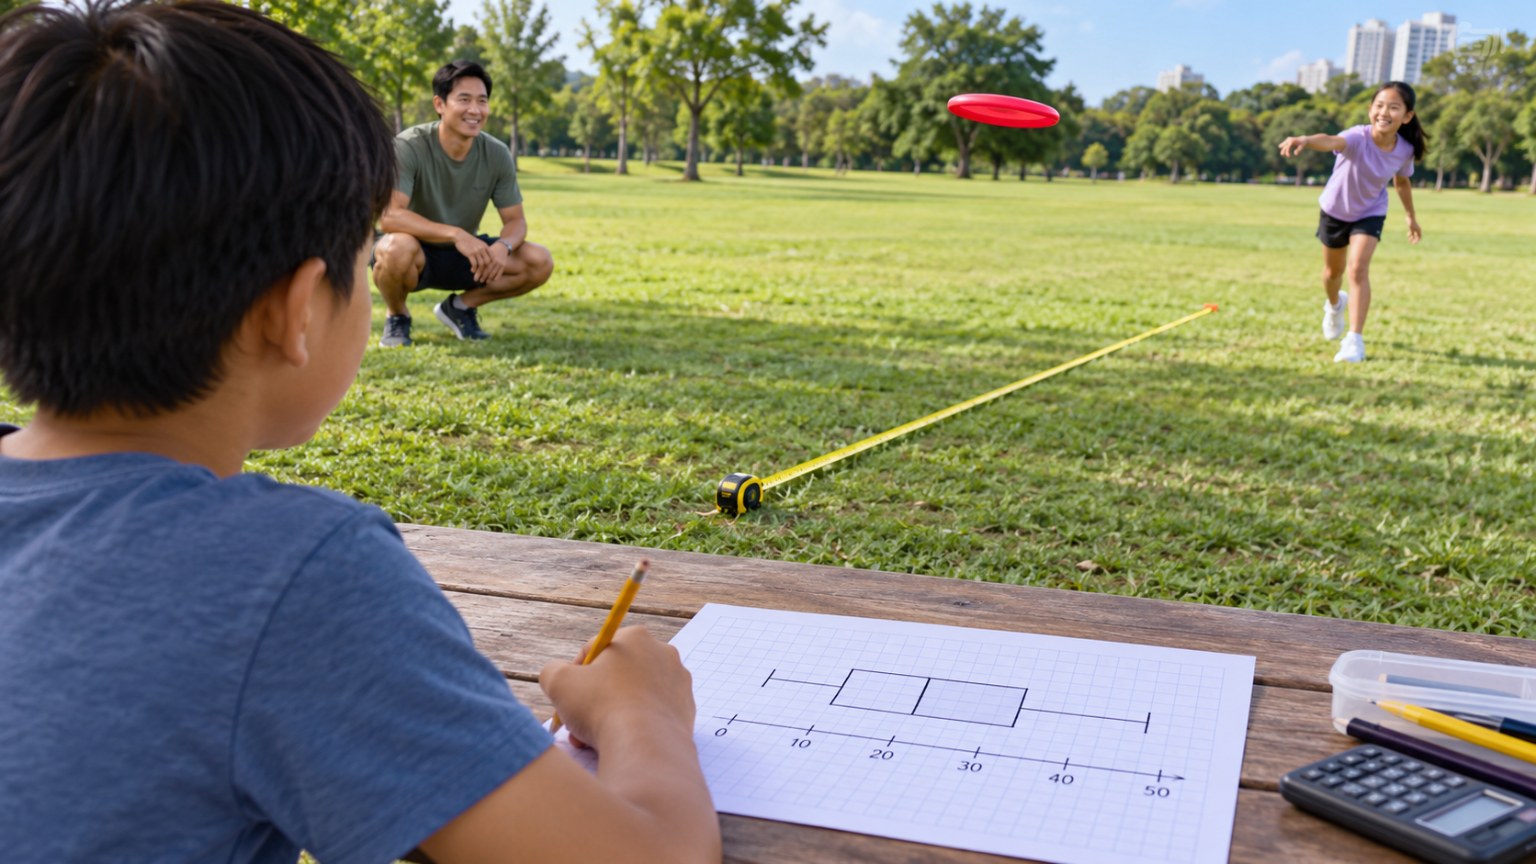
Flying Disc Distance: A Box Plot of 15 Backhand Throws
Throw a disc 15 times and build a box plot.
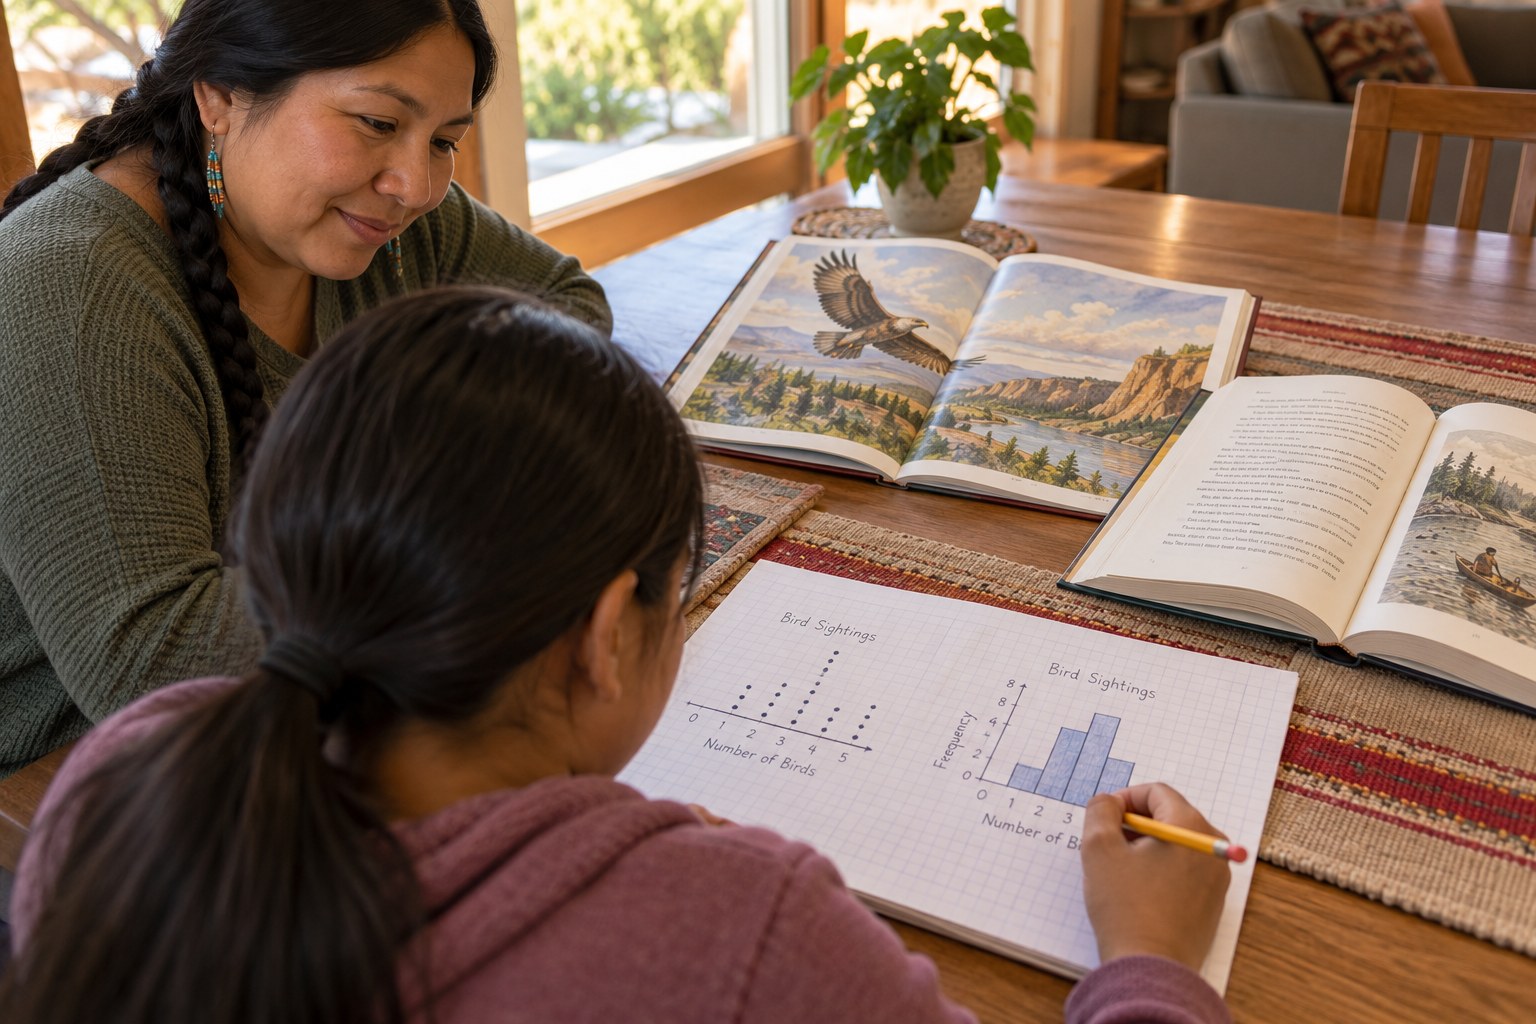
How Long Are the Words? Dot Plots and Histograms from Two Books
Count word lengths in two books and plot the data.
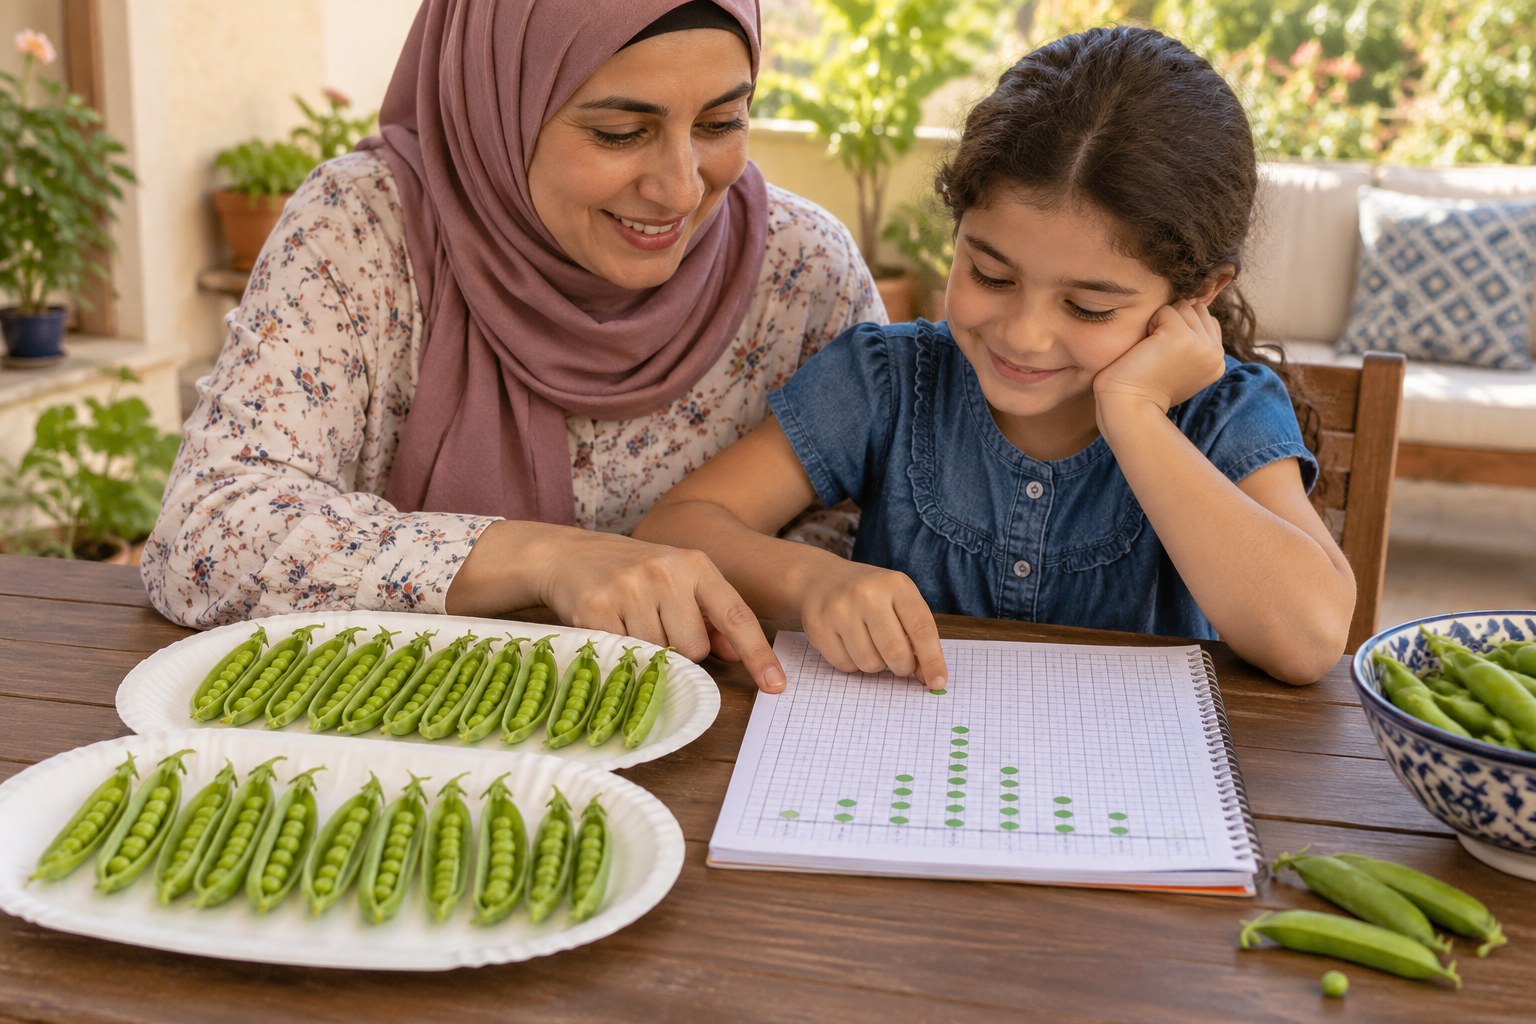
How Many Peas in a Pod? A Garden Dot Plot Investigation
Count peas in 20 pods and make a dot plot.
See all grade 6 standards with lesson plans
Make a lesson like this in a minute
Pick a topic, grade, group size and length. Resource Portal AI writes the objectives, materials, steps and pictures.
Sign up FREEFree forever · no credit card needed. Members get all 5,100+ lessons for $14.99/month, with the first 7 days free.