
Lesson plans for 3.MD.3
Math · Grade 3 · Measurement & Data
Draw a scaled picture graph and a scaled bar graph to represent a data set with several categories. Solve one- and two-step "how many more" and "how many less" problems using information presented in scaled bar graphs.
13 ready-to-teach lesson plans aligned to this standard. Each includes objectives, a materials list, vocabulary and step-by-step activities.
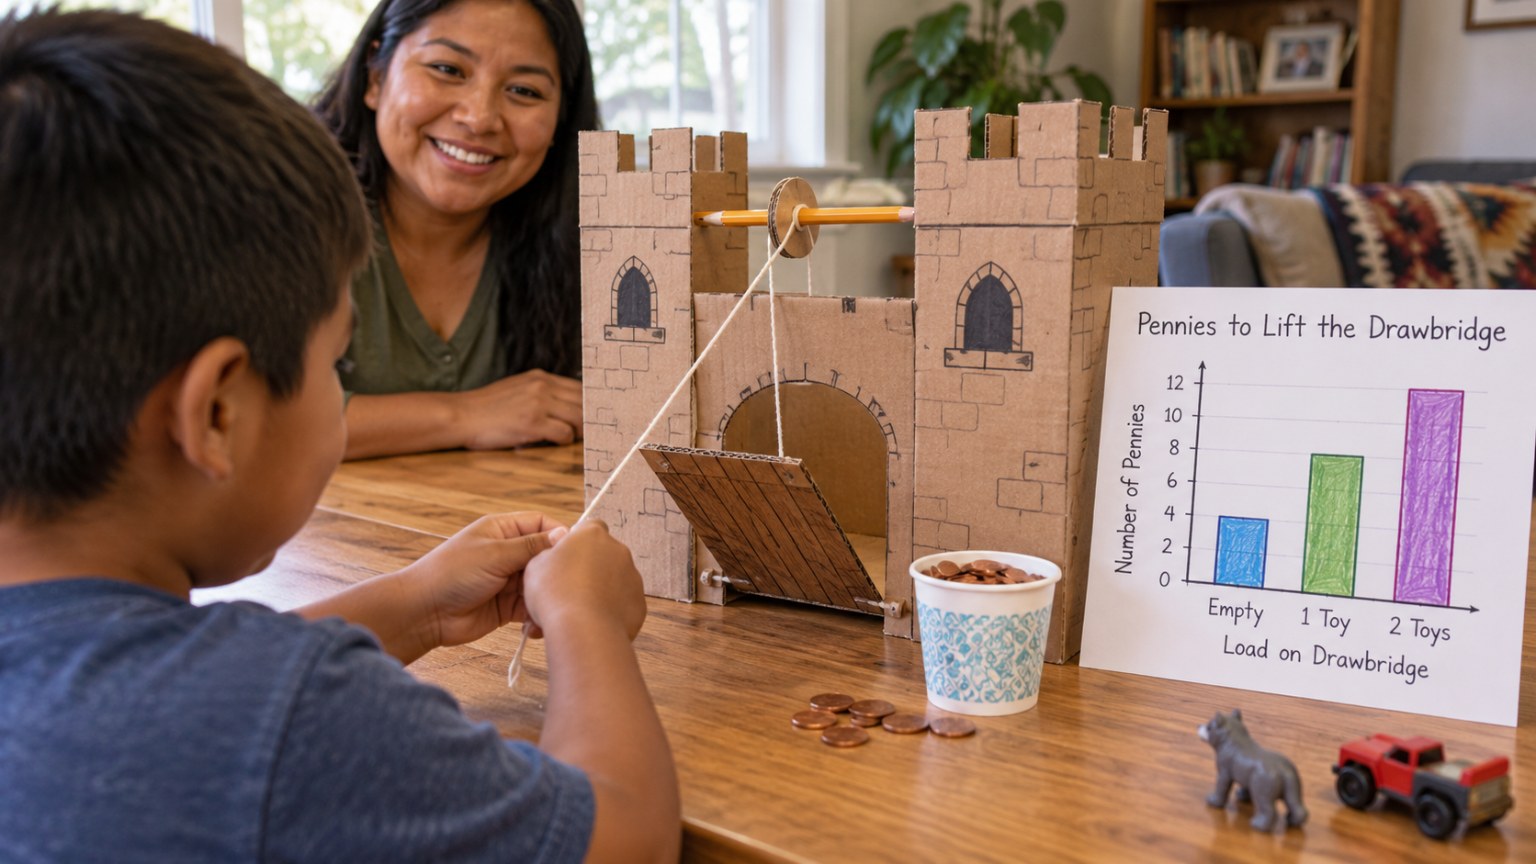
Drawbridge Lift Lab: Where Should the Chain Attach?
Test how the height of the chain changes the force to lift a drawbridge.
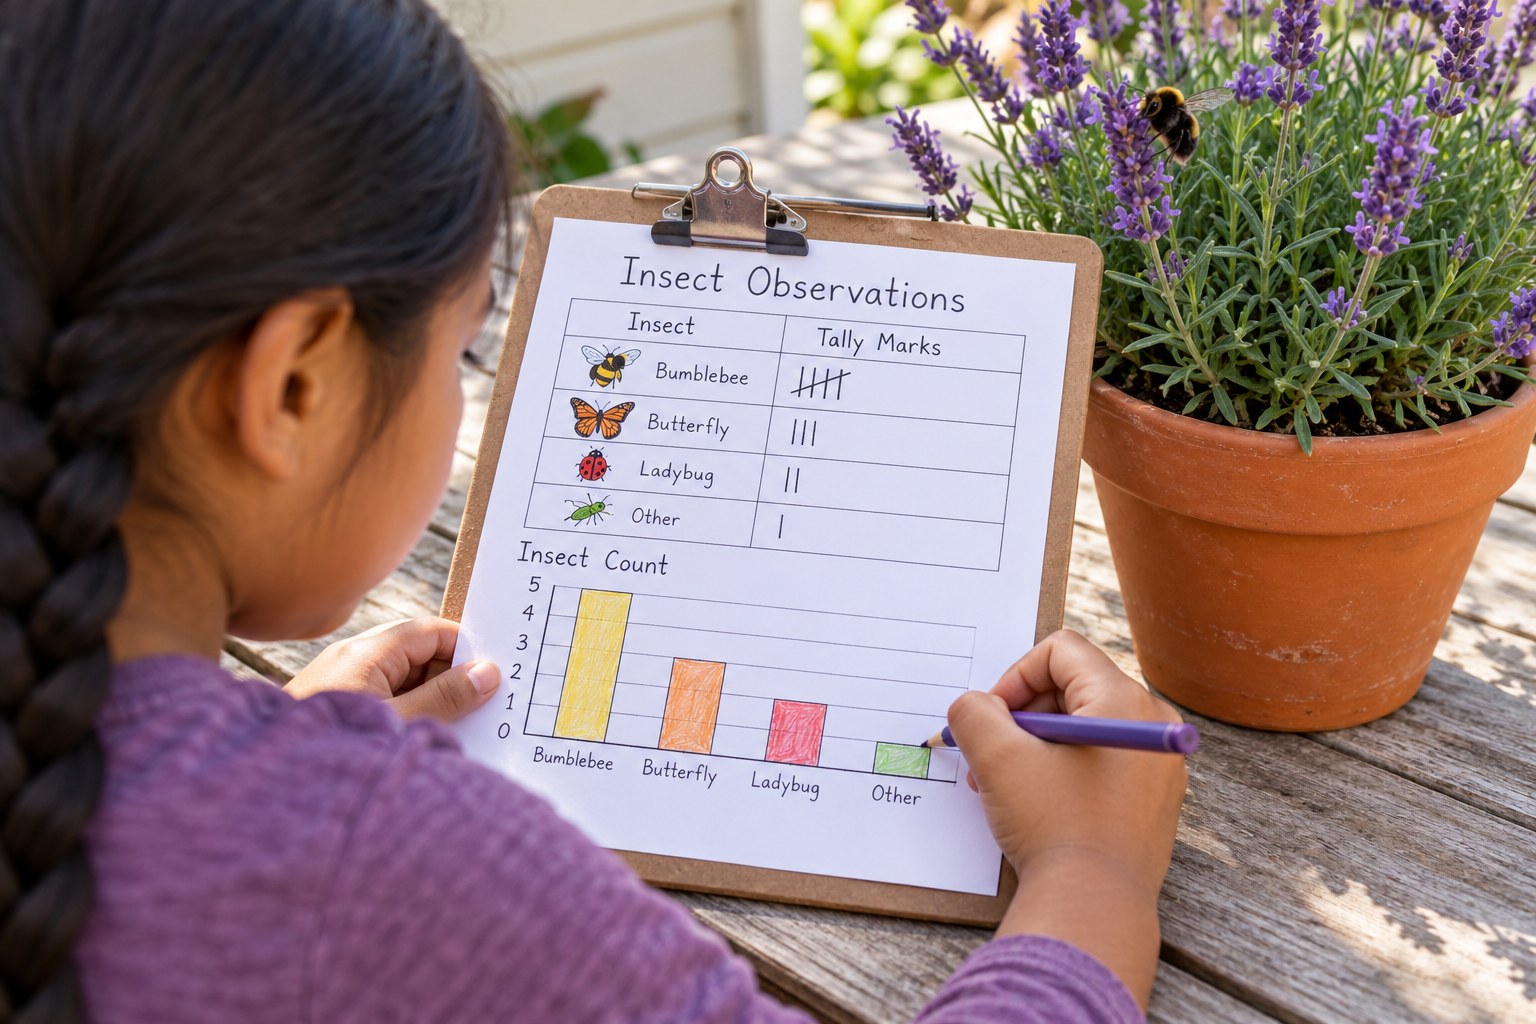
Gardening Pollinator Patrol: Count Flower Visitors and Make a Scaled Bar Graph
Tally pollinators on a flower and graph them with a scale.
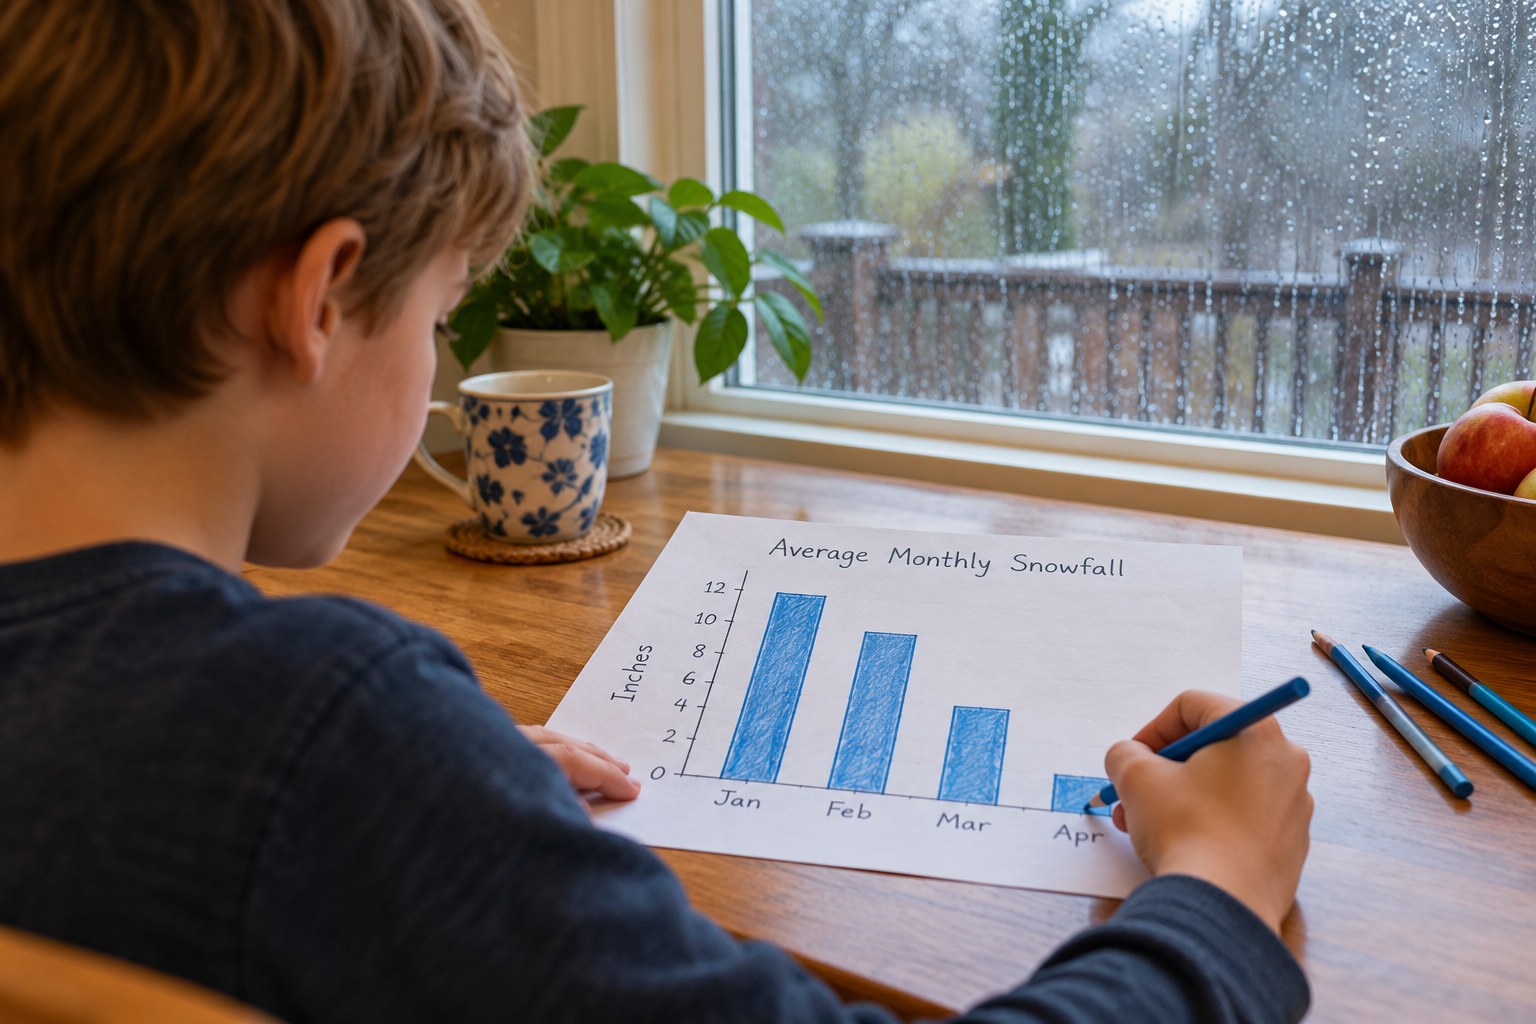
Winter Is the Rainy Season: Graph a Year of Valley Rain
Build a scaled bar graph that shows why winter is the wet season.
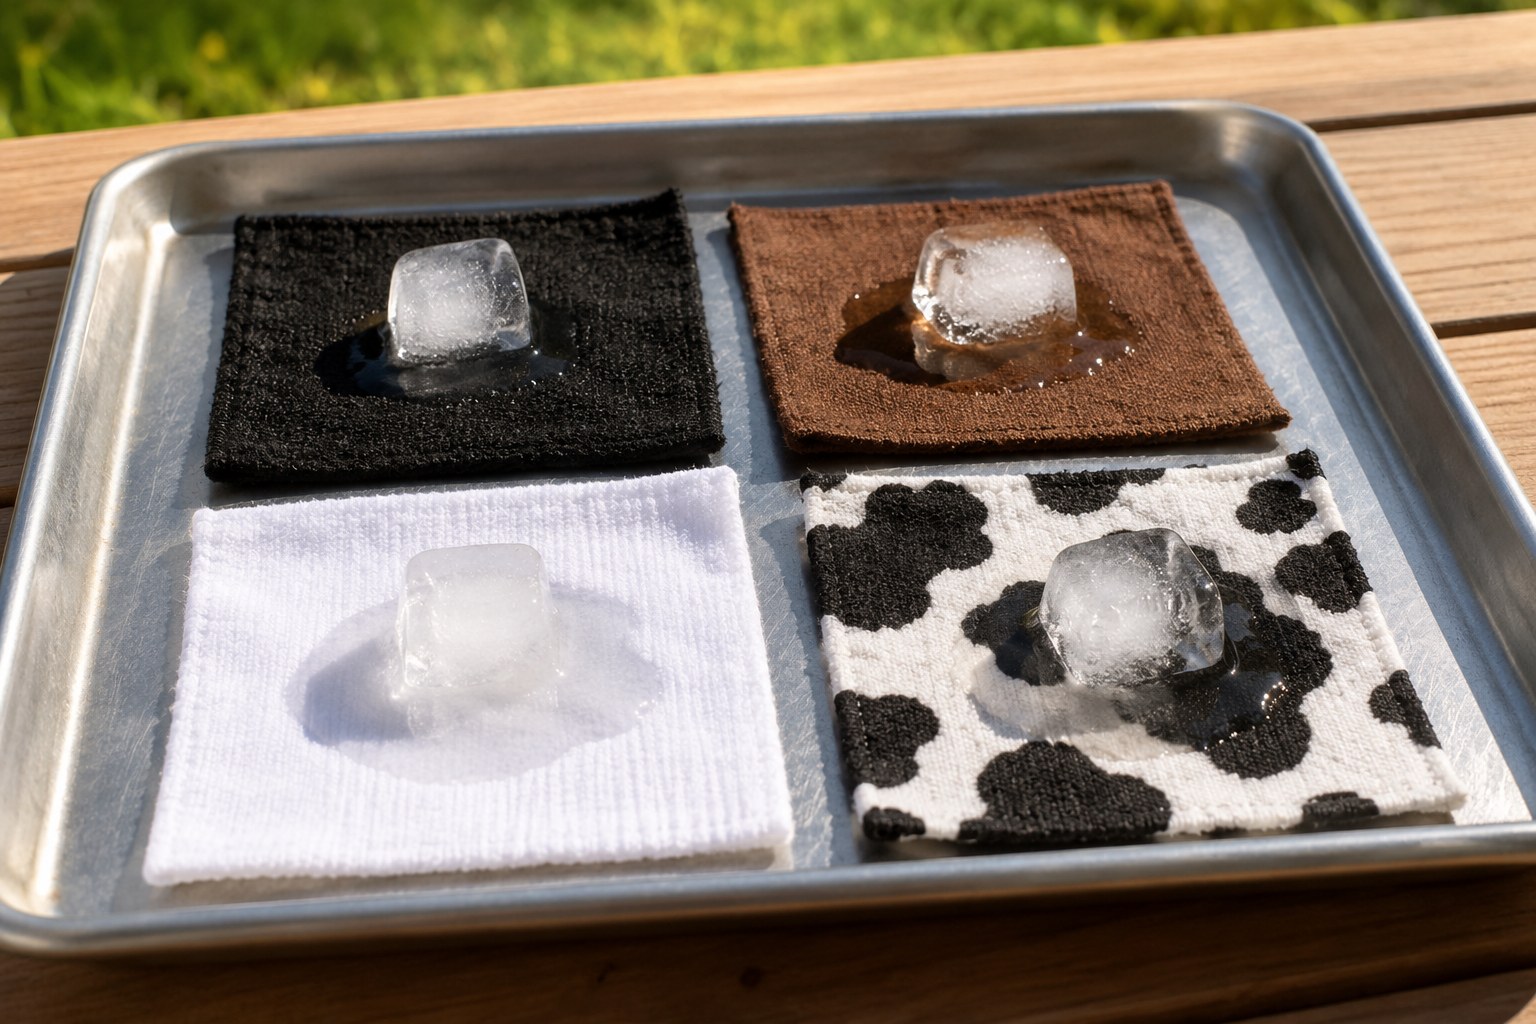
Hot Cows: Do Dark or Light Coats Heat Up Faster?
Ice-cube test: which cow coat color soaks up the most sun?
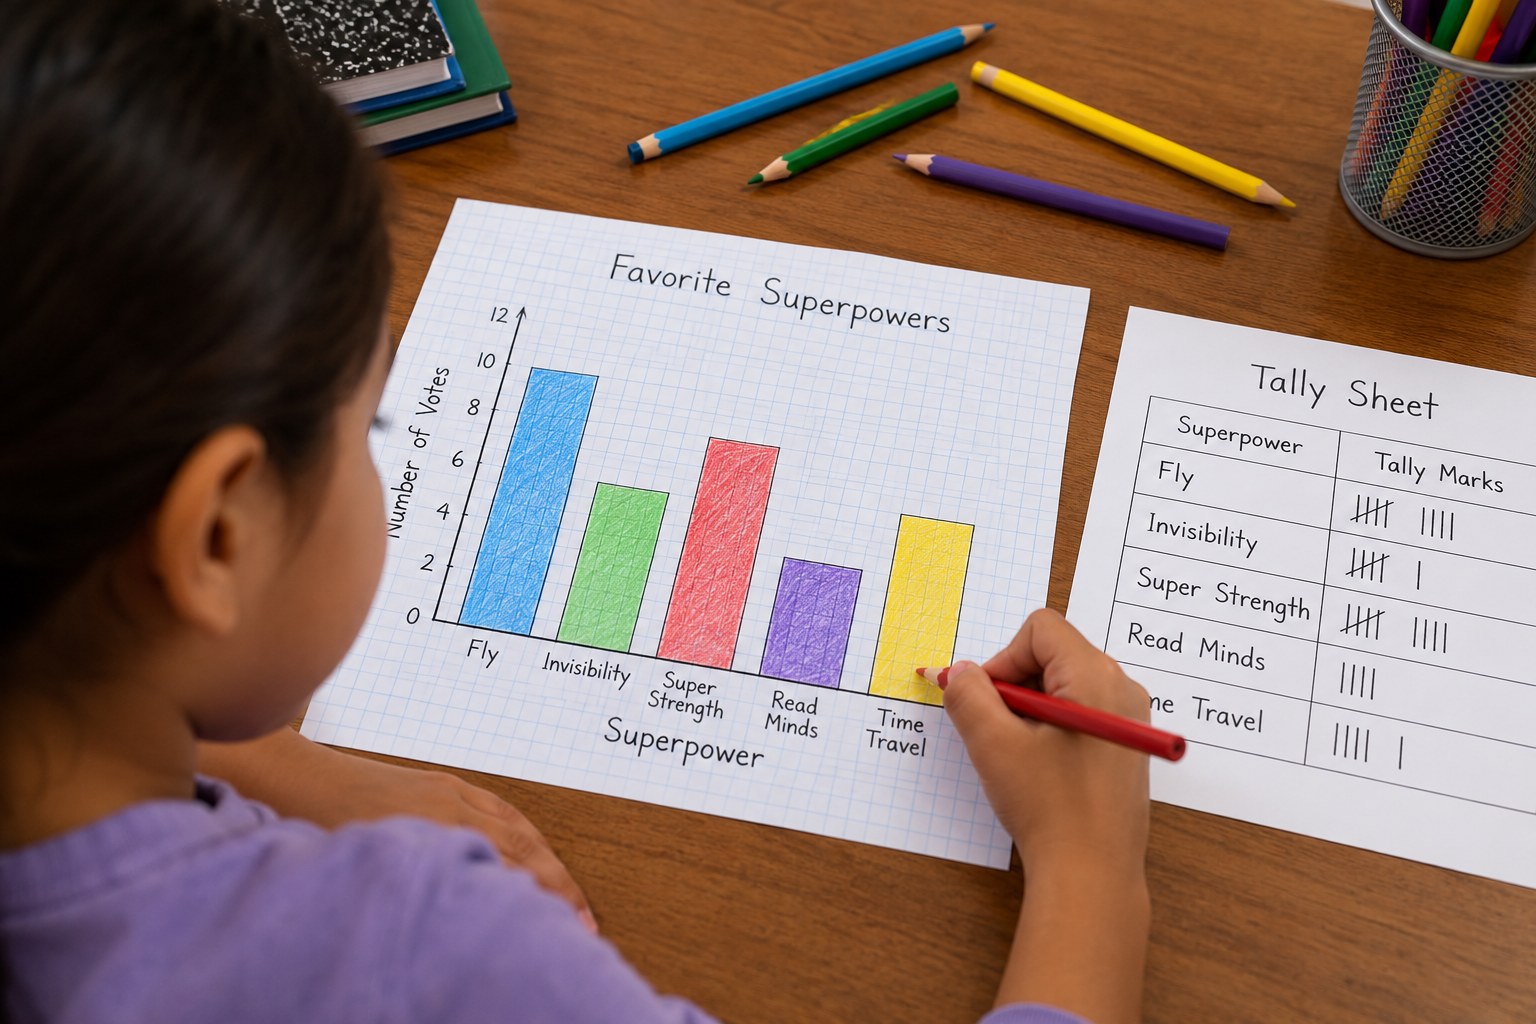
Superpower Survey: Collect Data and Draw a Scaled Bar Graph
Survey friends on favorite superpowers and graph the results.
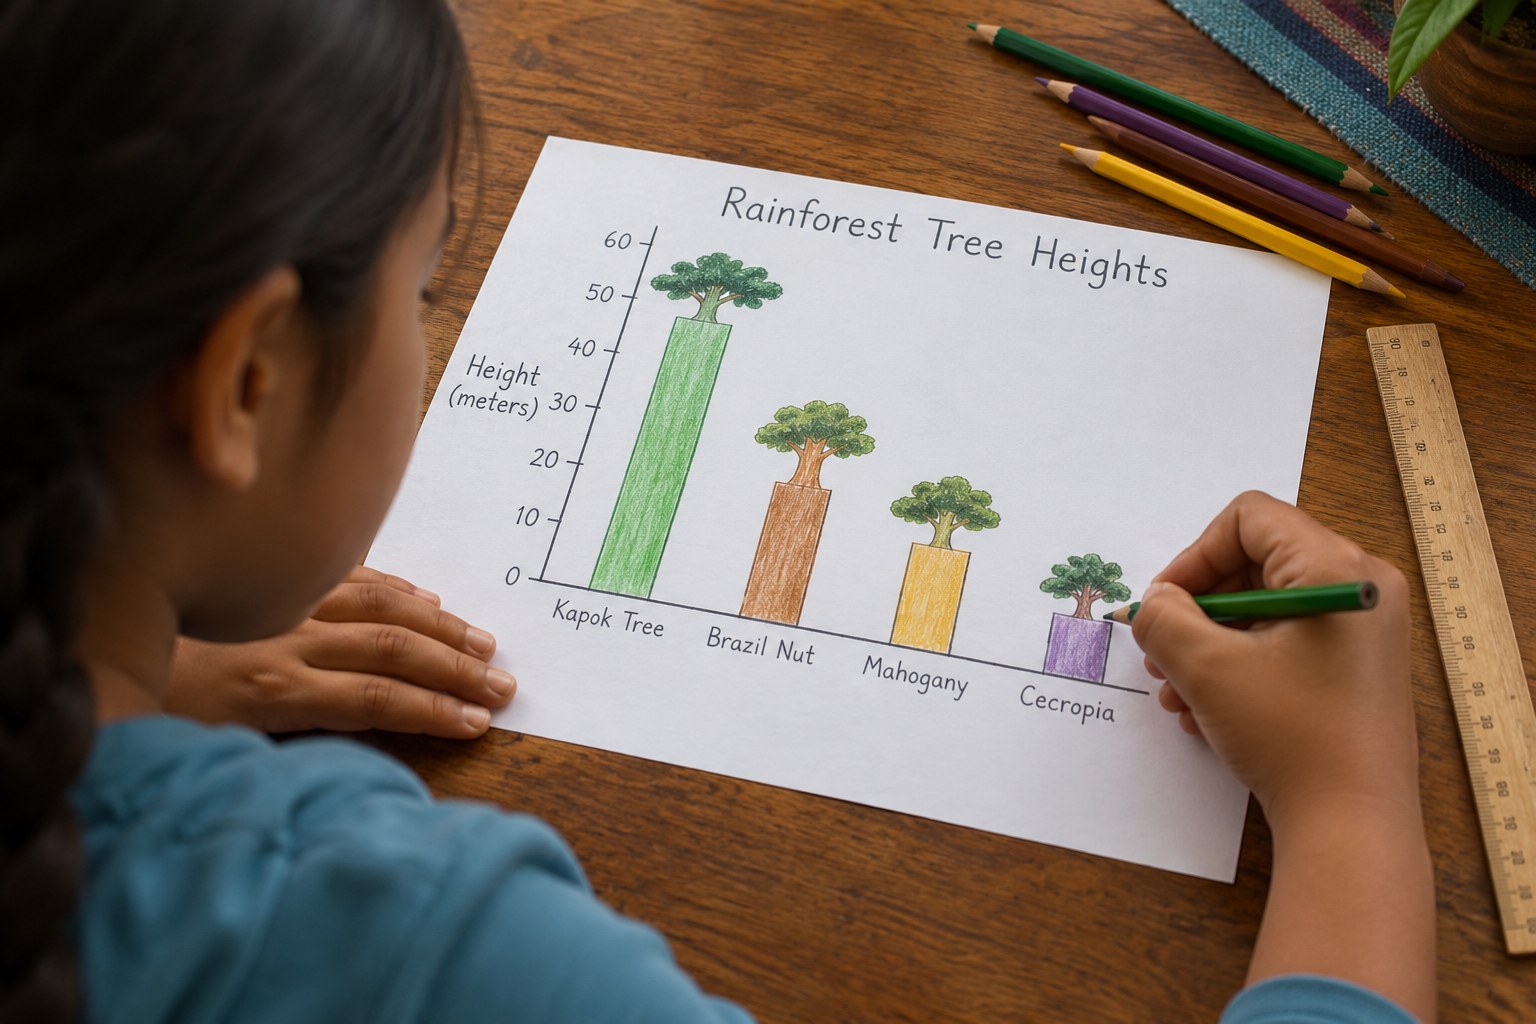
Rainforest Tree Heights Scaled Bar Graph
Graph rainforest tree heights with a scale of 25 feet.
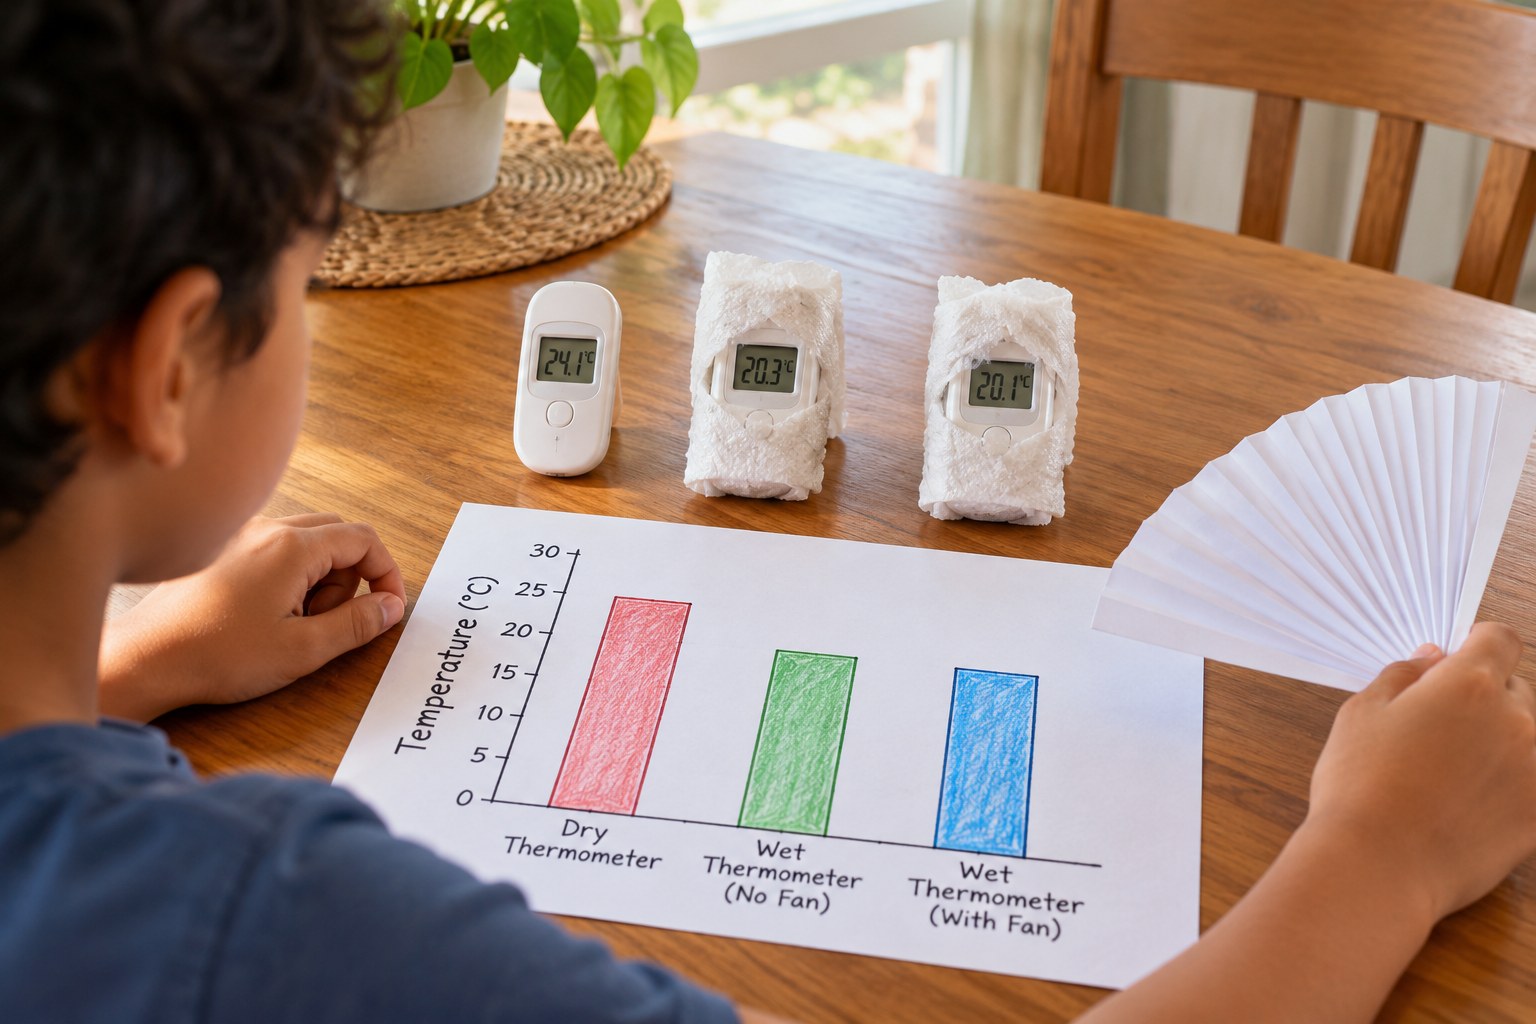
Summer Cool-Down Lab: Graph How a Wet Cloth Cools a Thermometer
Find out how sweat cools you with three thermometers and a fan.

Winter Bird Café: Milk-Carton Feeder and Bird Count
Build a carton bird feeder and graph your winter bird visitors.
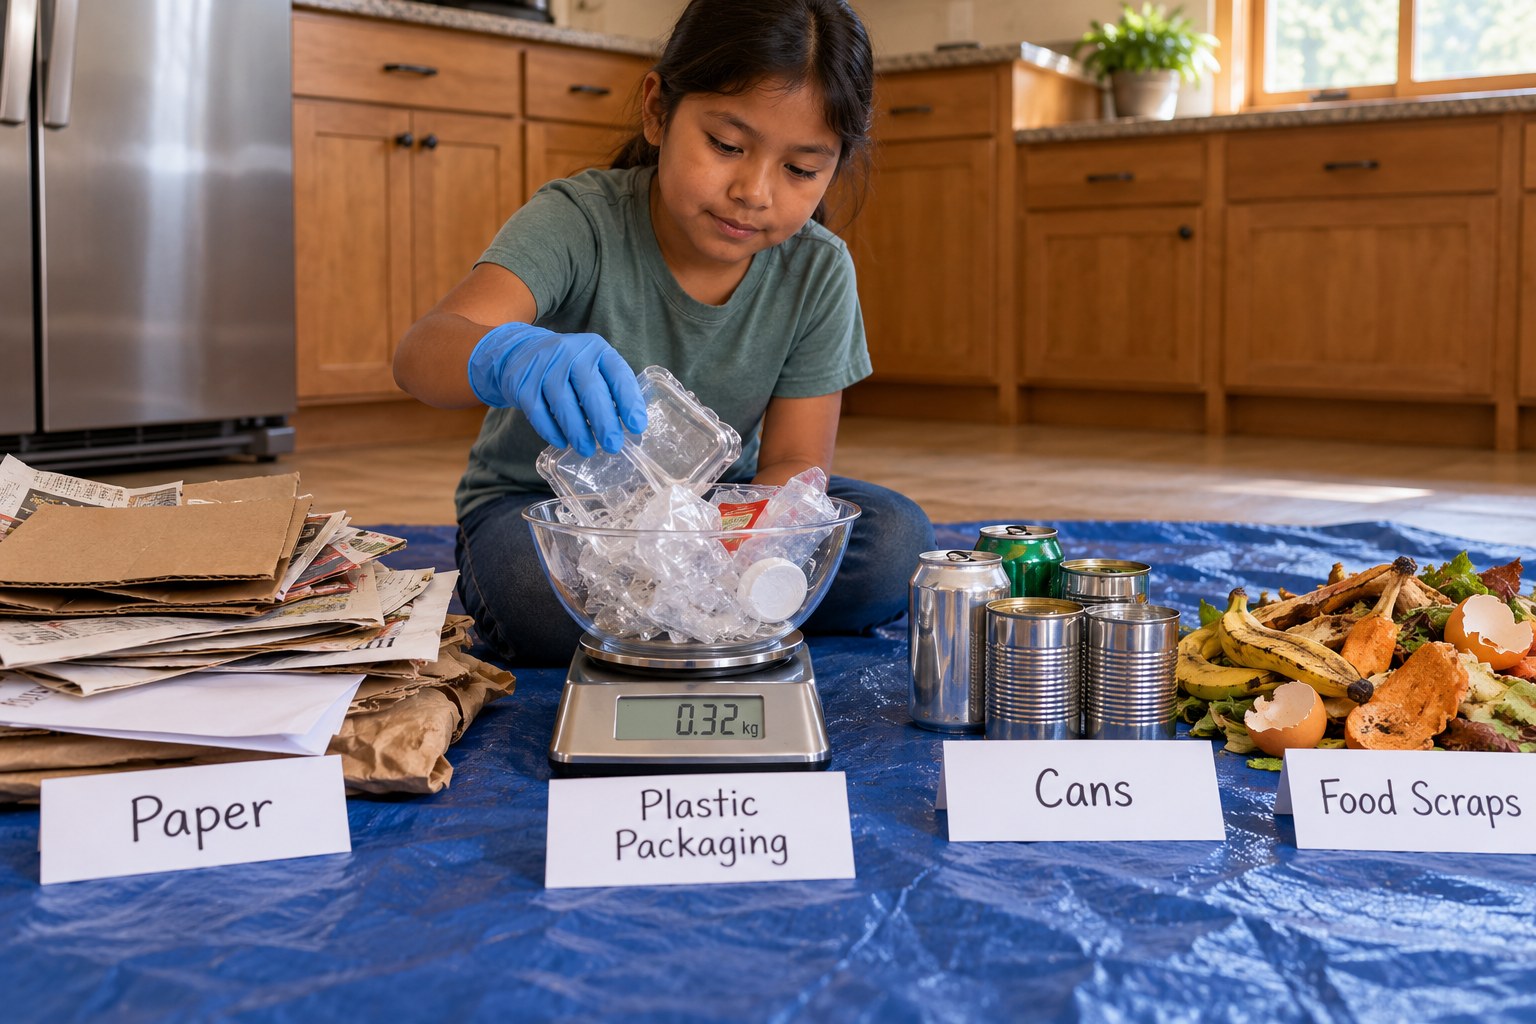
Earth Day Trash Audit: Weigh and Graph a Day of Waste
Weigh a day of family trash and graph it.
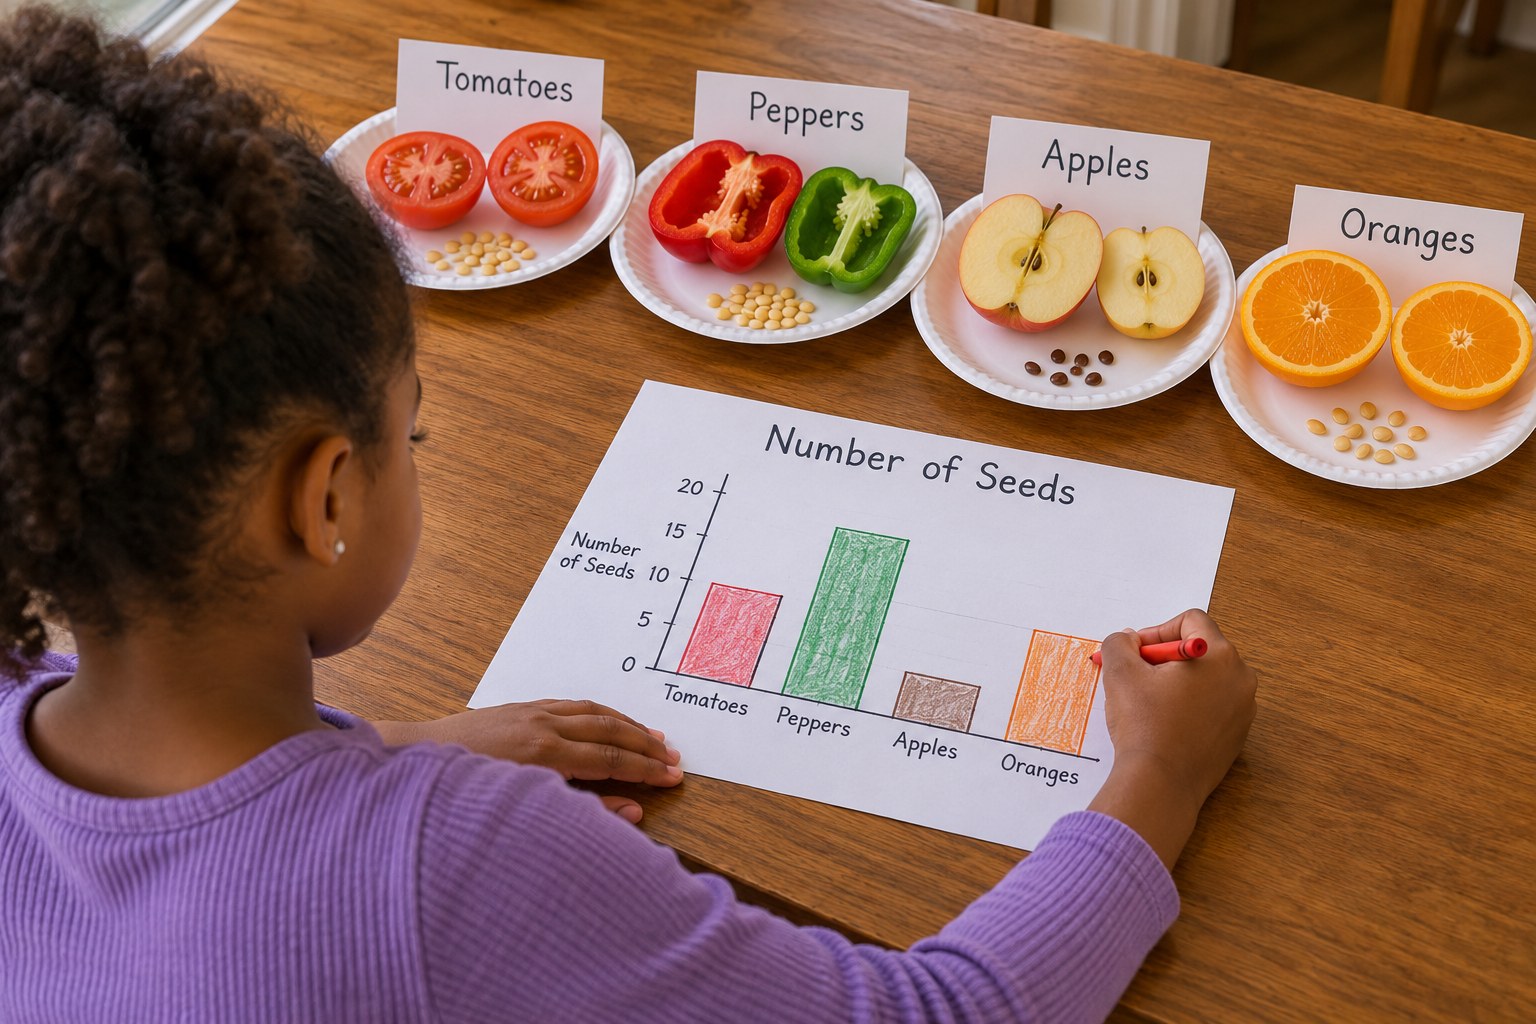
Kwanzaa Mazao Seed Count and Bar Graph
Count the seeds in harvest foods and graph the results.
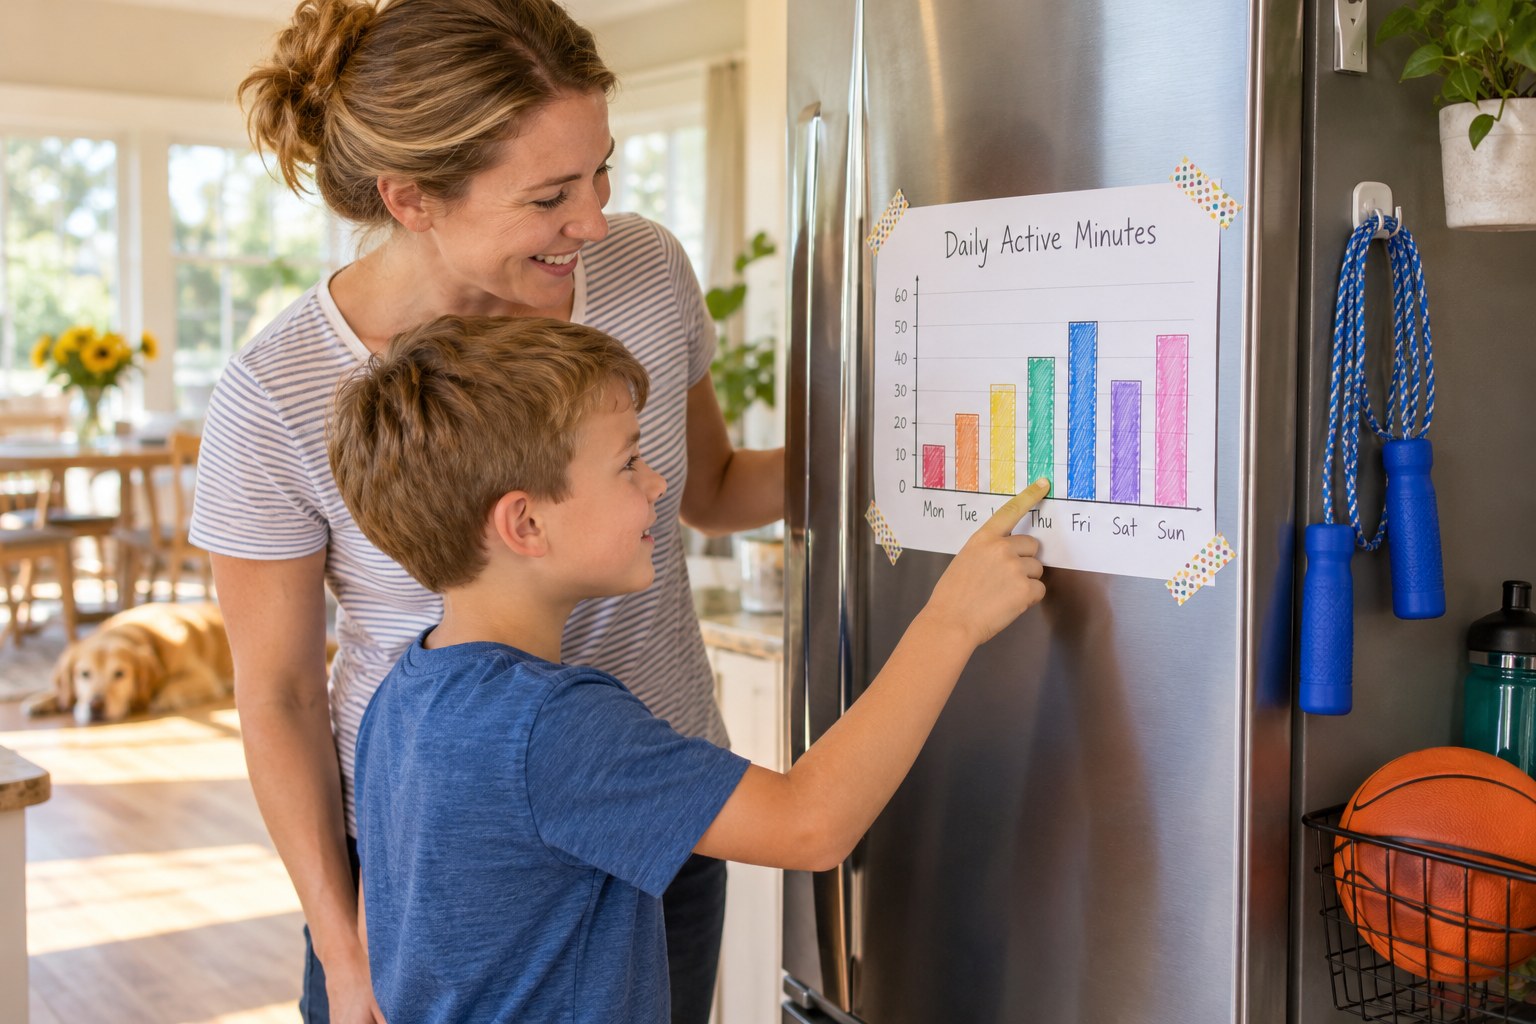
Our Week of Moving: Scaled Bar Graph of Active Minutes
Graph a week of active play with a scale of 10.

Laundry Basket Free Throws: Graph the Scores
Shoot sock balls, then graph the scores to scale.
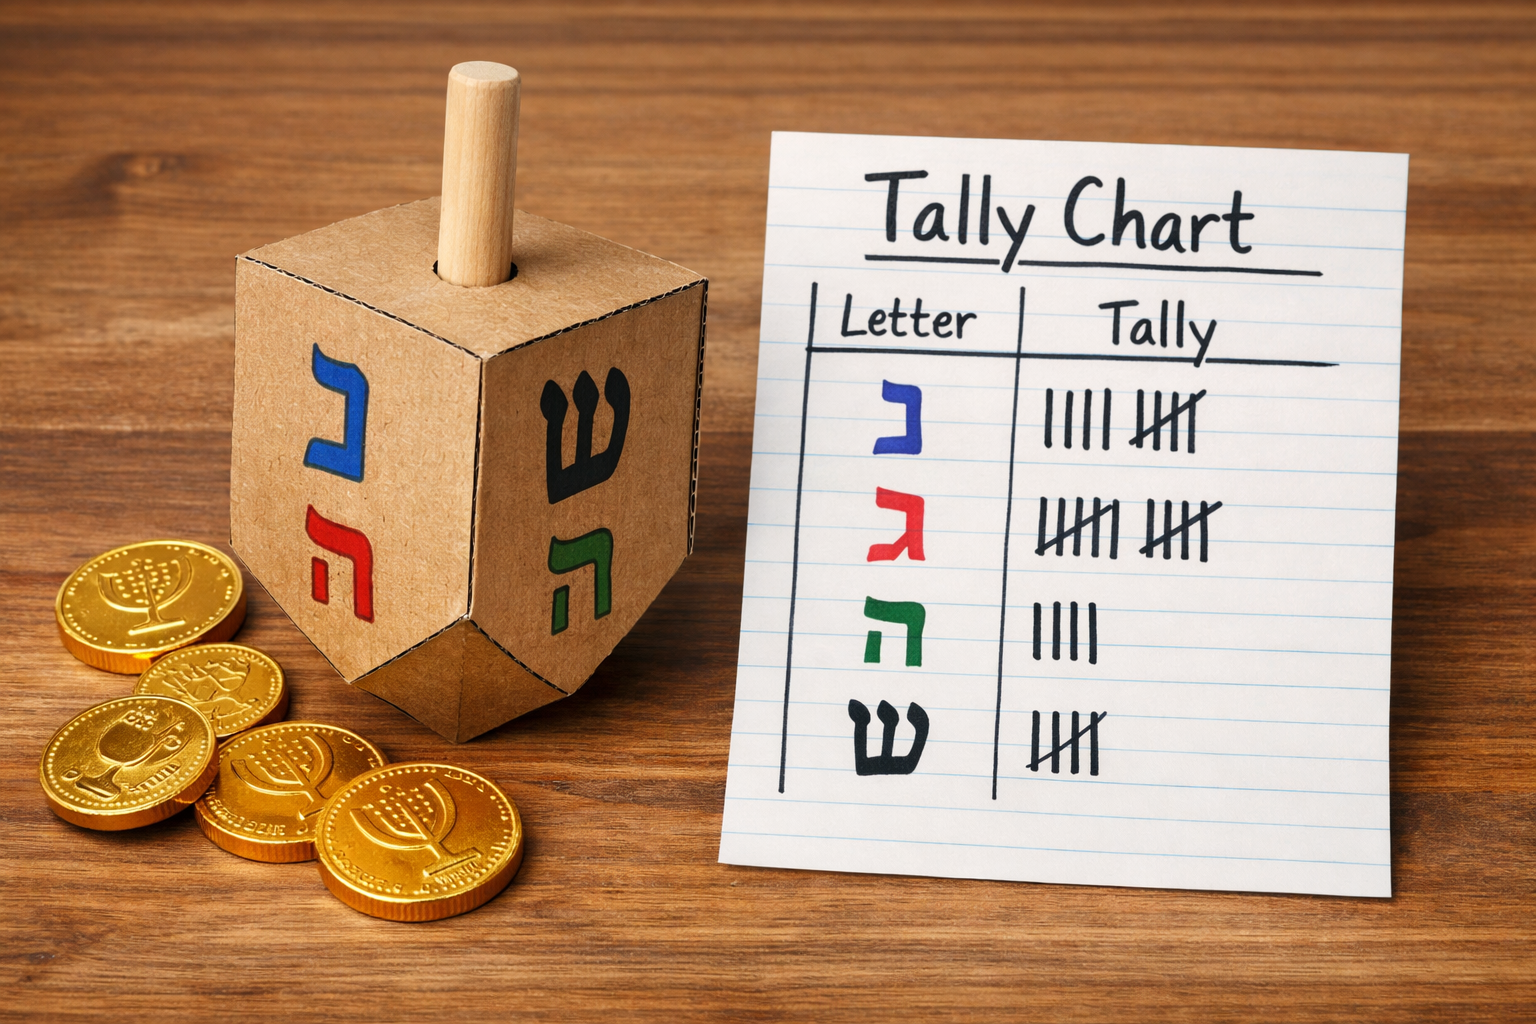
Hanukkah Dreidel Probability Game
Spin a homemade dreidel and graph the results.
See all grade 3 standards with lesson plans
Make a lesson like this in a minute
Pick a topic, grade, group size and length. Resource Portal AI writes the objectives, materials, steps and pictures.
Sign up FREEFree forever · no credit card needed. Members get all 5,100+ lessons for $14.99/month, with the first 7 days free.