Full lesson previewWinter Is the Rainy Season: Graph a Year of Valley Rain
Math40 minutesGrades: 3rd, 4th
Overview
Build a scaled bar graph that shows why winter is the wet season.
Description
Your child discovers that in much of California, winter is the wet season. Using rounded monthly rainfall averages for Fresno, they build a scaled bar graph where each square stands for 5 millimeters of rain, then answer how-many-more and how-many-less questions.
Objective
Your child will draw a scaled bar graph of monthly rainfall and solve one-step and two-step how-many-more and how-many-less problems using the graph.
Standards
3.MD.3Math · Grade 3 · Measurement & Data Draw a scaled picture graph and a scaled bar graph to represent a data set with several categories. Solve one- and two-step "how many more" and "how many less" problems using information presented in scaled bar graphs.
Materials
| Item | Quantity |
|---|
| Graph paper or a printed grid | 1 sheet per child |
| Pencil and ruler | 1 each per child |
| Crayons or colored pencils in 4 colors | 1 set |
| Clear cup or jar (optional, for a rain gauge) | 1 |
| The rainfall data table in this lesson | 1 copy |
Vocabulary
Rainy season
The part of the year when a place gets most of its rain; in California it is late fall through early spring.
Millimeter (mm)
A very small unit of length; 25 millimeters is about 1 inch.
Scale
What each square or step on a graph stands for, such as 5 millimeters.
Bar graph
A graph that uses bars of different lengths to compare amounts.
Preparation
- Copy the rainfall table from the additional sections onto a sheet of paper or the board.
- On the graph paper, draw the two axes: months along the bottom (12 spaces) and rainfall up the side.
Introduction
Ask your child: what season do you think gets the most rain where we live? Then ask: and the least? Write both guesses down before looking at any numbers.
When do you remember wearing a rain jacket the most?
Why might farmers care about how much rain falls in winter?
Steps
1Step 1
Read the data
(6 min) Read the rainfall table together and find the wettest and driest months. Point out that summer months have almost no rain, while December, January and February are some of the wettest.
2Step 2
Set the scale
(6 min) Explain that each square on the graph will stand for 5 millimeters of rain, so January's 55 mm will be 11 squares tall. Your child labels the side of the graph 0, 5, 10, 15 and so on up to 60.
3Step 3
Draw the bars
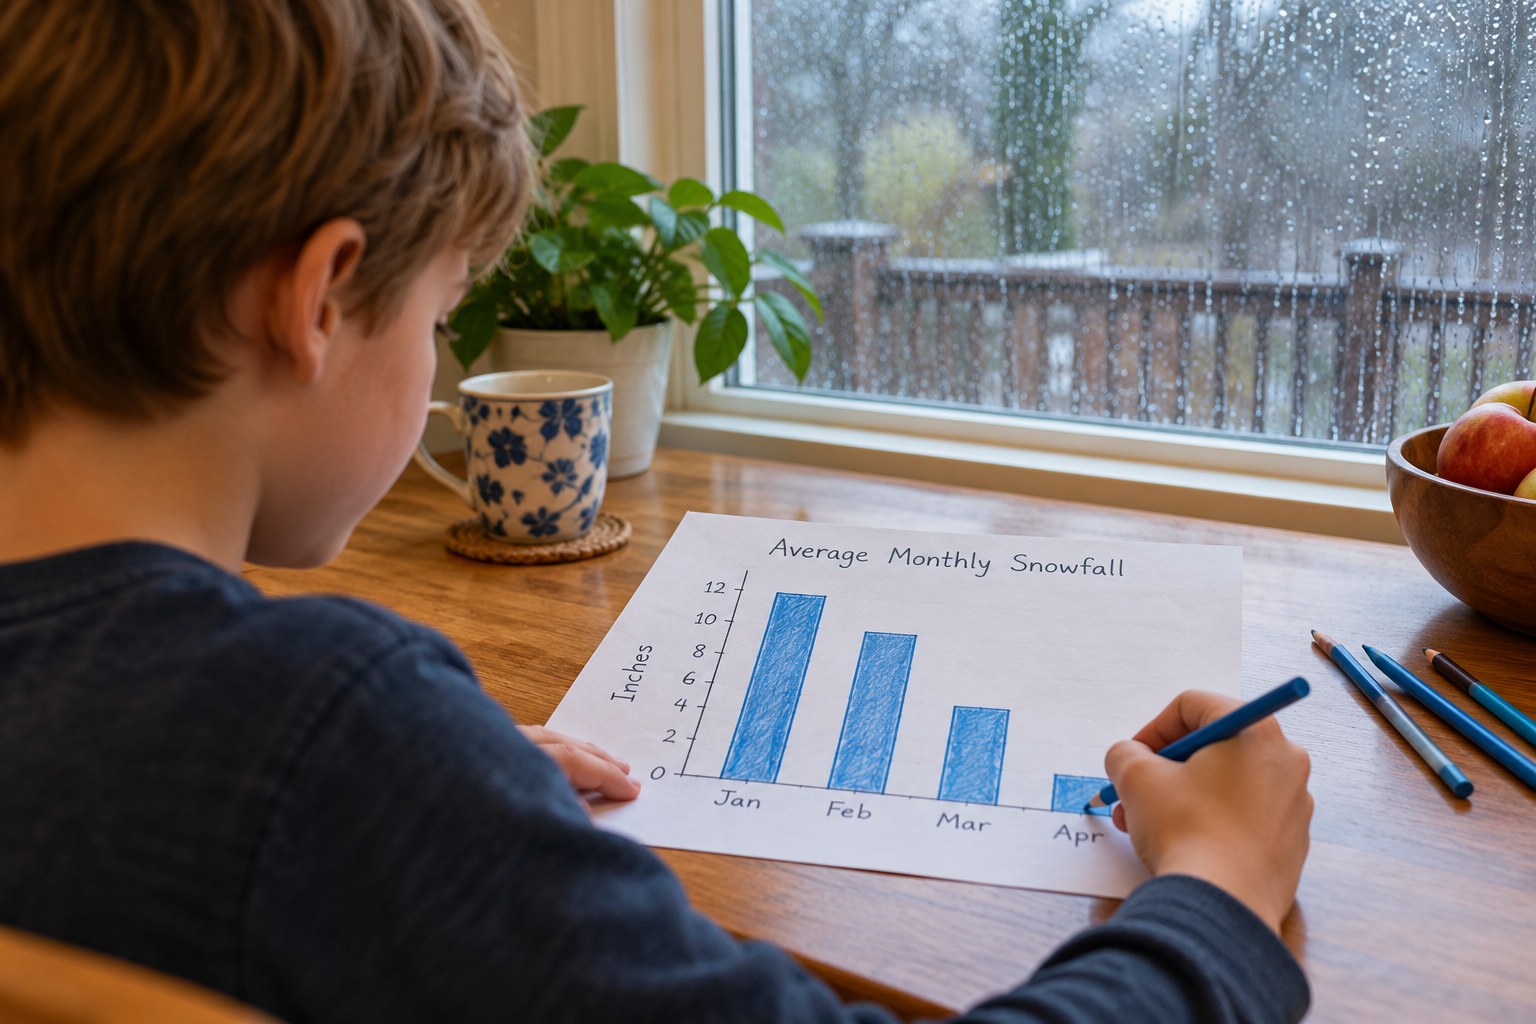
(12 min) Your child draws a bar for each month, dividing by 5 to find how many squares tall it should be. Color winter months (December, January, February) blue, spring green, summer yellow and fall orange.
4Step 4
Ask and answer
(10 min) Your child answers the graph questions in the lesson, such as how many more millimeters fall in January than in October. Have them make up one question of their own for you to answer from the graph.
5Step 5
Check the guesses
(4 min) Look back at the guesses from the start and see whether they were right. Talk about what all that winter rain does: it fills rivers, soaks into the ground and, in the mountains, falls as snow that melts in spring.
Conclusion
Ask: if you had to choose one month for an outdoor picnic in Fresno, which would you pick and why? If it rains this week, set out a straight-sided cup and measure the rain in millimeters to compare with the graph.
Make your own lesson plan in minutes
Describe a topic and Resource Portal AI writes the objectives, materials and steps for your group.
Try Resource Portal AI