Gardening Pollinator Patrol: Count Flower Visitors and Make a Scaled Bar Graph
Overview
Tally pollinators on a flower and graph them with a scale.
Description
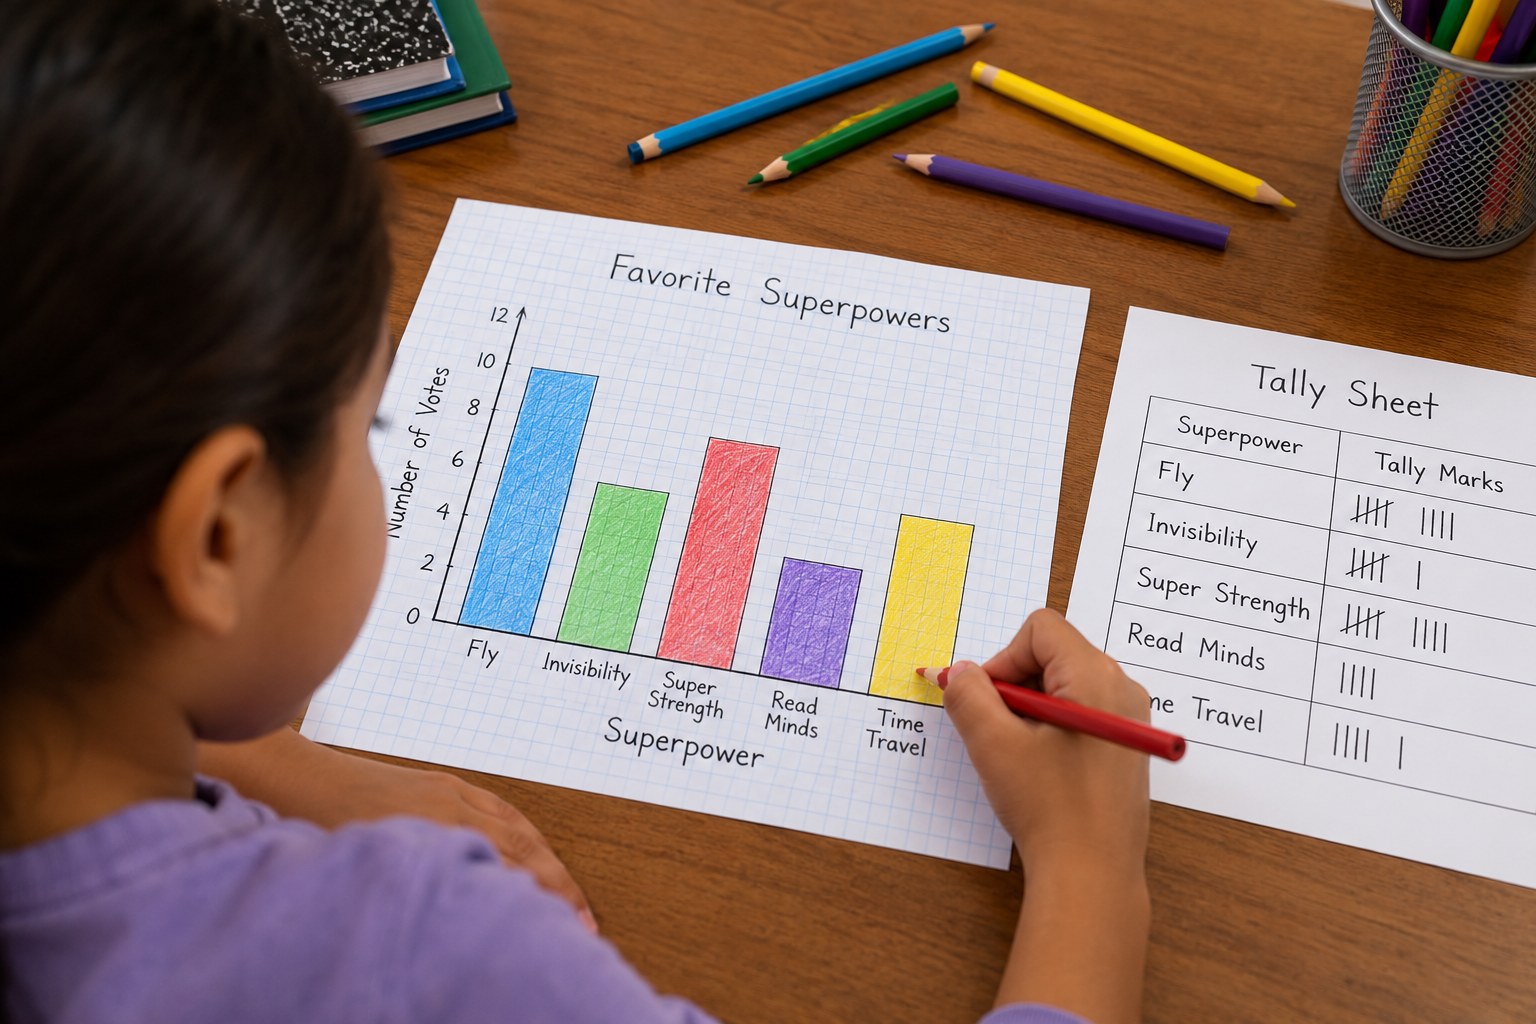
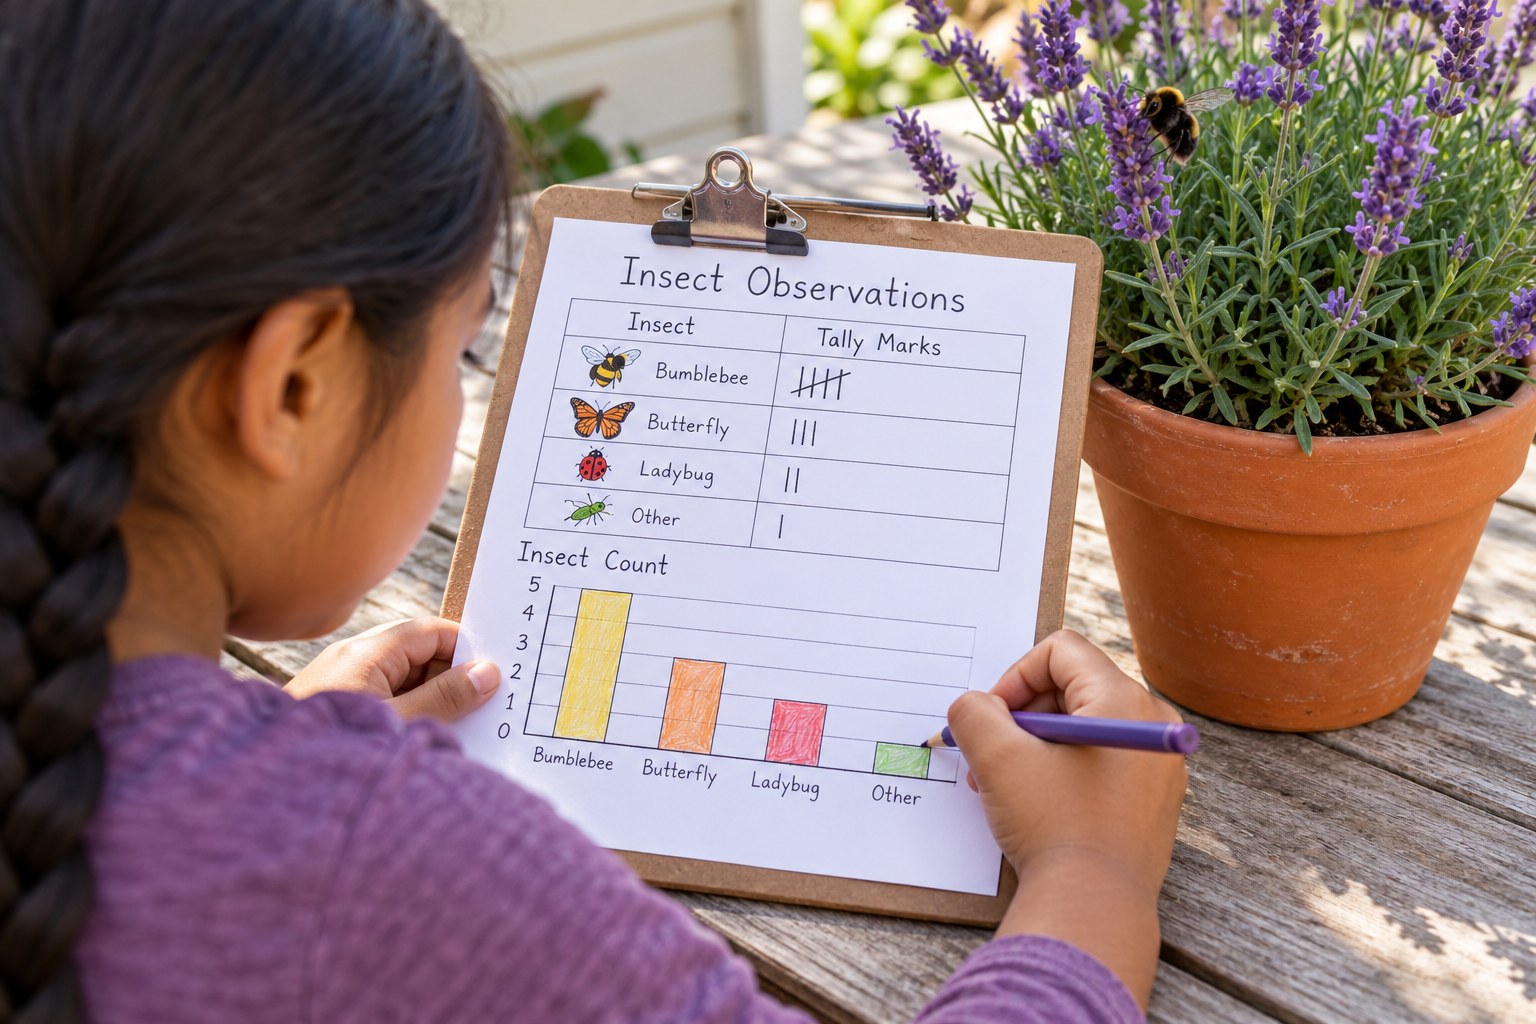
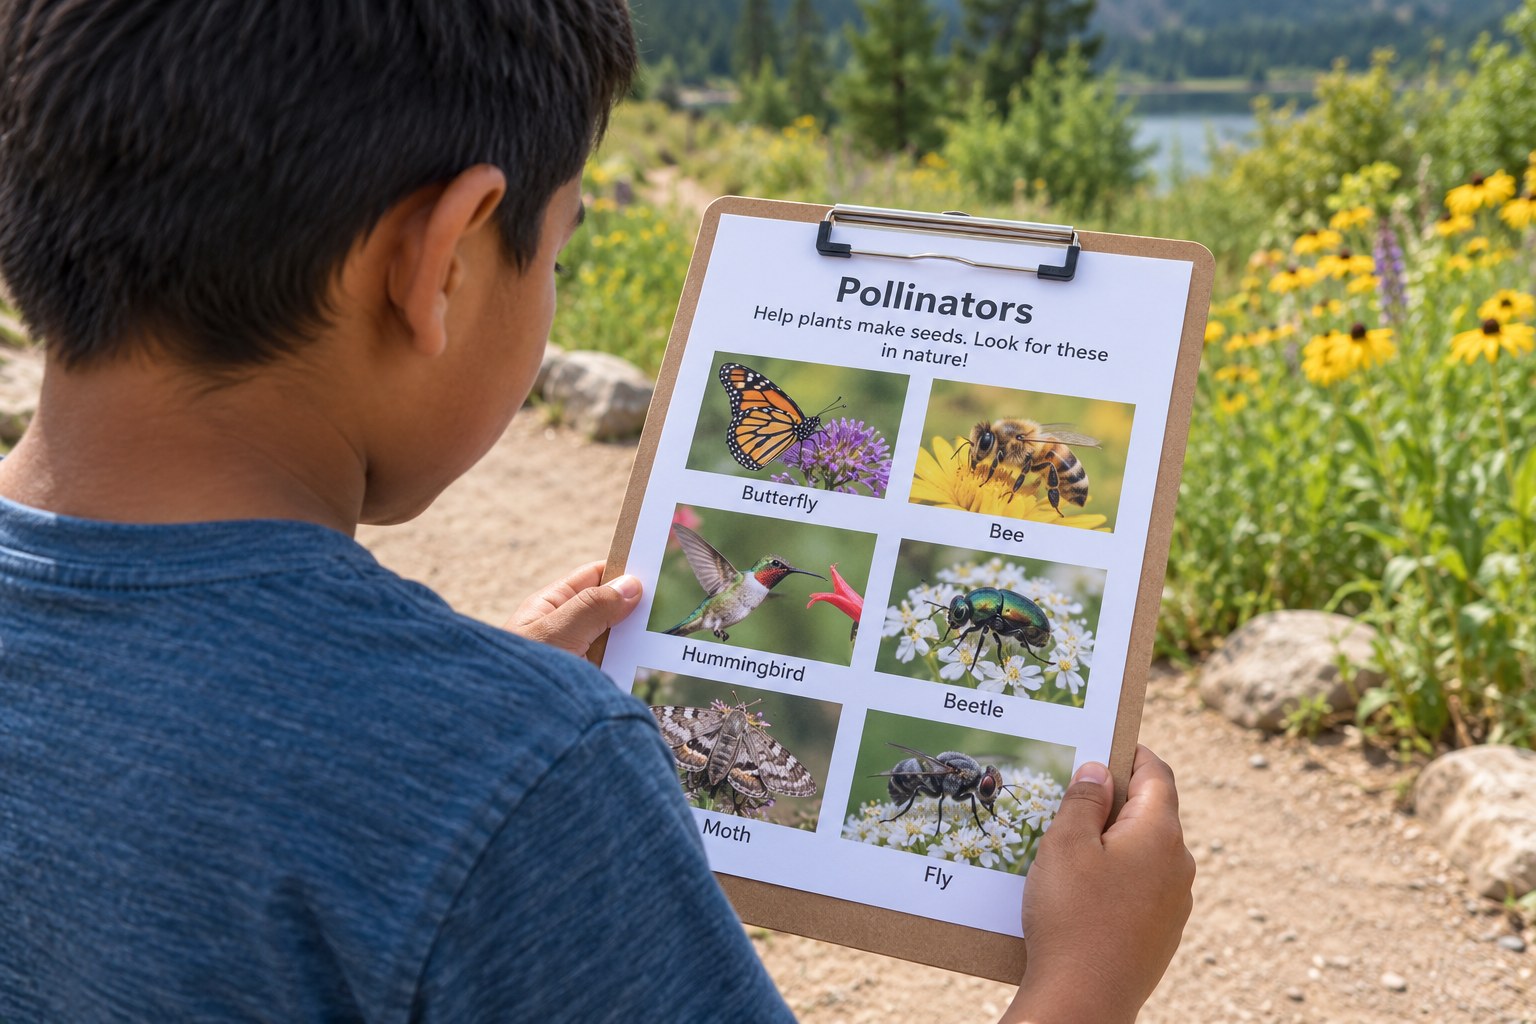
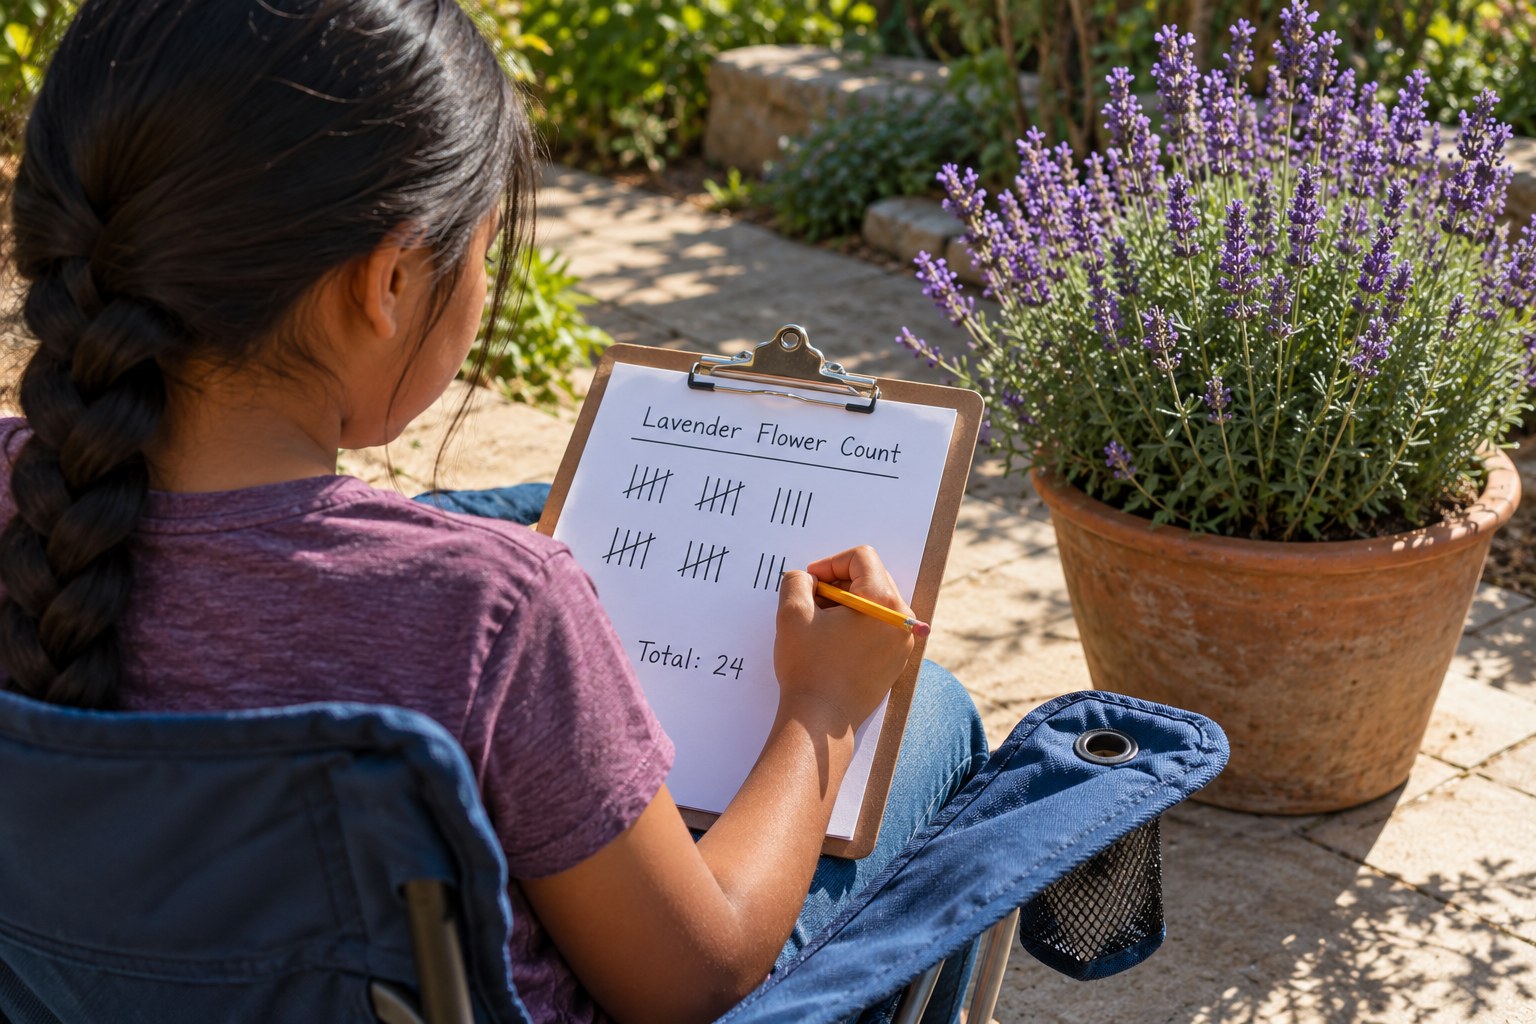
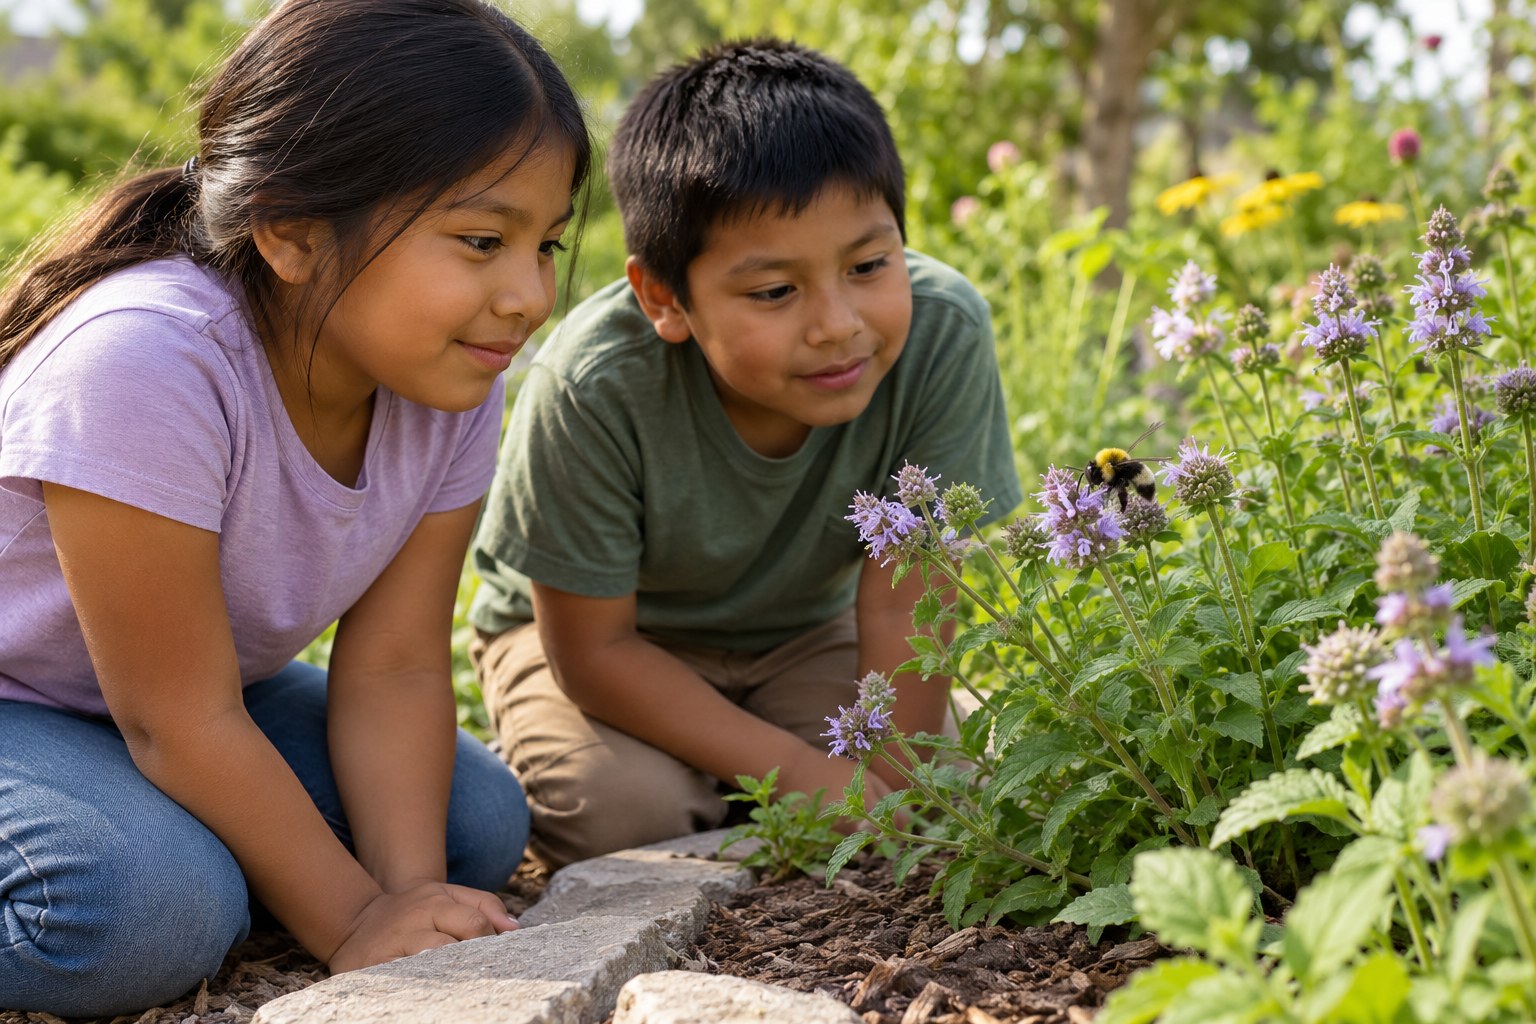
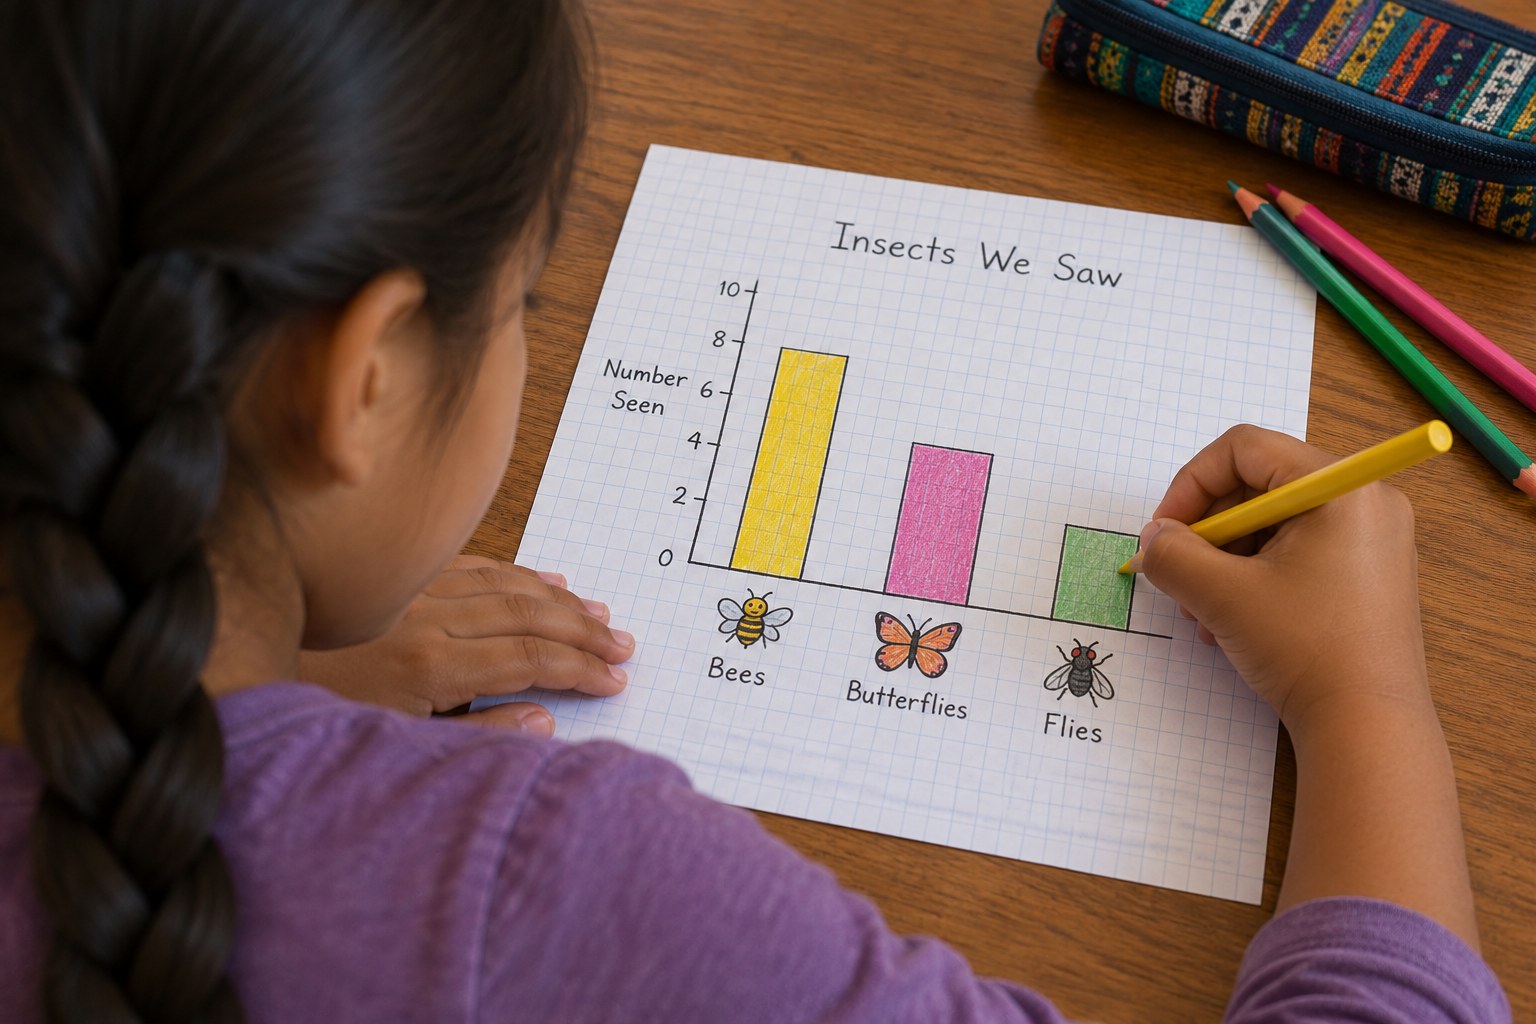
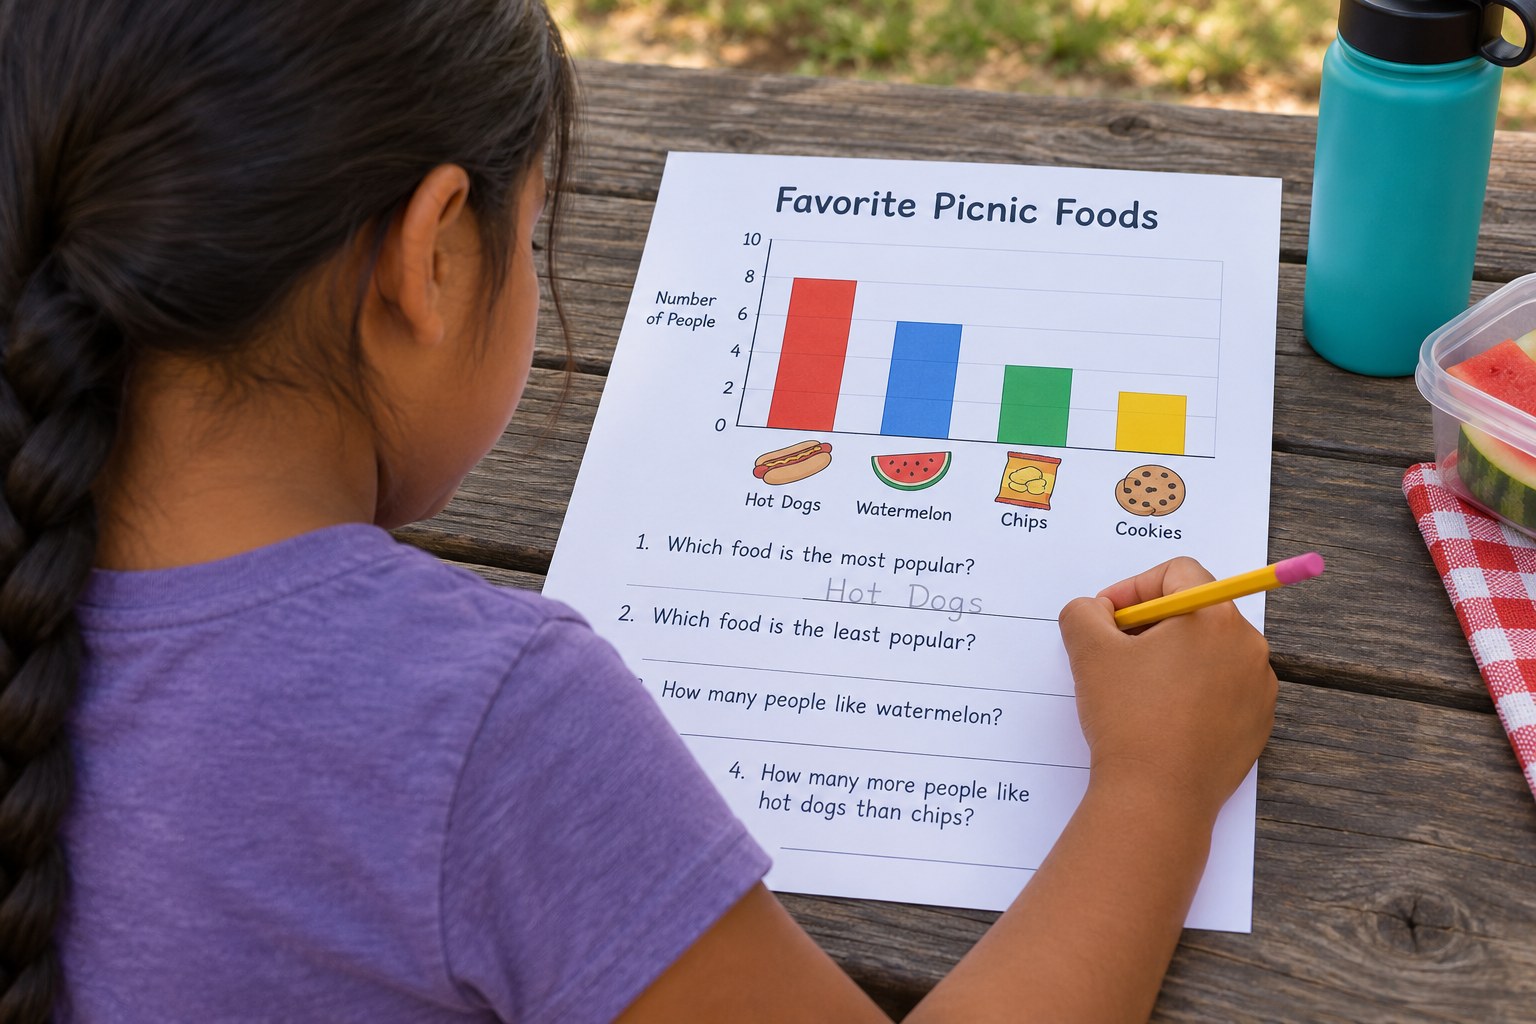
Your child watches one flowering plant (a potted herb, a neighbor's garden, a park planting or a school bed) for two 10-minute sessions, tallies the bees, butterflies, flies, beetles and hummingbirds that visit, then draws a scaled bar graph and answers how-many-more questions about the data.
Objective
Your child will collect categorical data on pollinator visits, draw a scaled bar graph with a scale of 2, and solve one- and two-step comparison problems using the graph.
Standards
Materials
| Item | Quantity |
|---|---|
| Clipboard or hard book and pencil | 1 |
| Pollinator tally sheet from this lesson | 1 per child |
| Timer | 1 |
| Graph paper or lined paper and a ruler | 1 sheet |
| Sun hat, water and a folding chair or mat | 1 each |
| Optional: magnifying glass or phone camera | 1 |
Vocabulary
Preparation
- Find a plant in full bloom that is in sun, such as lavender, basil or oregano in flower, rosemary, sunflowers, zinnias or a flowering shrub. Late morning on a warm, calm day is usually best.
- Copy the tally sheet and talk about the pollinator ID tips in the additional sections.
- Check if anyone has a bee or wasp sting allergy; see the safety notes.
Introduction
Ask: "If you sat by a flower for ten minutes, how many visitors do you think would stop by? Let's be scientists and find out."
What animals have you seen on flowers?
Do you think more visitors come in the morning or afternoon?
Steps
Conclusion
Ask: which pollinator visited most? Do you think the answer would change in a different season or on a cloudy day? Make a prediction and test it.
Make your own lesson plan in minutes
Describe a topic and Resource Portal AI writes the objectives, materials and steps for your group.
Try Resource Portal AI