Superpower Survey: Collect Data and Draw a Scaled Bar Graph
Overview
Survey friends on favorite superpowers and graph the results.
Description
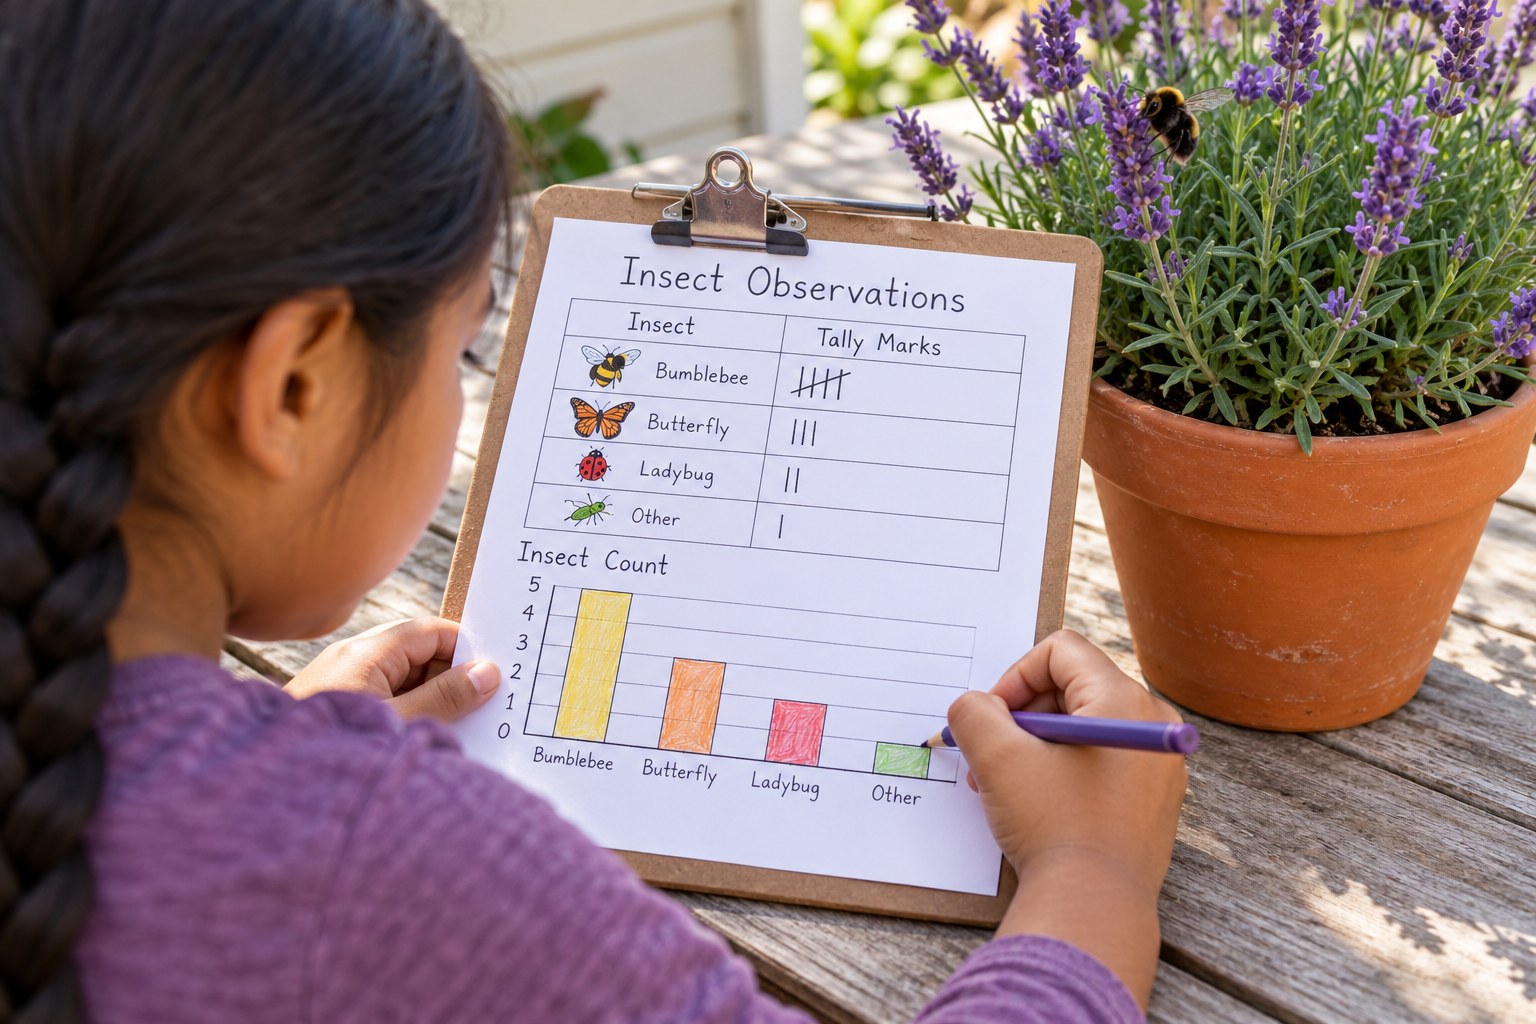
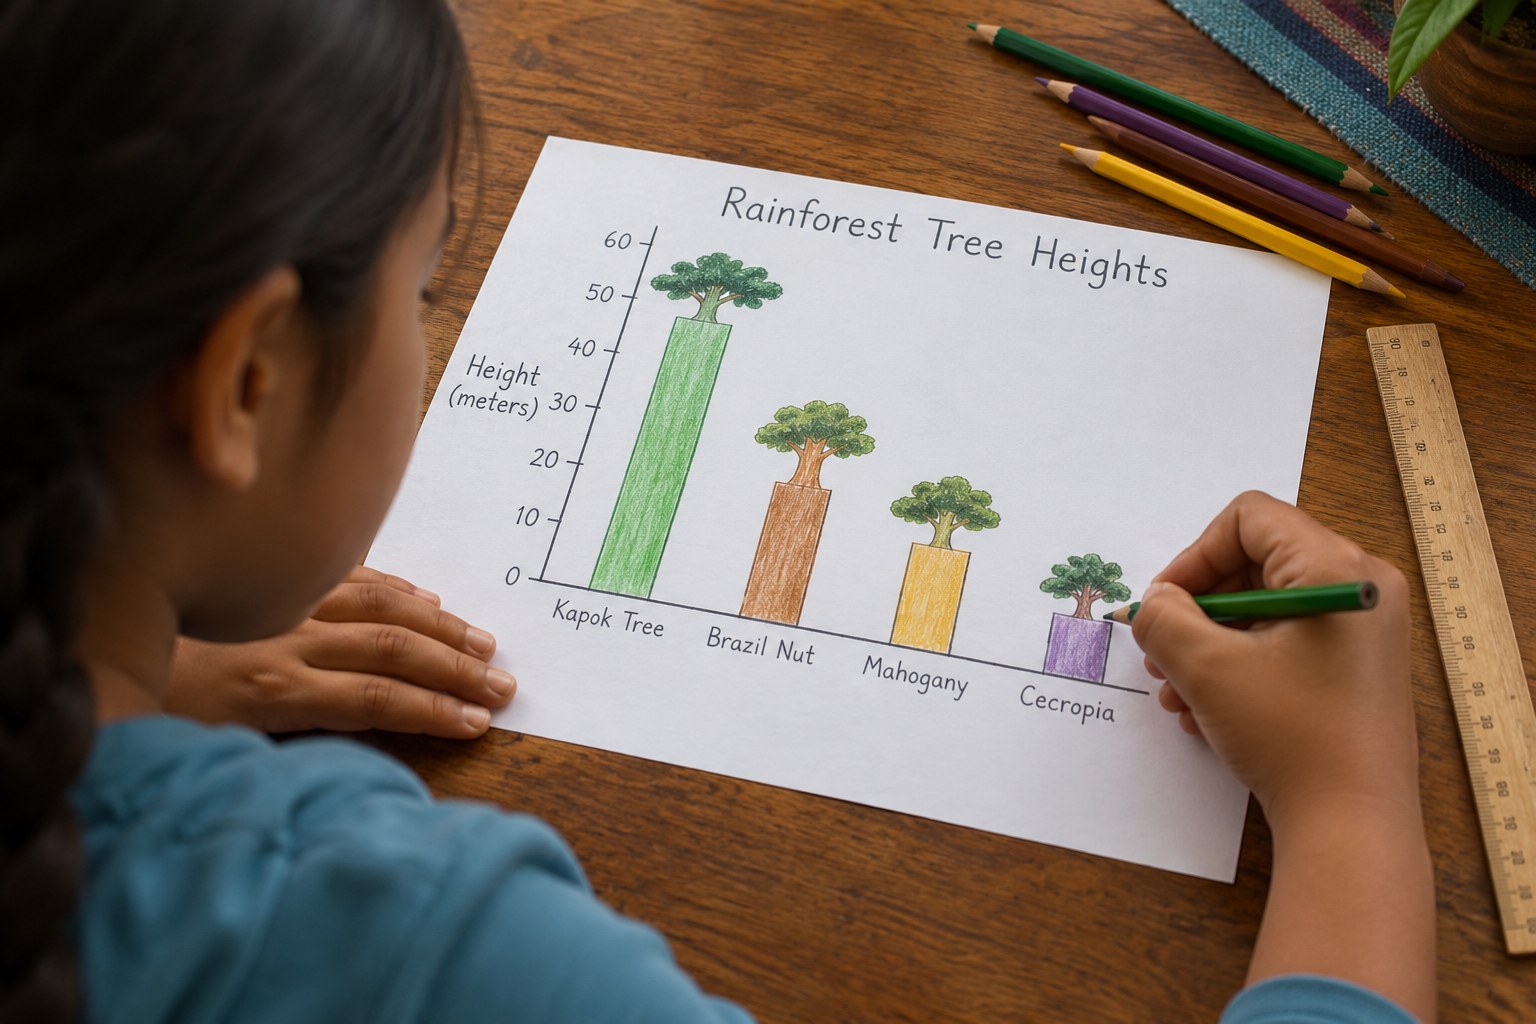
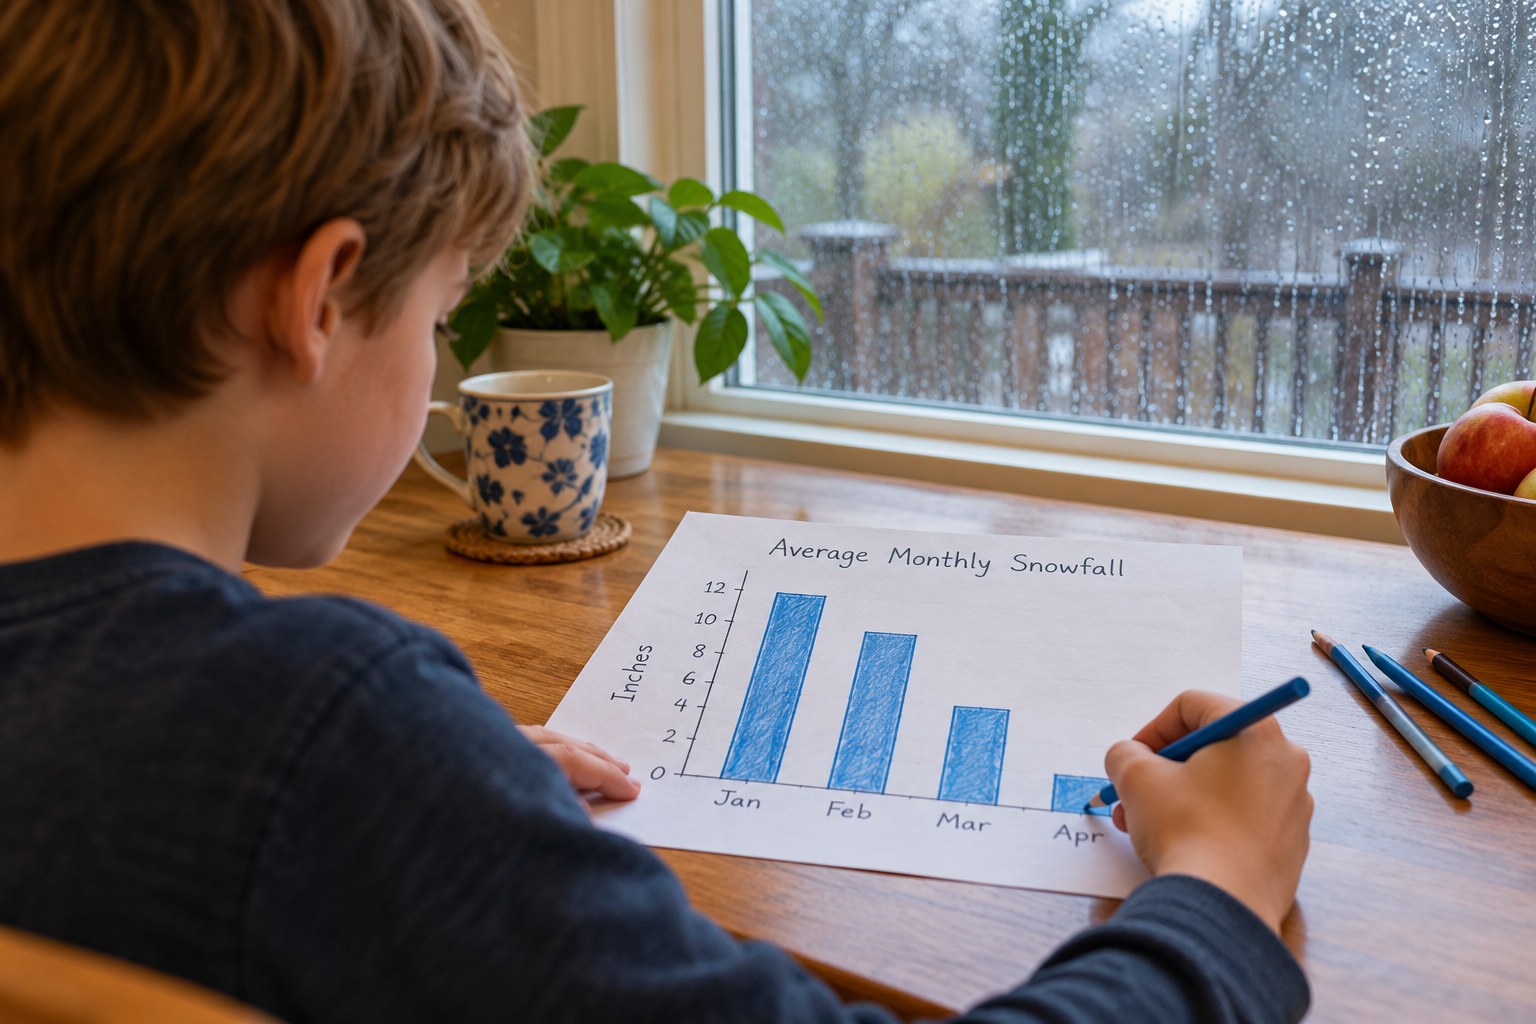
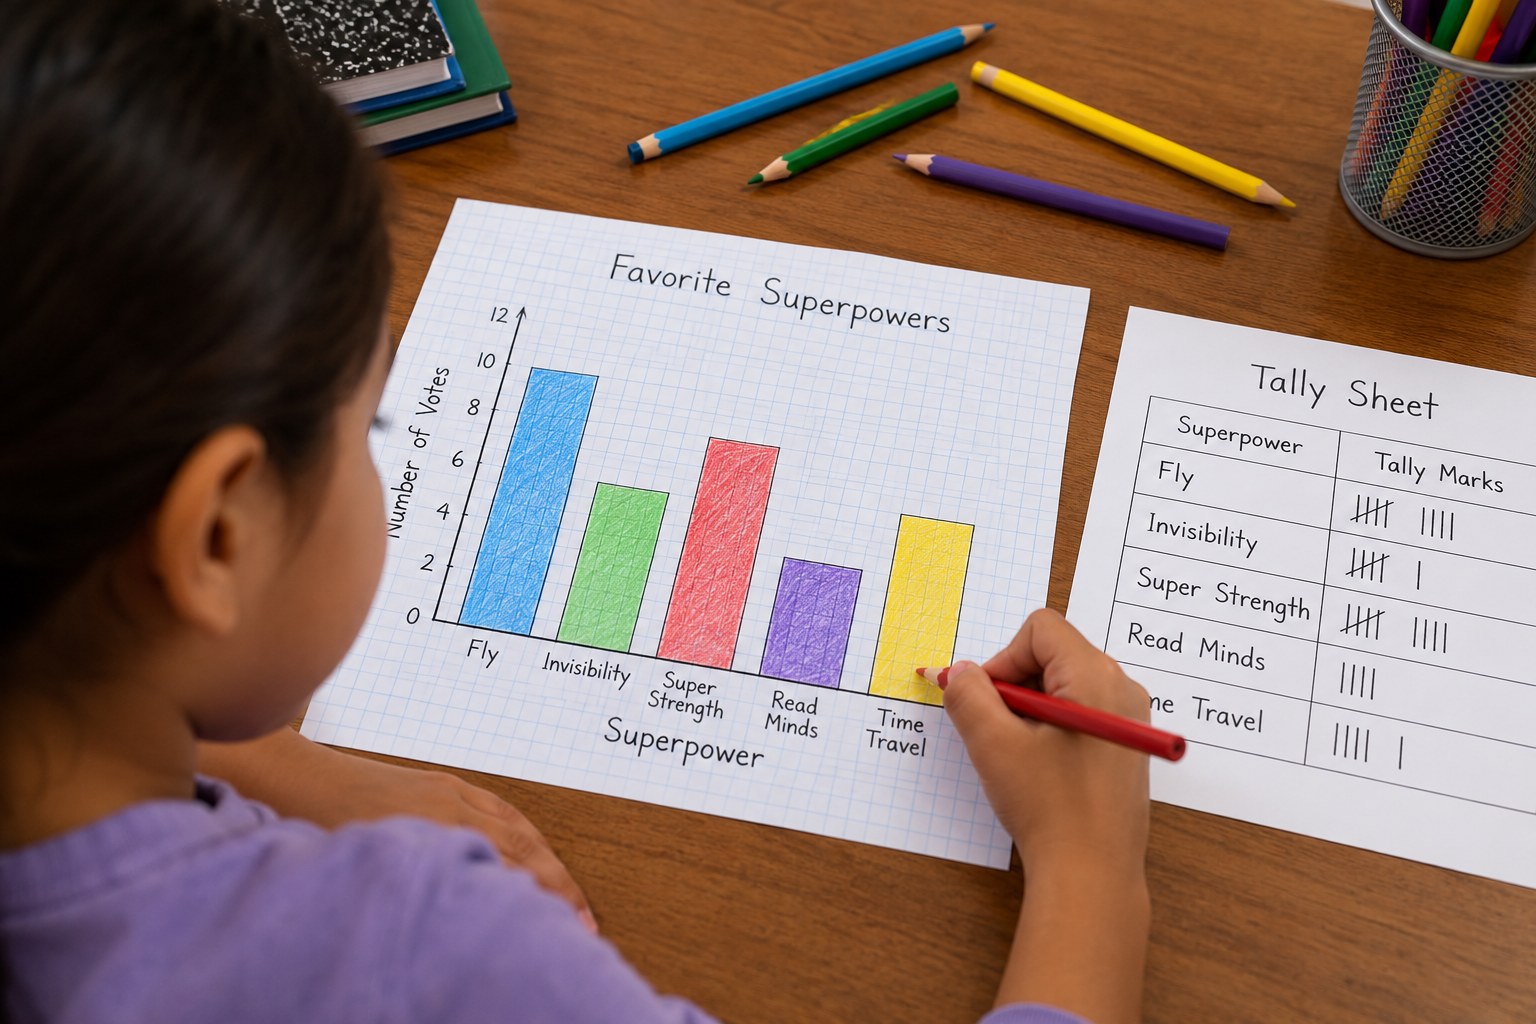
Your child surveys family and friends about which superpower they would choose (flying, invisibility, super speed, talking to animals, healing), organizes the tallies, draws a scaled bar graph and answers 'how many more' and 'how many fewer' questions about the results.
Objective
Your child will collect survey data, draw a scaled bar graph where each square stands for 2 votes, and solve one- and two-step comparison problems using the graph.
Standards
Materials
| Item | Quantity |
|---|---|
| Graph paper or a hand-drawn grid | 2 sheets per child |
| Pencil and ruler | 1 each per child |
| Colored pencils or crayons | 1 set to share |
| Survey sheet (see Additional Sections) | 1 per child |
| Phone or video call for long-distance survey answers (optional) | 1 |
Vocabulary
Preparation
- Make a survey sheet with the question 'Which superpower would you choose?' and 5 choices.
- Plan who your child can ask: aim for 16 to 30 people (family, neighbors, classmates, relatives by phone). In a classroom, survey the class.
Introduction
Ask your child: 'If you could have one superpower, which would it be?' Then ask: 'Do you think most people would pick the same one? How could we find out?'
How can we keep track of lots of answers?
Why might a graph be easier to read than a list of names?
Steps
Conclusion
Ask: 'Was your prediction right? Why might people have chosen that power?' Try a new survey about which everyday hero job people admire most.
Make your own lesson plan in minutes
Describe a topic and Resource Portal AI writes the objectives, materials and steps for your group.
Try Resource Portal AI