Lesson planVeterans Day Data: Box Plots of Ages and Years of Service
Math45 minutesGrades: 6th, 7th, 8th
Overview
Build box plots and choose the best measure of center.
Description
Your teen analyzes a practice data set from an imagined Veterans Day community breakfast, the ages and years of service of 15 veterans, makes box plots, finds mean, median and interquartile range, and explains why the median can describe years of service better than the mean.
Objective
Your teen will display two data sets in box plots, calculate the mean, median and interquartile range, and justify which measure of center best describes each data set.
Standards
6.SP.4Math · Grade 6 · Statistics & Probability Display numerical data in plots on a number line, including dot plots, histograms, and box plots.
6.SP.5cMath · Grade 6 · Statistics & Probability Giving quantitative measures of center (median and/or mean) and variability (interquartile range and/or mean absolute deviation), as well as describing any overall pattern and any striking deviations from the overall pattern with reference to the context in which the data were gathered.
6.SP.5dMath · Grade 6 · Statistics & Probability Relating the choice of measures of center and variability to the shape of the data distribution and the context in which the data were gathered.
Materials
| Item | Quantity |
|---|
| Data cards from this lesson, copied or printed | 1 set |
| Graph paper | 2 sheets per teen |
| Ruler | 1 |
| Pencil and calculator | 1 each |
| Sticky notes | 15 |
Vocabulary
Median
The middle value when data are listed in order.
Mean
The sum of the values divided by how many values there are.
Interquartile range (IQR)
The distance between the first and third quartiles; the spread of the middle half of the data.
Outlier
A value that is much higher or lower than most of the data.
Preparation
- Copy the 'Practice data' section onto paper or sticky notes, one veteran per note (age and years served). Note: this is invented practice data, not a real survey.
- Draw two number lines on graph paper: one from 20 to 90 for ages, one from 0 to 30 for years served.
Introduction
Ask your teen to guess: at a local Veterans Day breakfast, what's the typical age of a veteran? And how many years do most people serve? Write down the guesses. Say: let's see what the data says and how we should summarize it.
What's the difference between a mean and a median?
Why might a few people with very long careers change an average?
Steps
1Step 1
Sort the data
(6 min) Your teen reads the 'About Veterans Day' section, then lines up the 15 sticky notes in order of age, and records the sorted list. They repeat for years served.
2Step 2
Find the five-number summary
(10 min) For ages, your teen finds the minimum, first quartile, median, third quartile and maximum, then calculates the IQR. They repeat for years served and check with the answer key afterward.
3Step 3
Draw the box plots
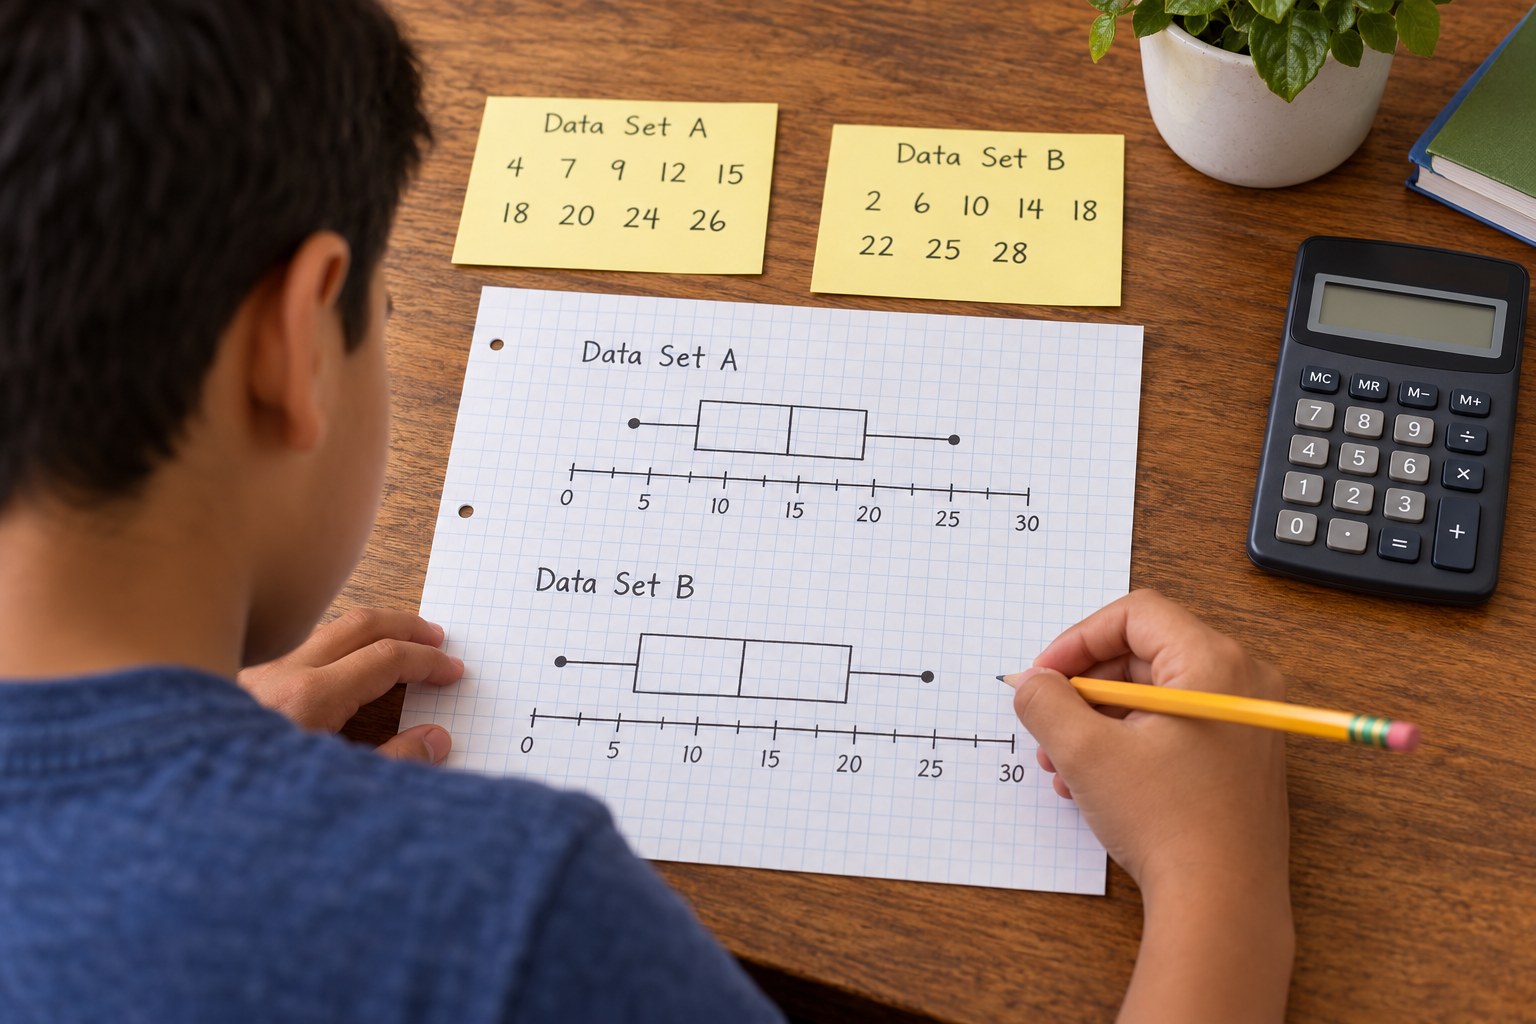
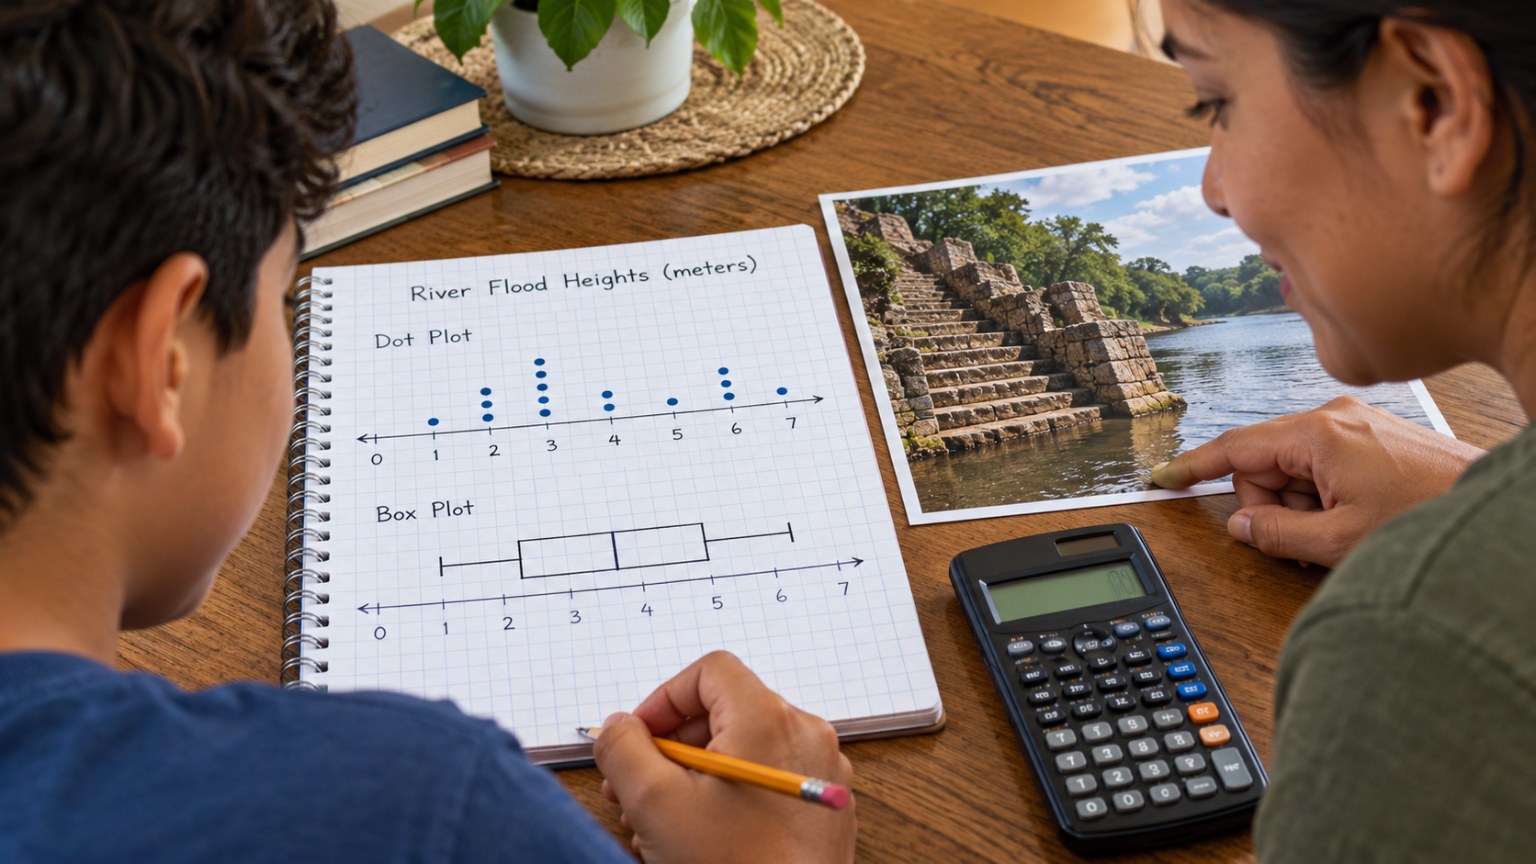
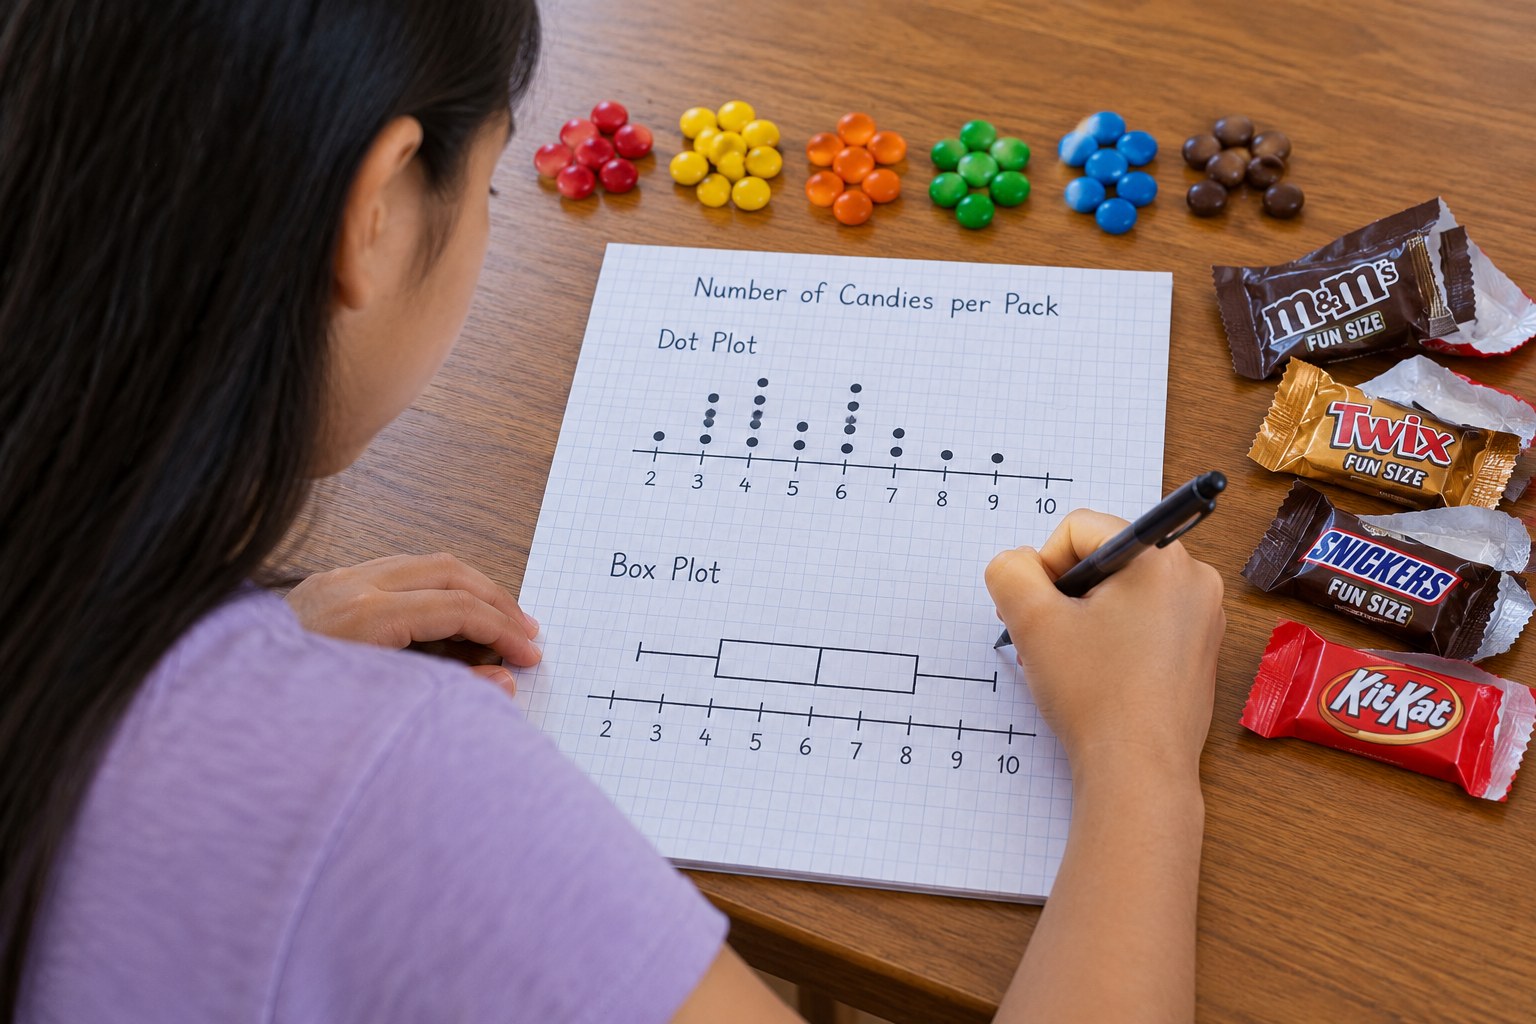
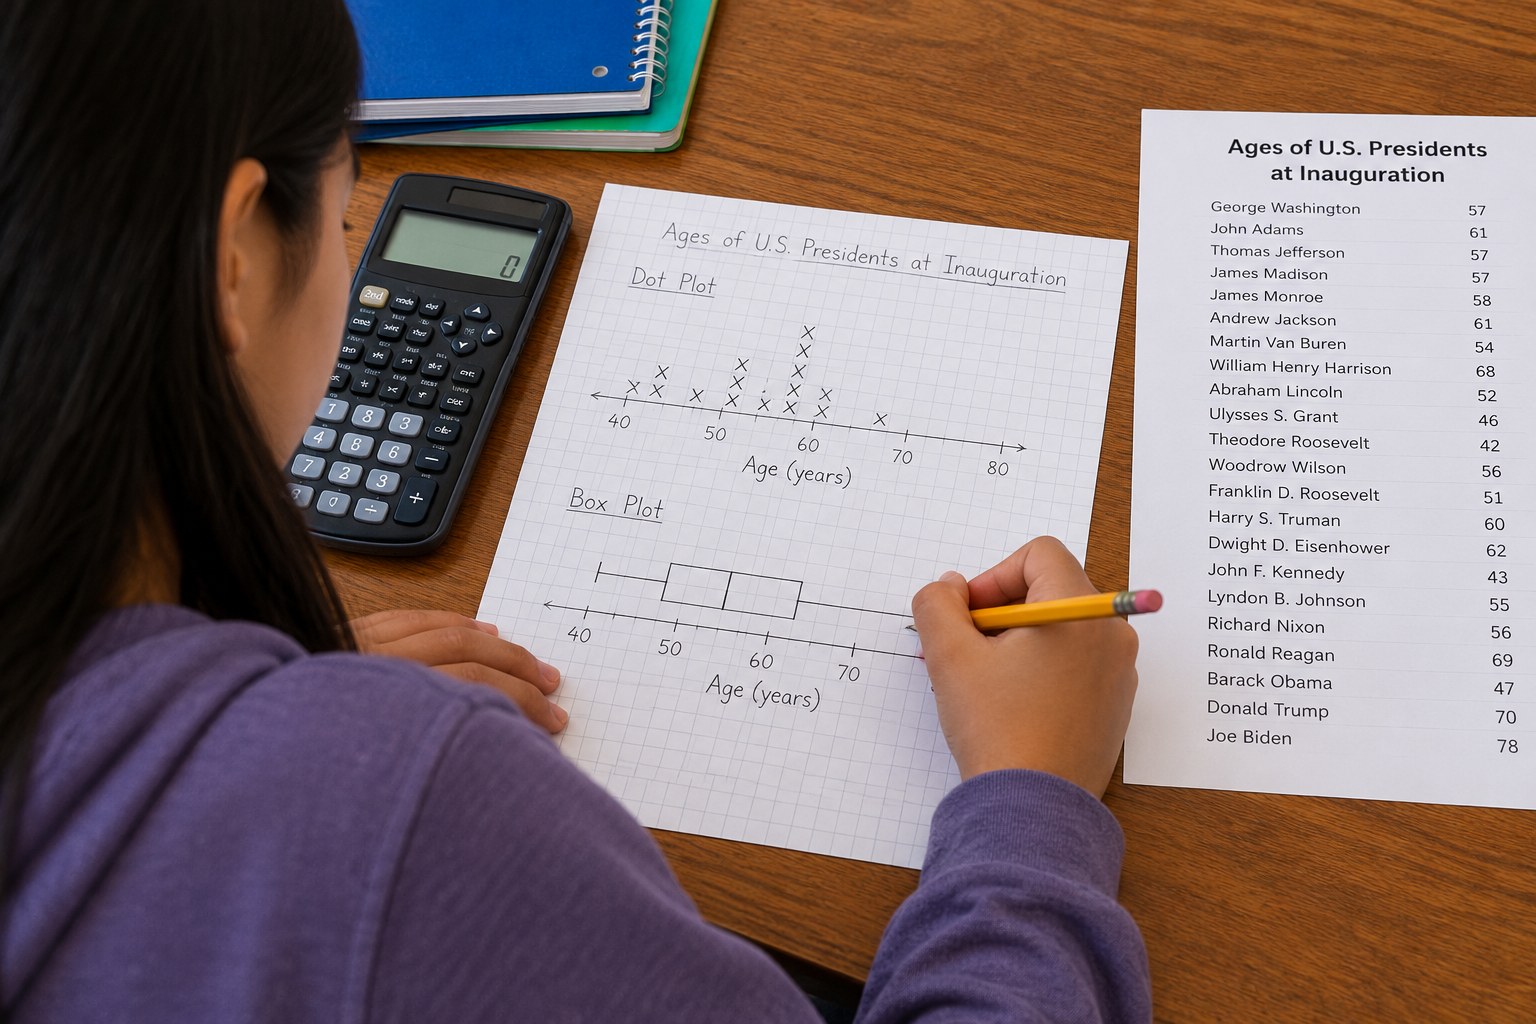
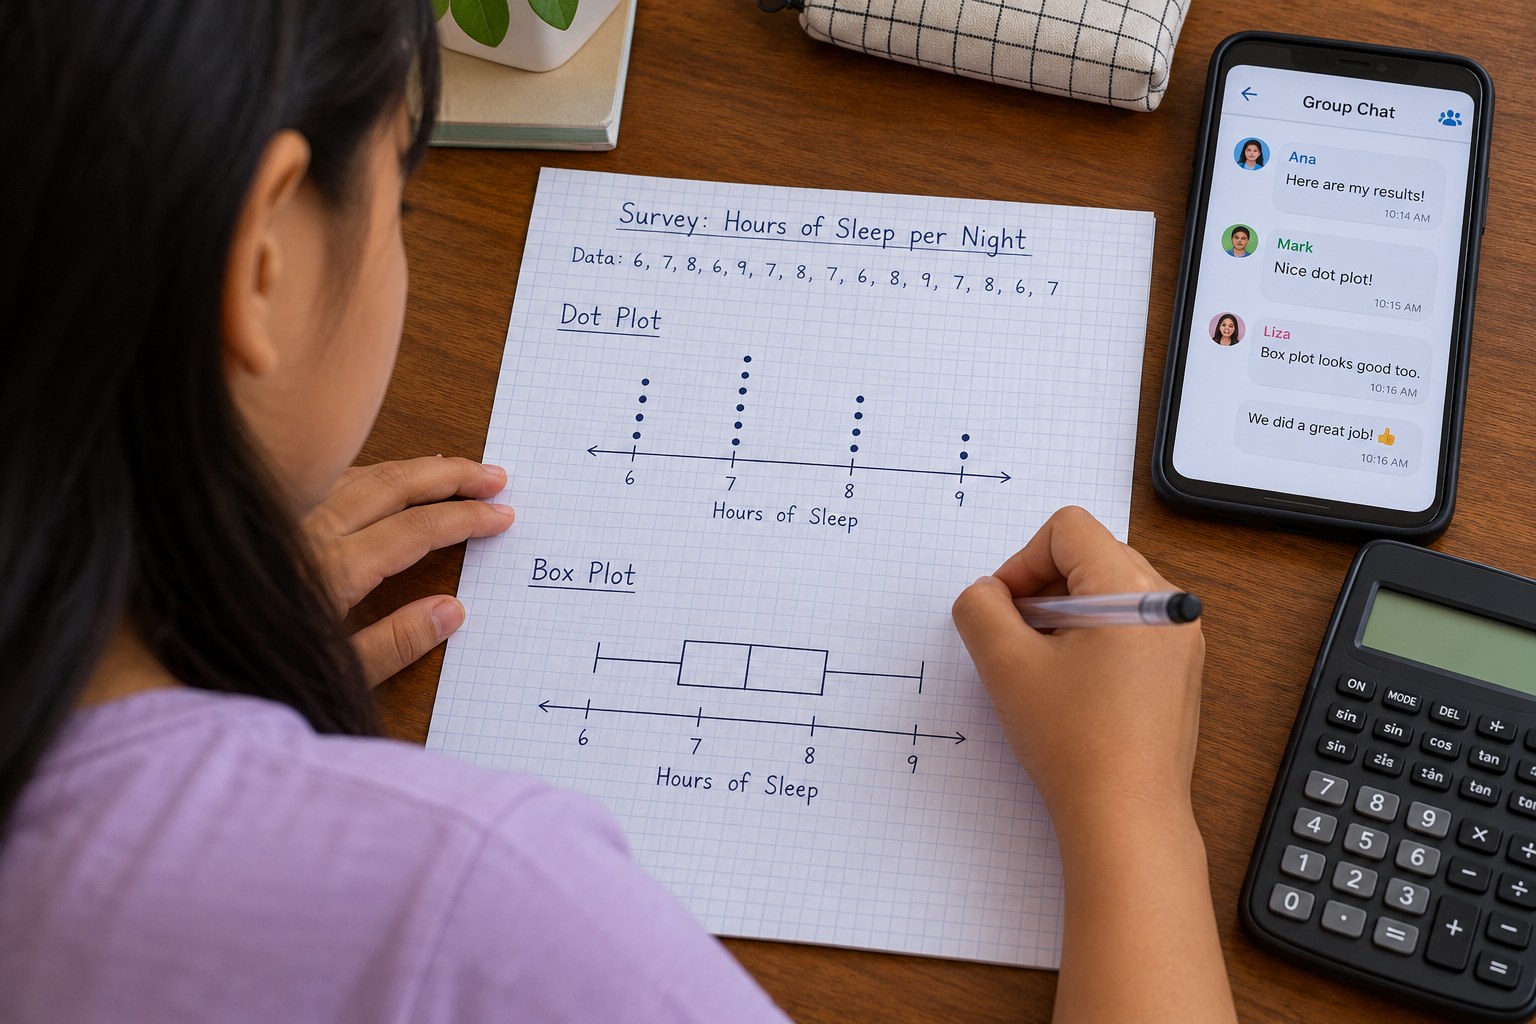
(10 min) Using the number lines, your teen draws a box from Q1 to Q3, a line at the median, and whiskers to the min and max for each data set. Label each plot clearly with a title and units.
4Step 4
Compare mean and median
(10 min) Your teen calculates the mean for each set with the calculator and compares it to the median. Ask why the mean years served (about 8.7) is so much higher than the median (4), and which number better describes a typical veteran in this group.
5Step 5
Write a conclusion
(7 min) Your teen writes 3 sentences summarizing what the data shows, using the words median, IQR and outlier. Discuss how real data about veterans could help a town plan a better Veterans Day event.
Conclusion
Ask: if a new veteran with 40 years of service arrived, which statistic would change more, the mean or the median? Why?
Make your own lesson plan in minutes
Describe a topic and Resource Portal AI writes the objectives, materials and steps for your group.
Try Resource Portal AI