Lesson planPresidents' Day Data: Inauguration Ages of the First 16 Presidents
Math45 minutesGrades: 6th, 7th
Overview
Plot and summarize the ages of presidents from Washington to Lincoln.
Description
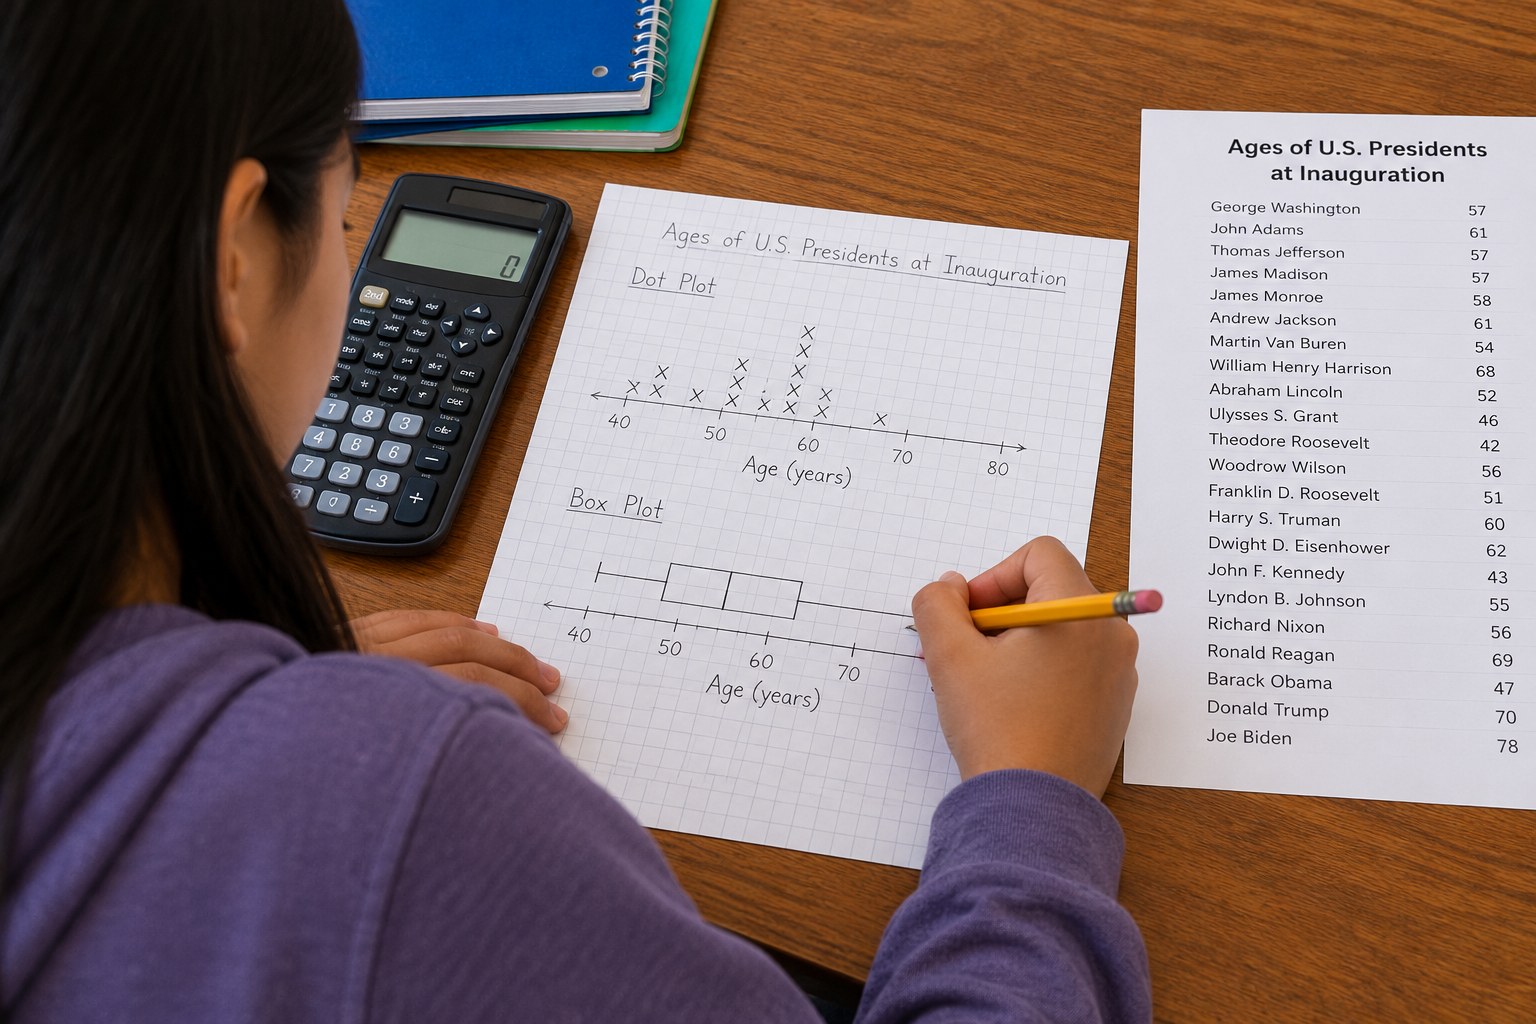
Your teen analyzes the ages of the first 16 U.S. presidents when they took office, from Washington to Lincoln, building a dot plot and a box plot and calculating mean, median, range and interquartile range to describe what a 'typical' new president looked like.
Objective
Your teen will display a real data set in a dot plot and a box plot and summarize it using measures of center and variability.
Standards
6.SP.4Math · Grade 6 · Statistics & Probability Display numerical data in plots on a number line, including dot plots, histograms, and box plots.
6.SP.5cMath · Grade 6 · Statistics & Probability Giving quantitative measures of center (median and/or mean) and variability (interquartile range and/or mean absolute deviation), as well as describing any overall pattern and any striking deviations from the overall pattern with reference to the context in which the data were gathered.
Materials
| Item | Quantity |
|---|
| Graph paper | 2 sheets |
| Pencil, ruler and eraser | 1 each |
| Calculator | 1 |
| The 'Data set' section printed or on a screen | 1 copy |
| Sticky dots or small sticky notes (optional, for a wall dot plot) | 16 |
Vocabulary
Inauguration
The ceremony where a new president takes the oath of office.
Median
The middle value when data is put in order.
Interquartile range (IQR)
The difference between the third quartile and the first quartile; the spread of the middle half of the data.
Outlier
A value far away from most of the others.
Preparation
- Print or copy the data table.
- Draw a number line from 45 to 70 on graph paper as a starting point if your teen wants a head start.
Introduction
Ask your teen to guess the age of a typical new president in the early days of the country. Write their guess down; you'll check it against the data at the end.
What is the minimum age to be president under the Constitution?
Do you think early presidents were older or younger than presidents today?
Steps
1Step 1
Look at the data
(5 min) Read the data table together and note the Constitution's rule that a president must be at least 35. Your teen predicts the youngest and oldest ages before looking closely.
2Step 2
Make a dot plot
(10 min) Your teen draws a number line from 45 to 70 and places one dot above the correct age for each president. They describe the shape: where the data clusters, any gaps, and whether any value looks like an outlier.
3Step 3
Calculate center
(10 min) Your teen orders the 16 ages, finds the median (the mean of the 8th and 9th values), and calculates the mean with a calculator. They compare the two and explain why they are close or different.
4Step 4
Build the box plot
(12 min) Your teen splits the ordered data into lower and upper halves to find Q1 and Q3, then draws a box plot under the dot plot using the minimum, Q1, median, Q3 and maximum. They calculate the range and the IQR.
5Step 5
Write a summary
(6 min) Your teen writes three sentences describing a typical new president in this period, using the median and IQR as evidence. Then they compare it with their original guess.
Conclusion
Ask: which measure, mean or median, better describes a typical age here, and why? What would you predict if you added all presidents since Lincoln?
Make your own lesson plan in minutes
Describe a topic and Resource Portal AI writes the objectives, materials and steps for your group.
Try Resource Portal AI