
Lesson plans for 6.SP.5c
Math · Grade 6 · Statistics & Probability
Giving quantitative measures of center (median and/or mean) and variability (interquartile range and/or mean absolute deviation), as well as describing any overall pattern and any striking deviations from the overall pattern with reference to the context in which the data were gathered.
26 ready-to-teach lesson plans aligned to this standard. Each includes objectives, a materials list, vocabulary and step-by-step activities.
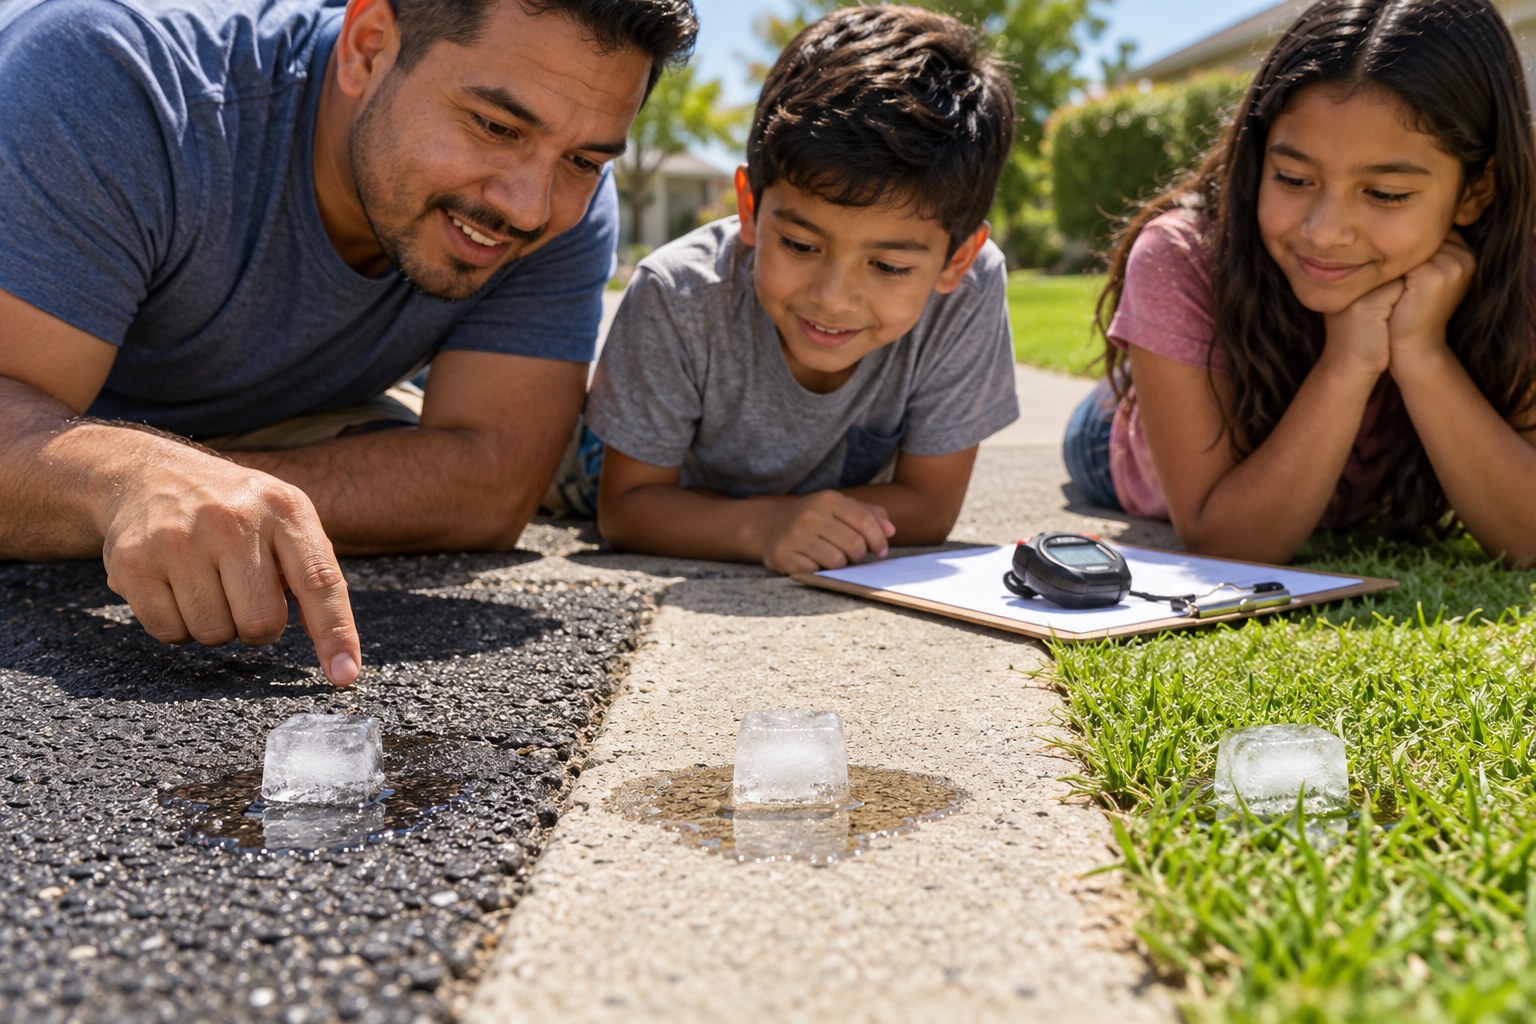
Summer Heat Island Test: Ice Melt Times on Five Surfaces
Time ice melting on five surfaces and compare with mean and MAD.
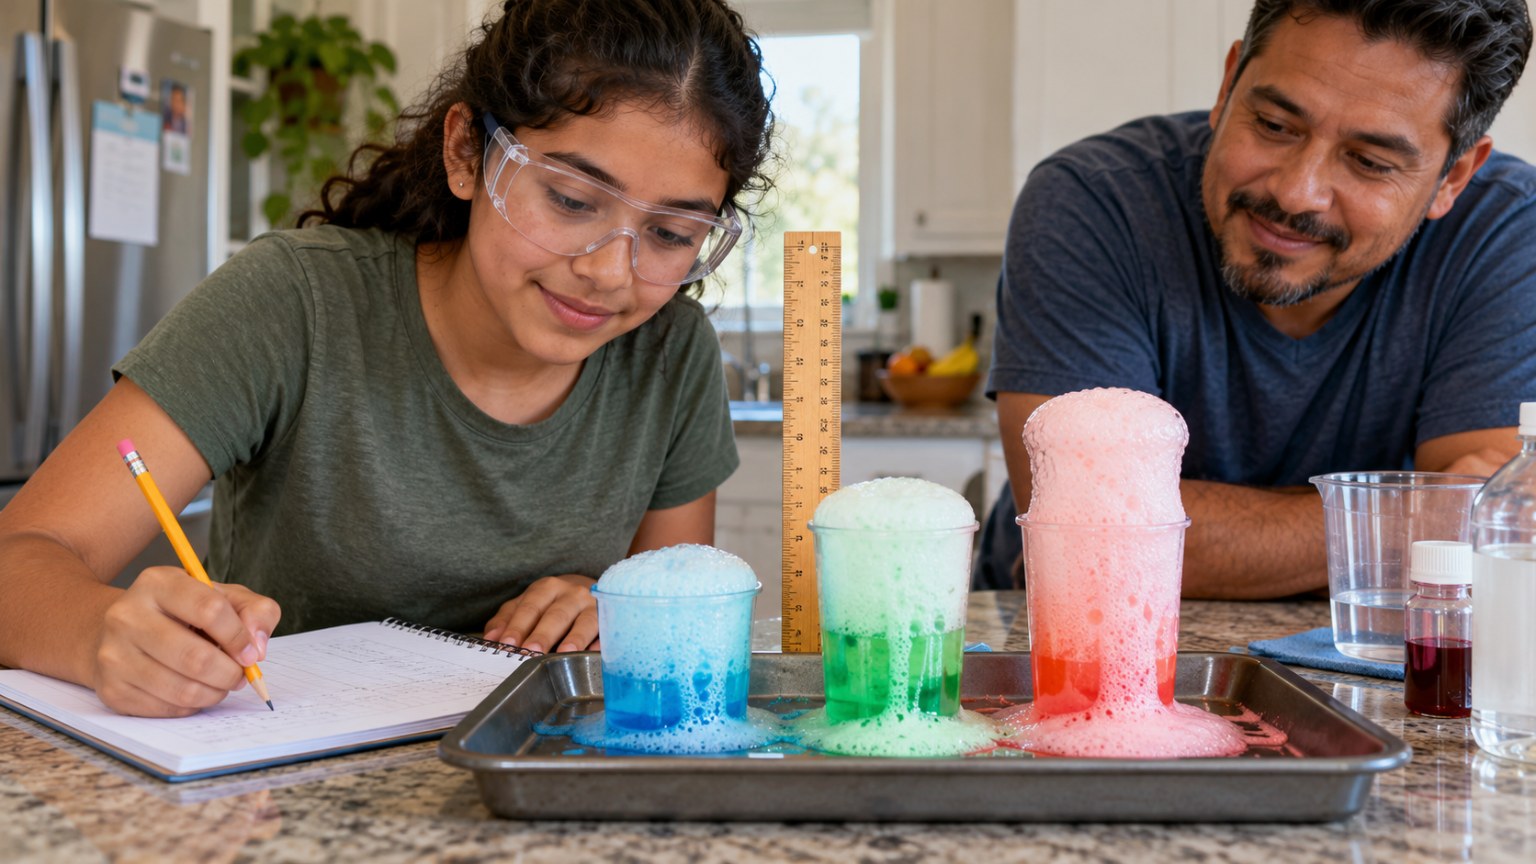
Kitchen Science Catalyst Foam: How Much Yeast Makes the Tallest Foam?
Test yeast as a catalyst and analyze foam data.
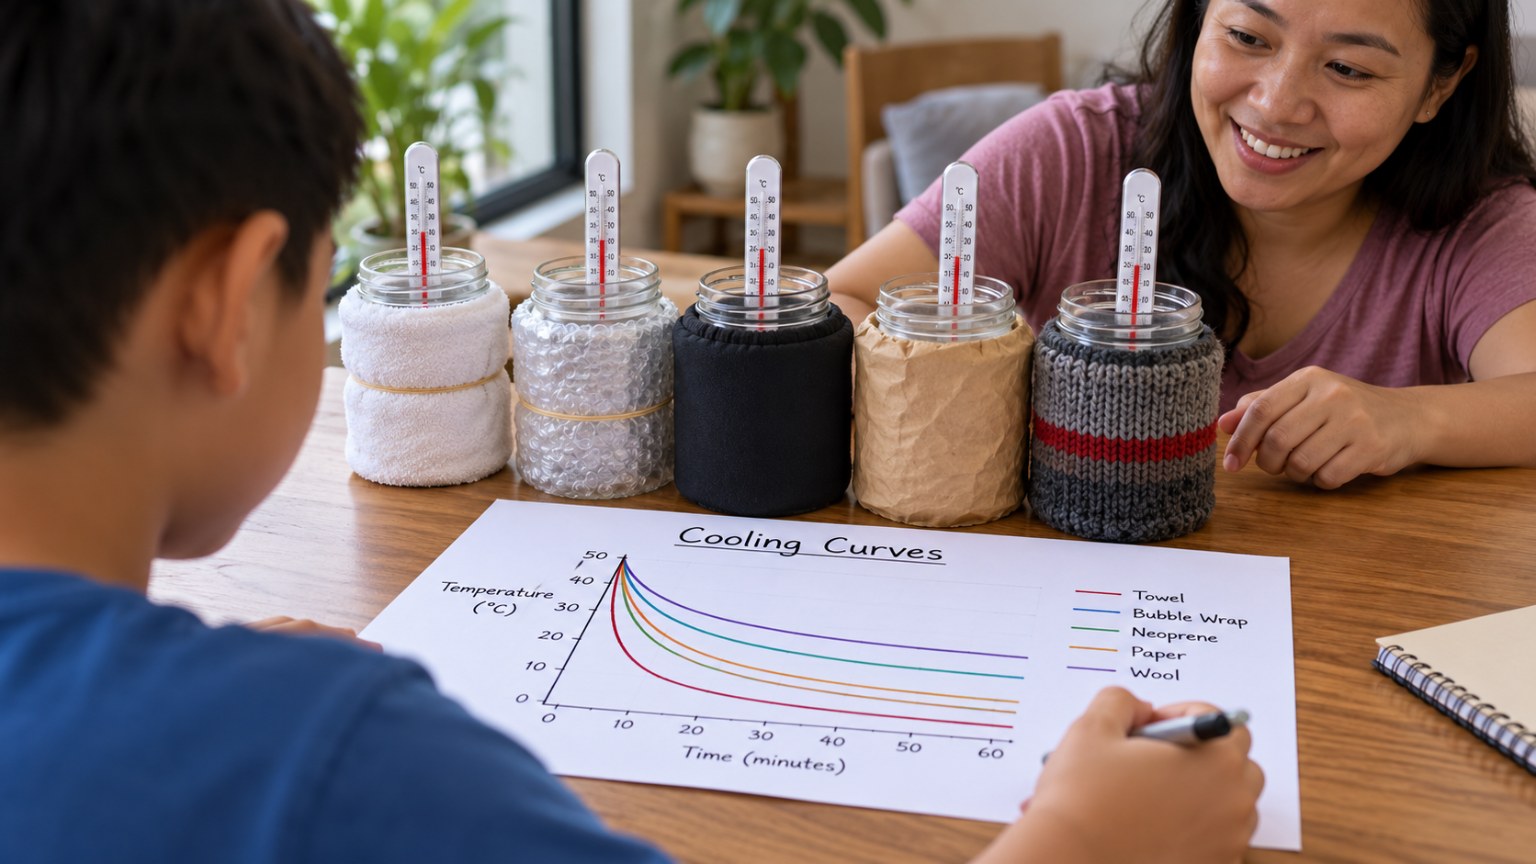
Sleeping Bag Insulation Test: Which Layer Keeps a Camper Warmest?
Test which camping layer holds heat best and back it with data.
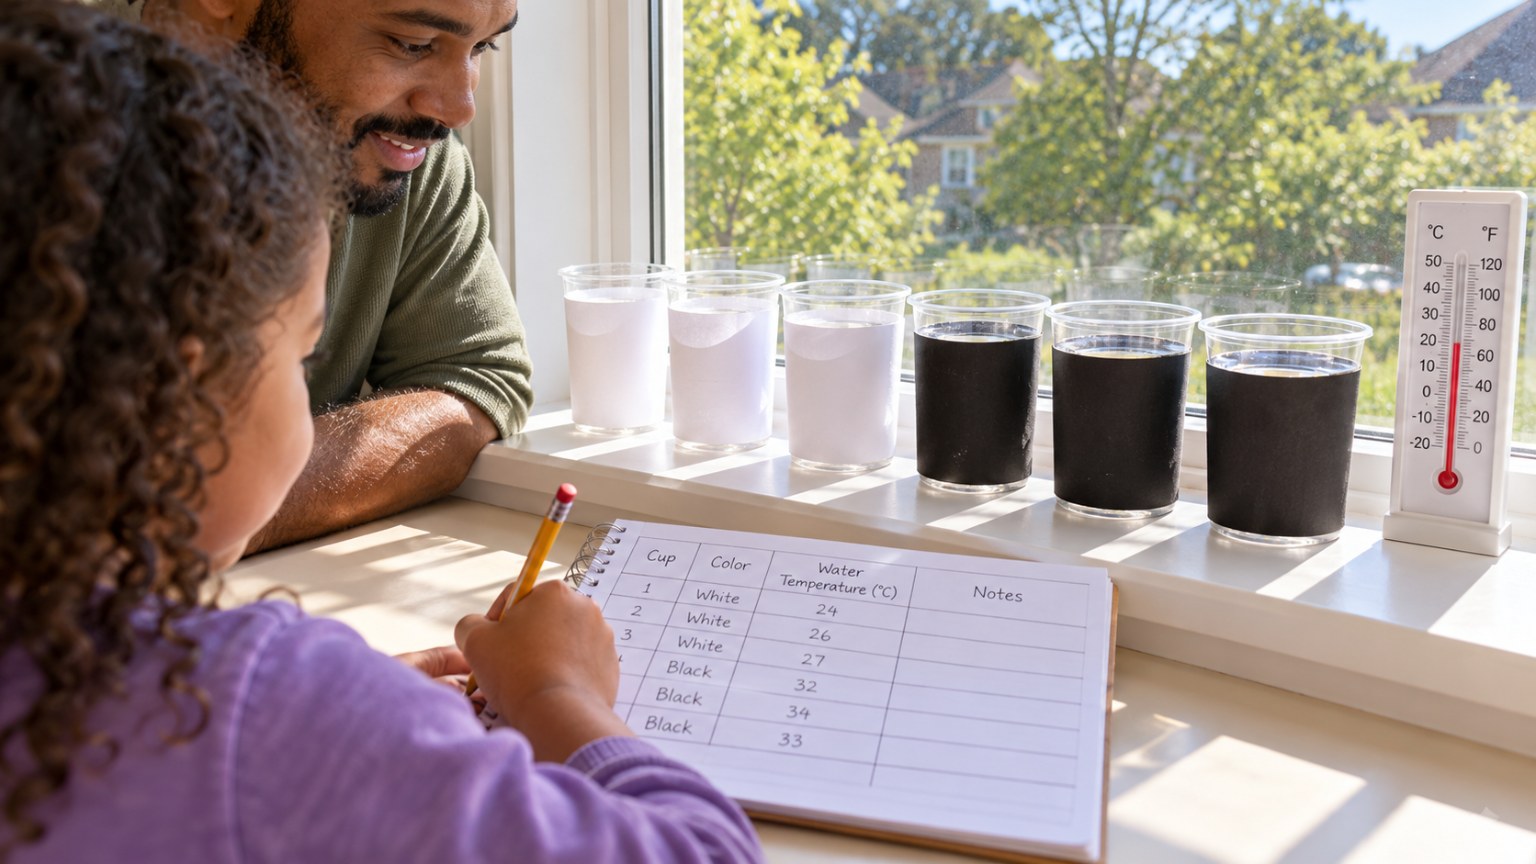
Albedo Lab: Why Melting Sea Ice Makes the Arctic Warm Faster
Measure how surface color changes heat absorbed, like ice versus ocean.
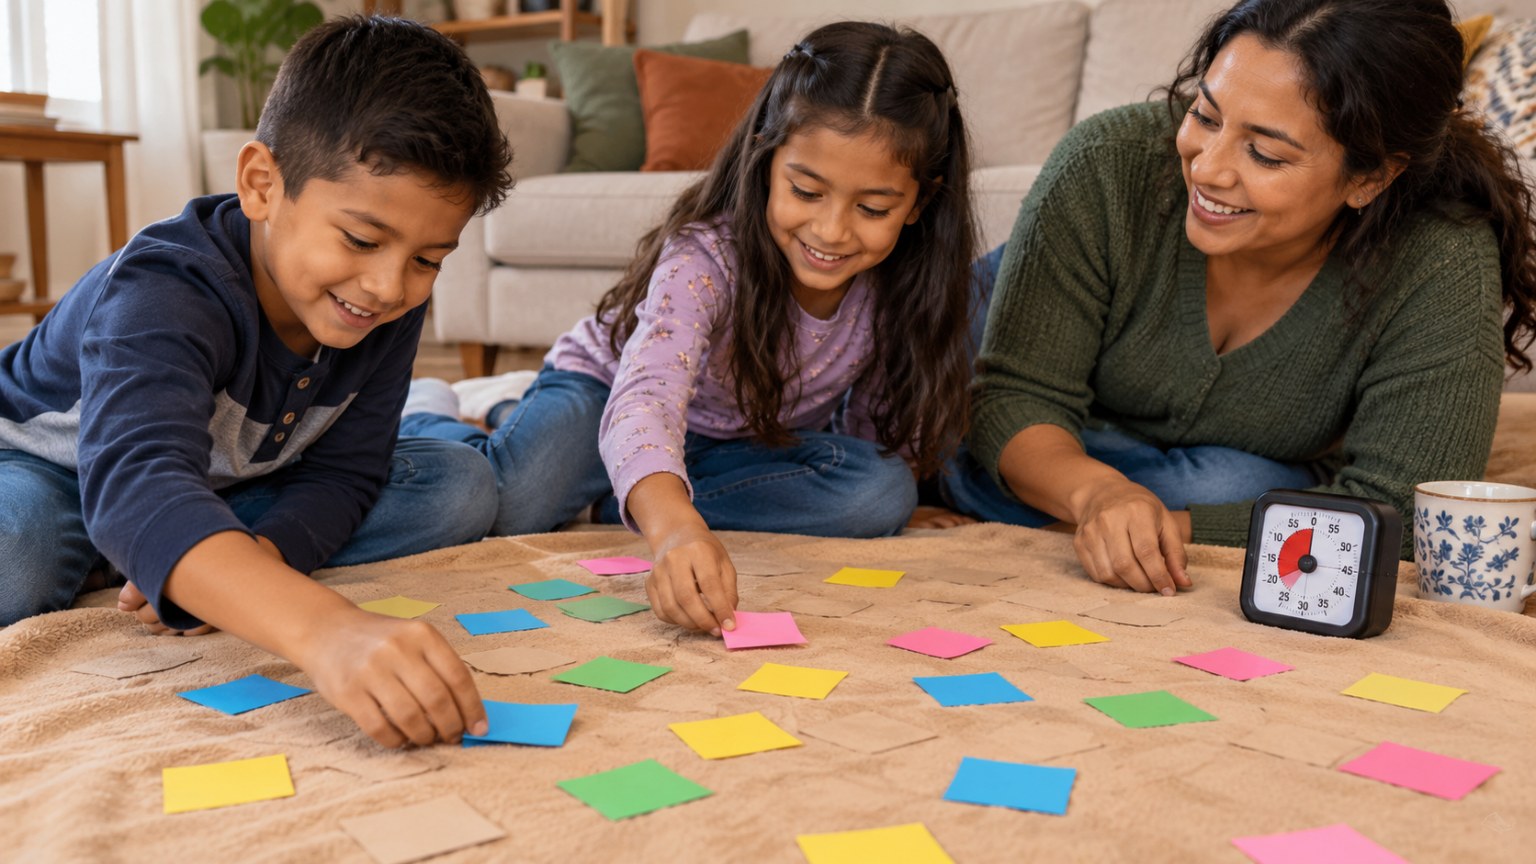
Savanna Camouflage Survival Experiment
Test which prey colors survive best on a pretend savanna.
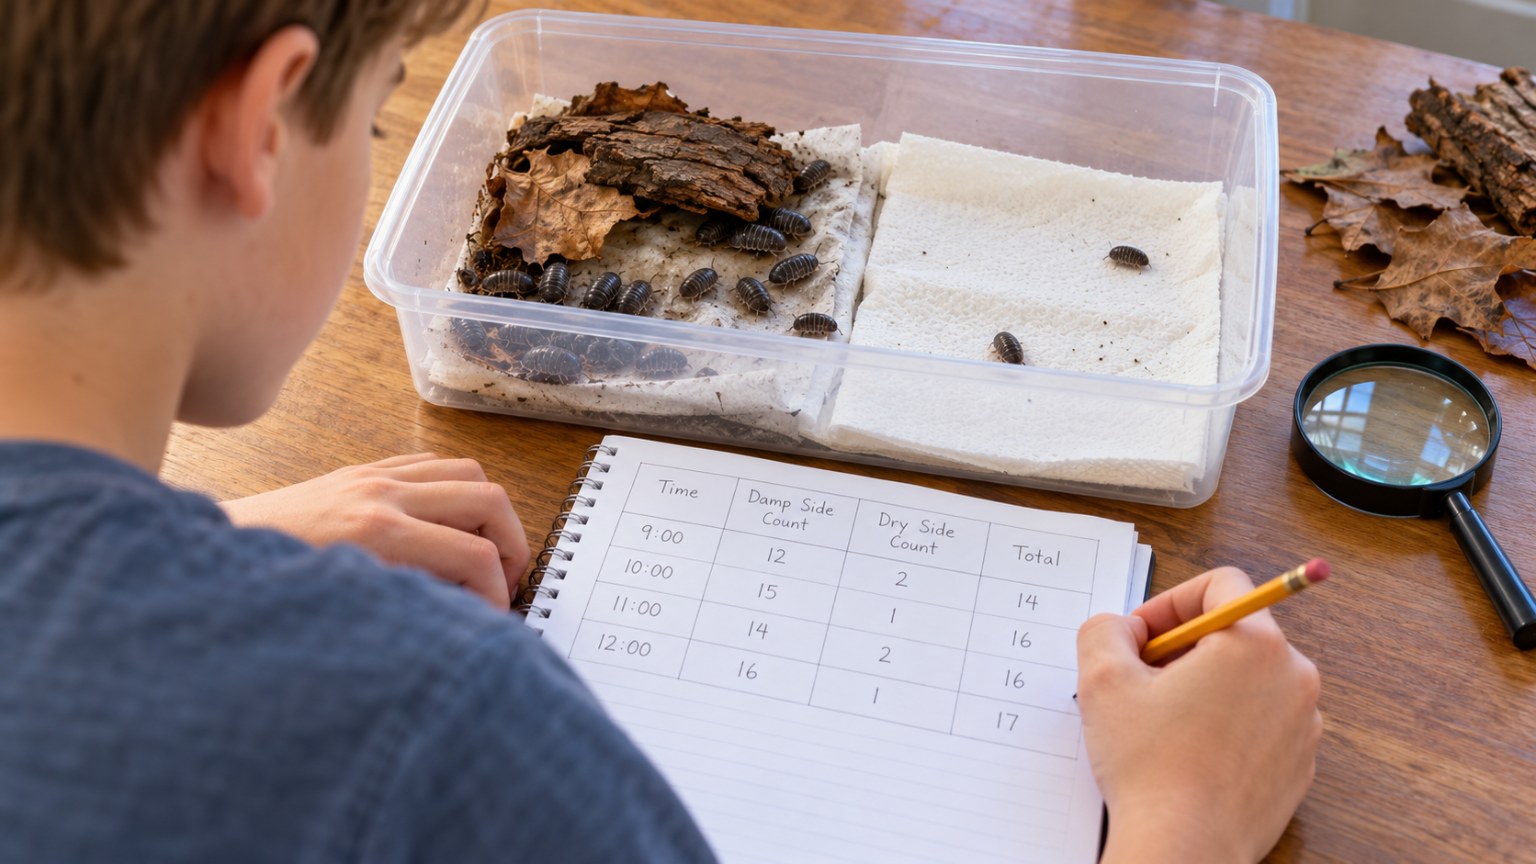
Roly-Poly Choice Chamber: Do Pill Bugs Prefer Damp or Dry?
Run a pill bug behavior experiment and summarize the data.
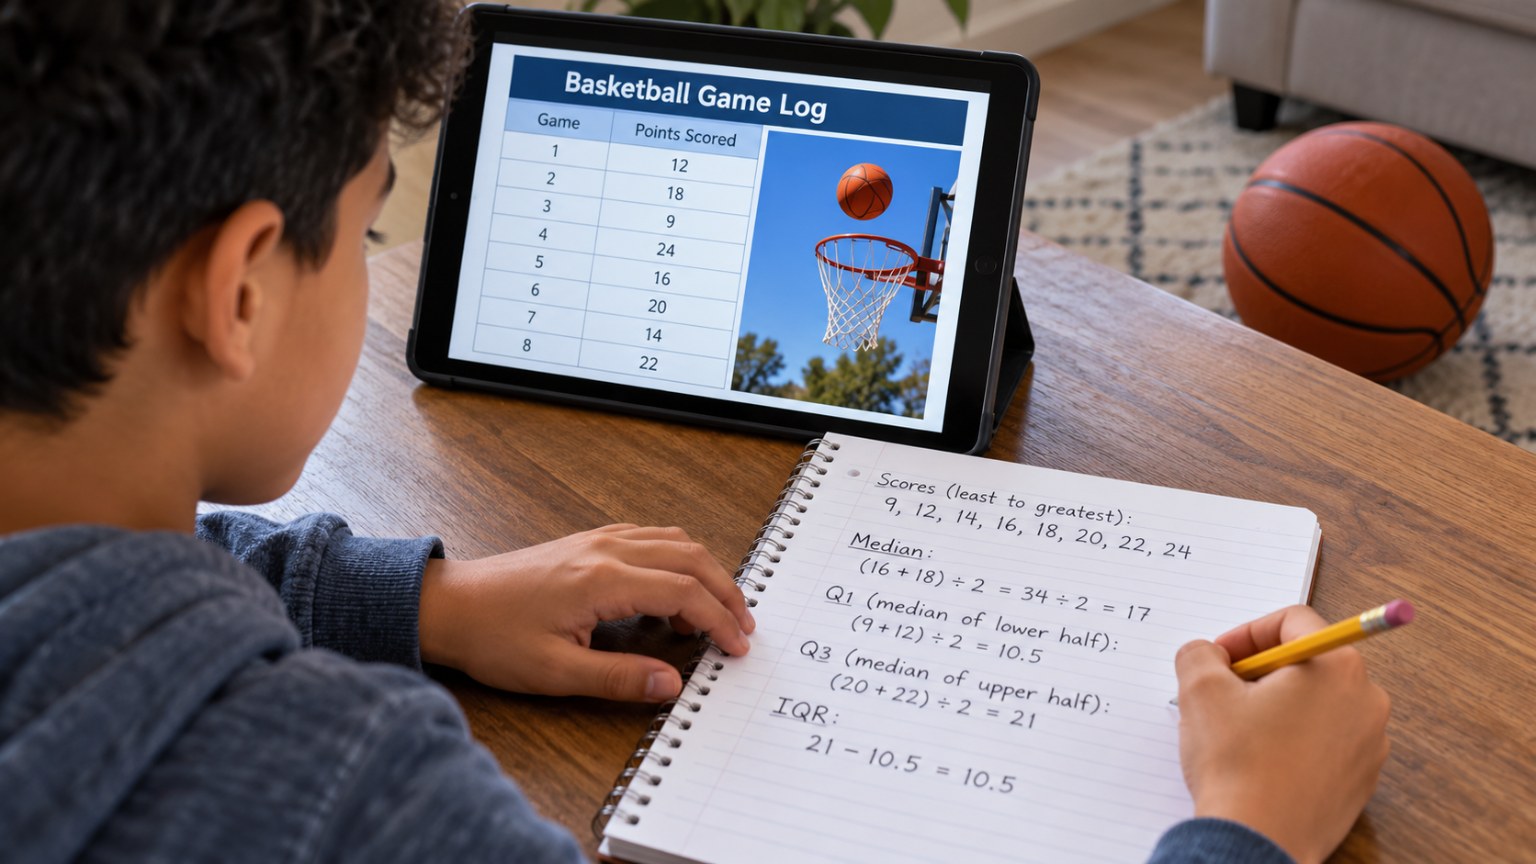
Points per Game Under the Microscope: Mean, Median and a 40-Point Night
Write a stats-backed scouting report on a real player.
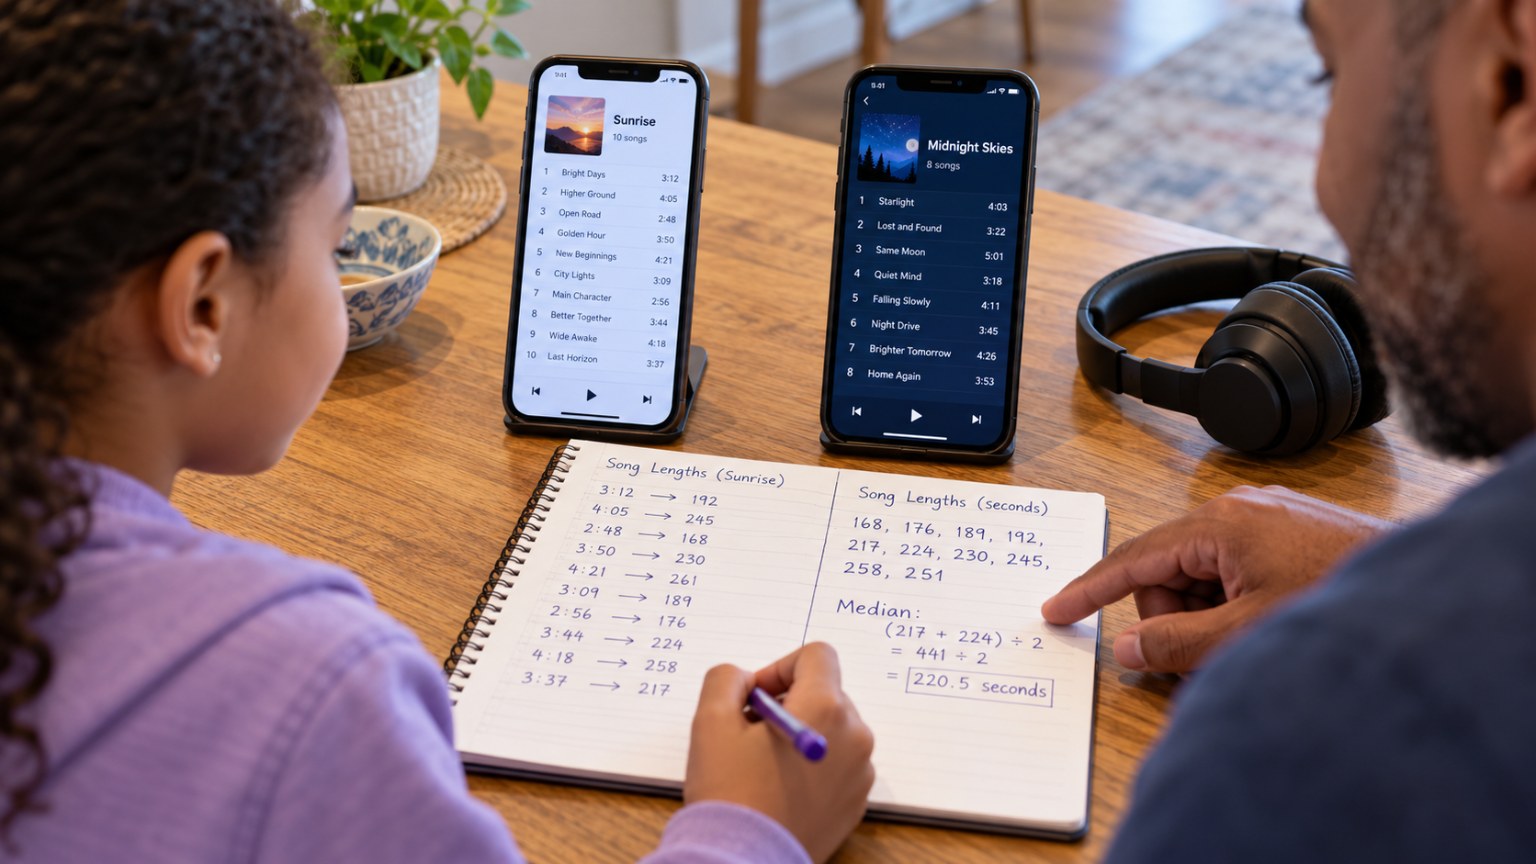
Then vs. Now: Are Songs Getting Shorter? Album Track Length Stats
Compare old and new album track lengths with statistics.
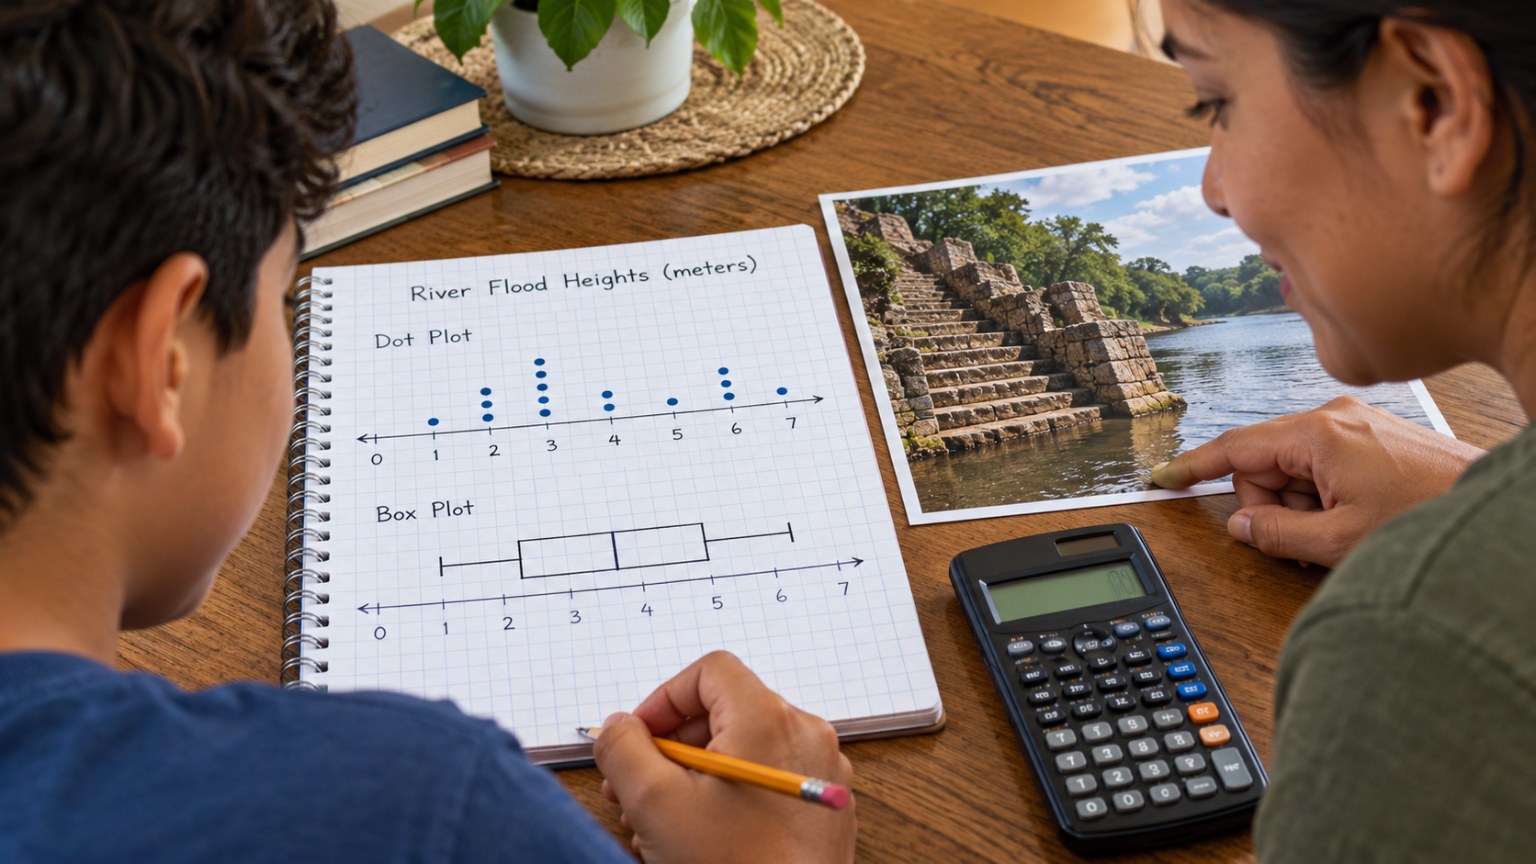
Nilometer Data: Ancient Egypt's Flood Statistics
Analyze Nile flood heights the way Egypt's officials did.
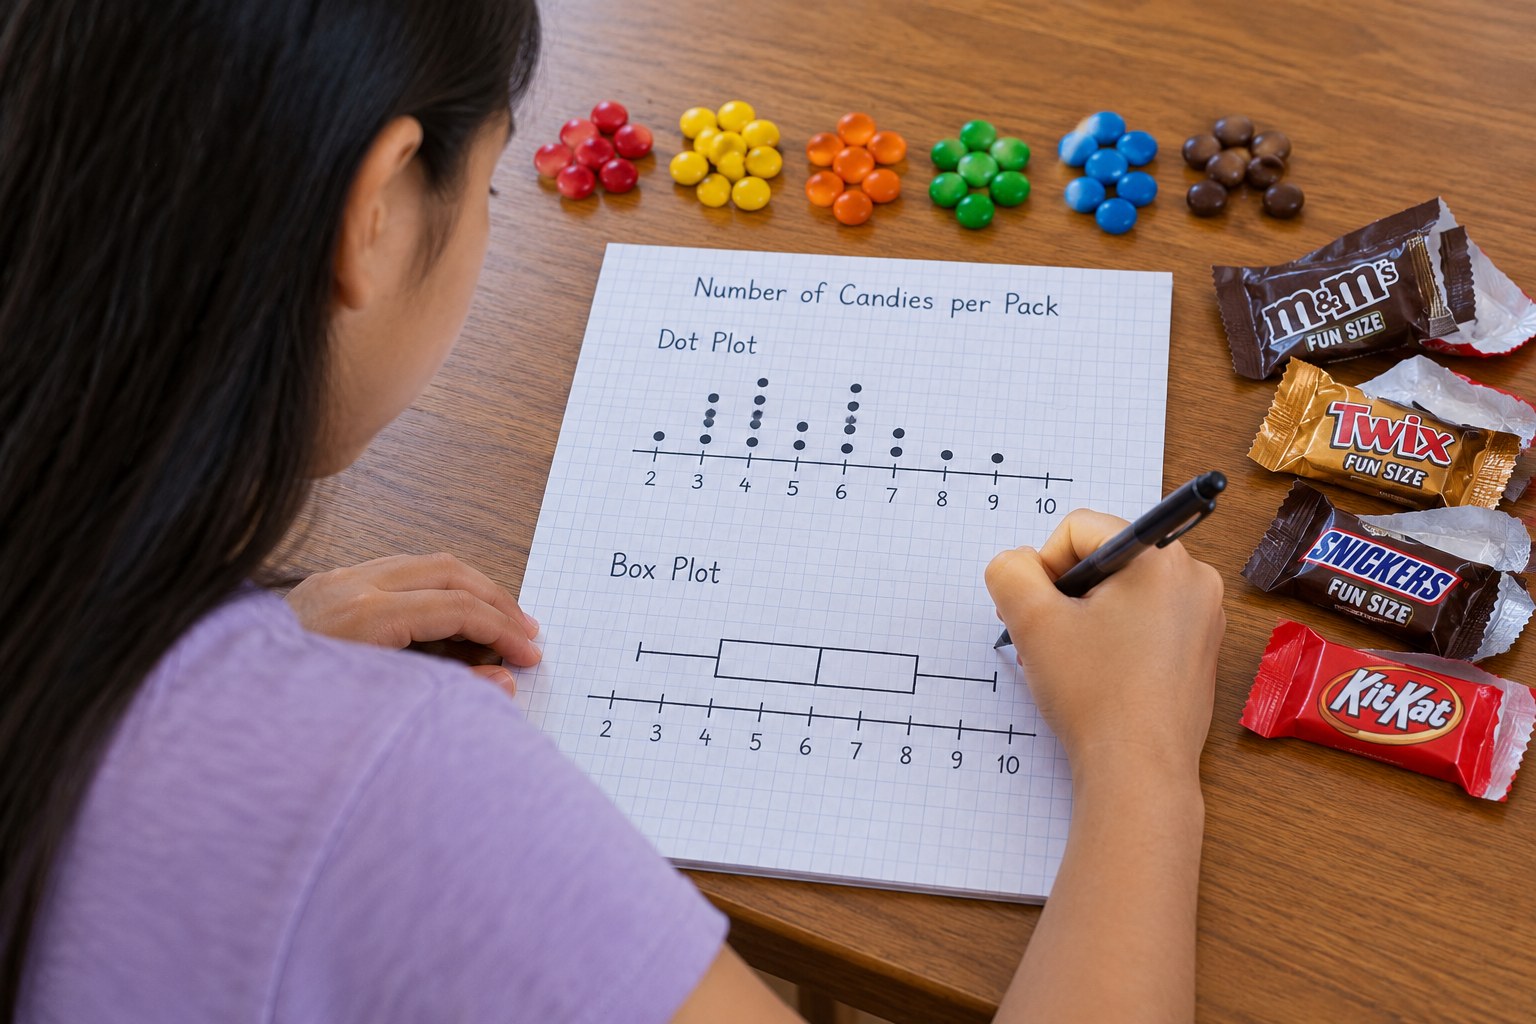
Fun-Size Bag Statistics: How Many Pieces Really Come in a Halloween Pack?
Count, plot and describe the pieces in fun-size packs.
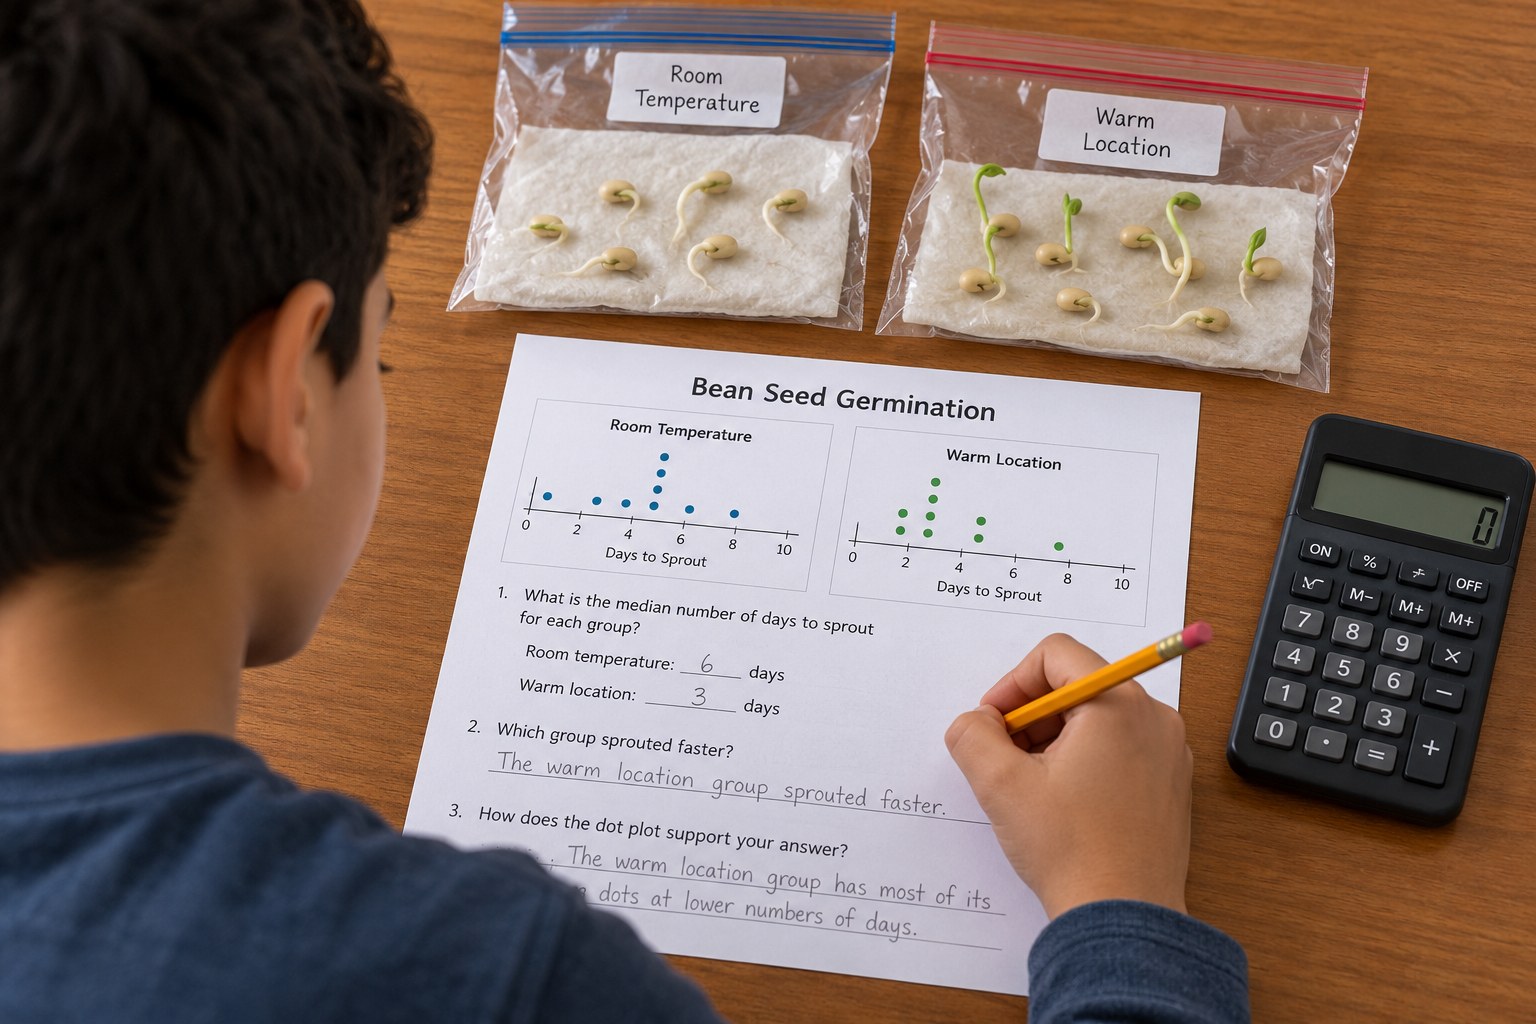
Gardening Seed Soak Experiment: Does Soaking Speed Germination? Mean and MAD
Test whether soaking seeds makes them sprout faster, with real stats.
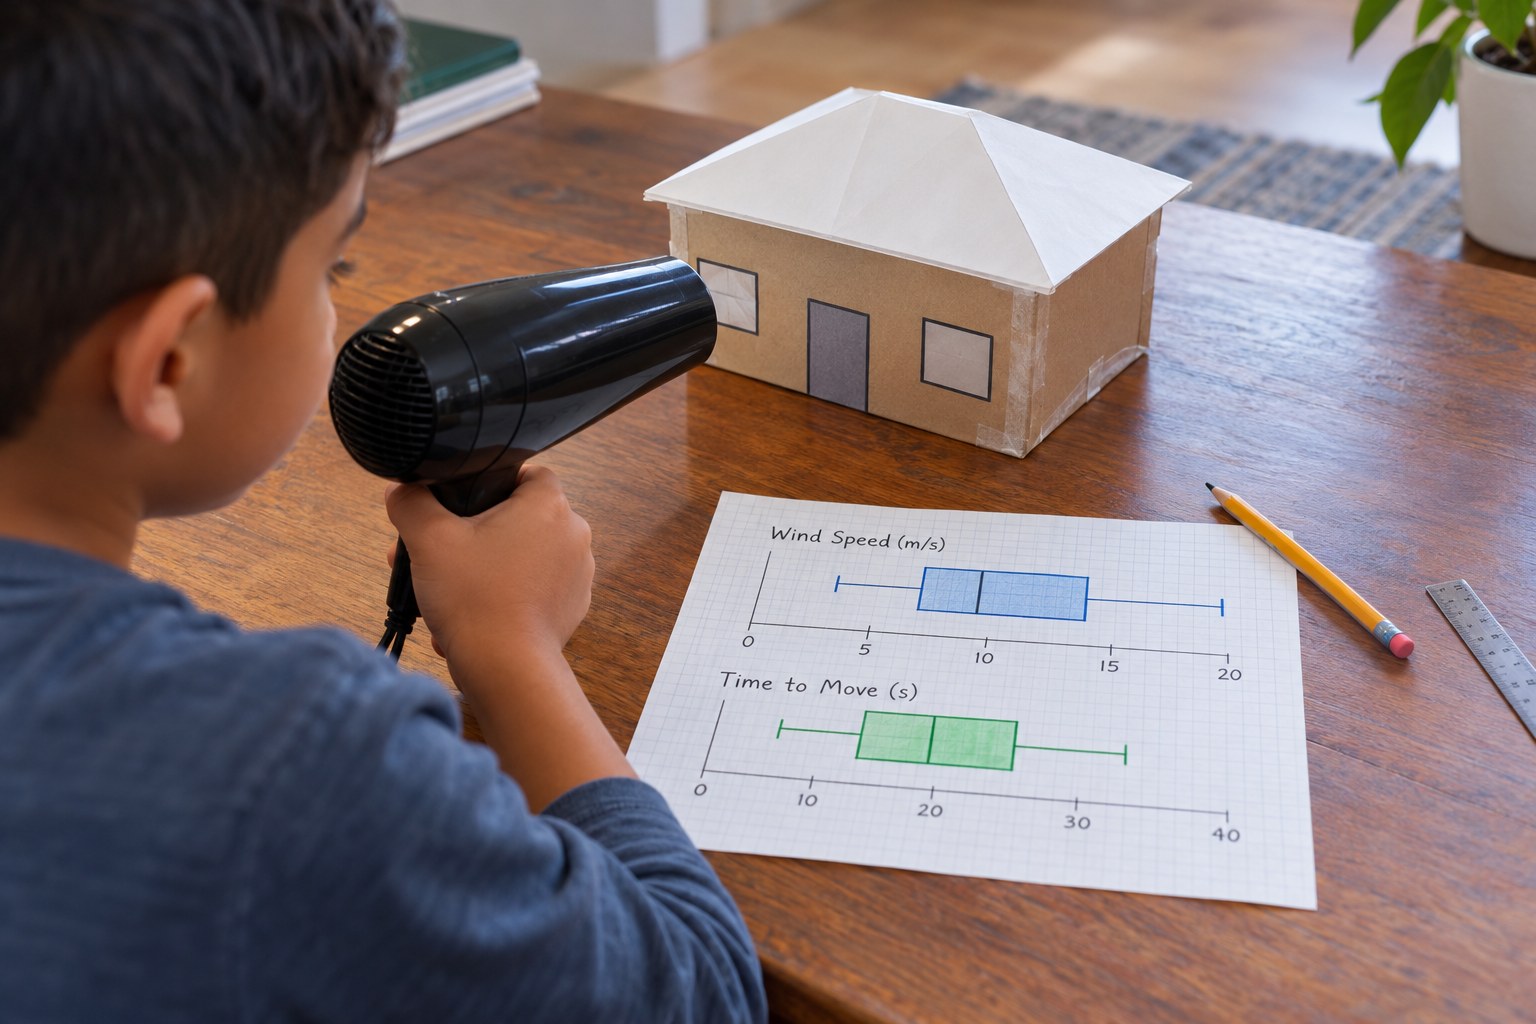
Hurricane Roof Uplift Test: Which Roof Shape Holds On in High Wind?
Test roof shapes in wind and compare them with statistics.
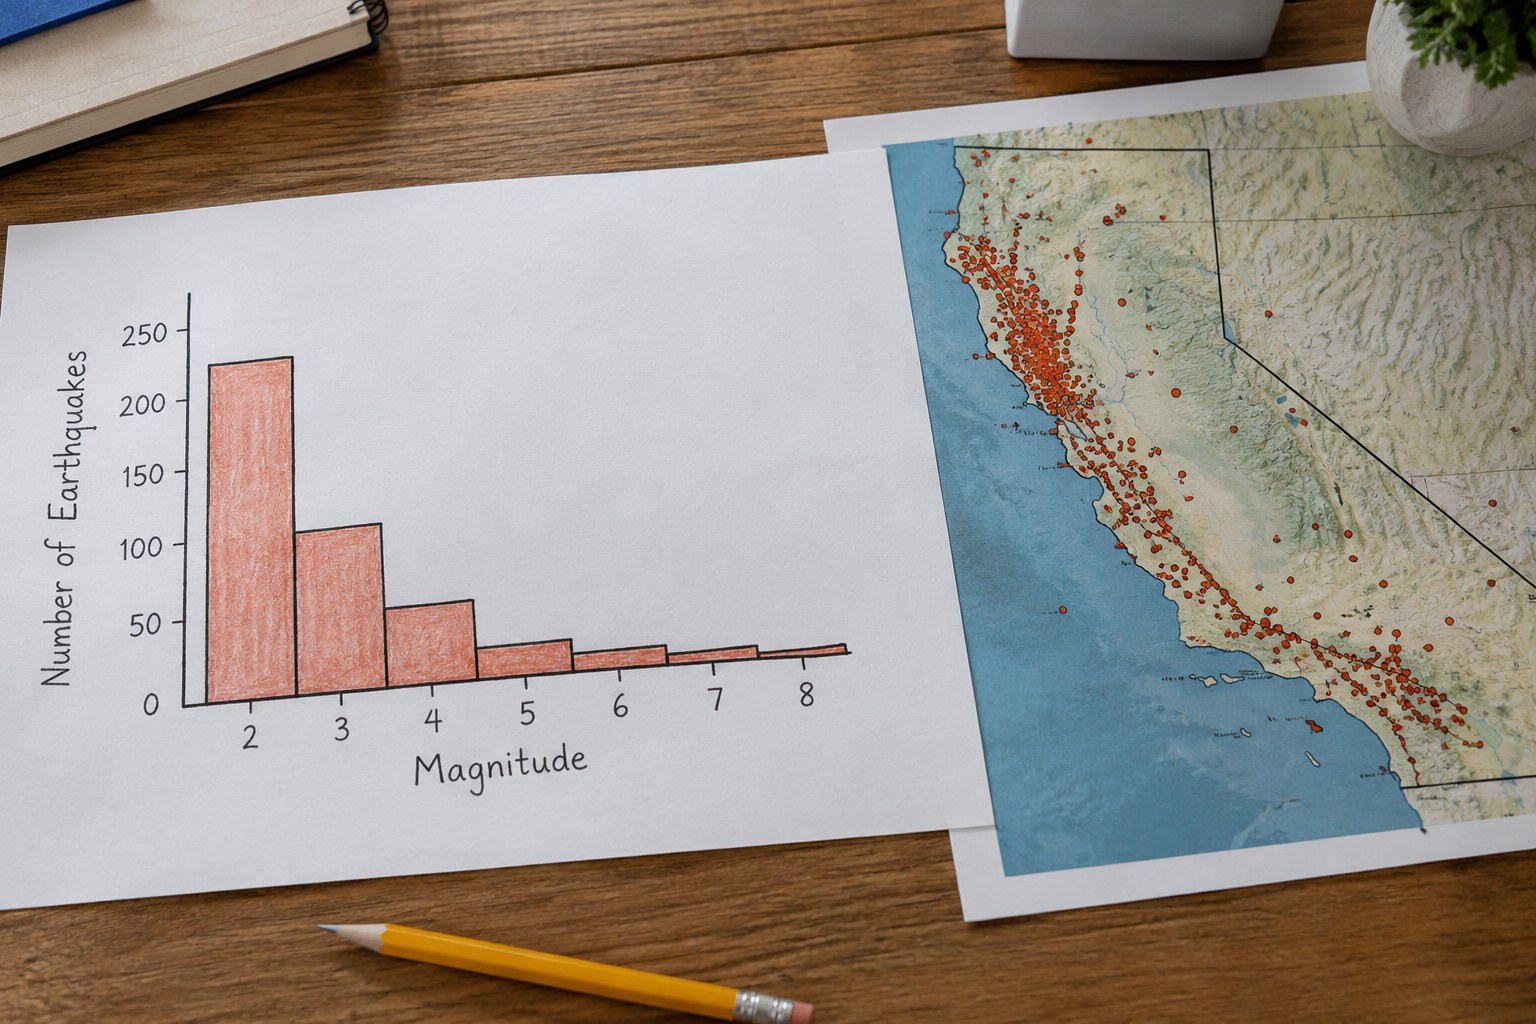
A Week of Earthquakes: Dot Plots, Histograms and Data Stories
Graph a week of earthquakes and find the pattern in the data.
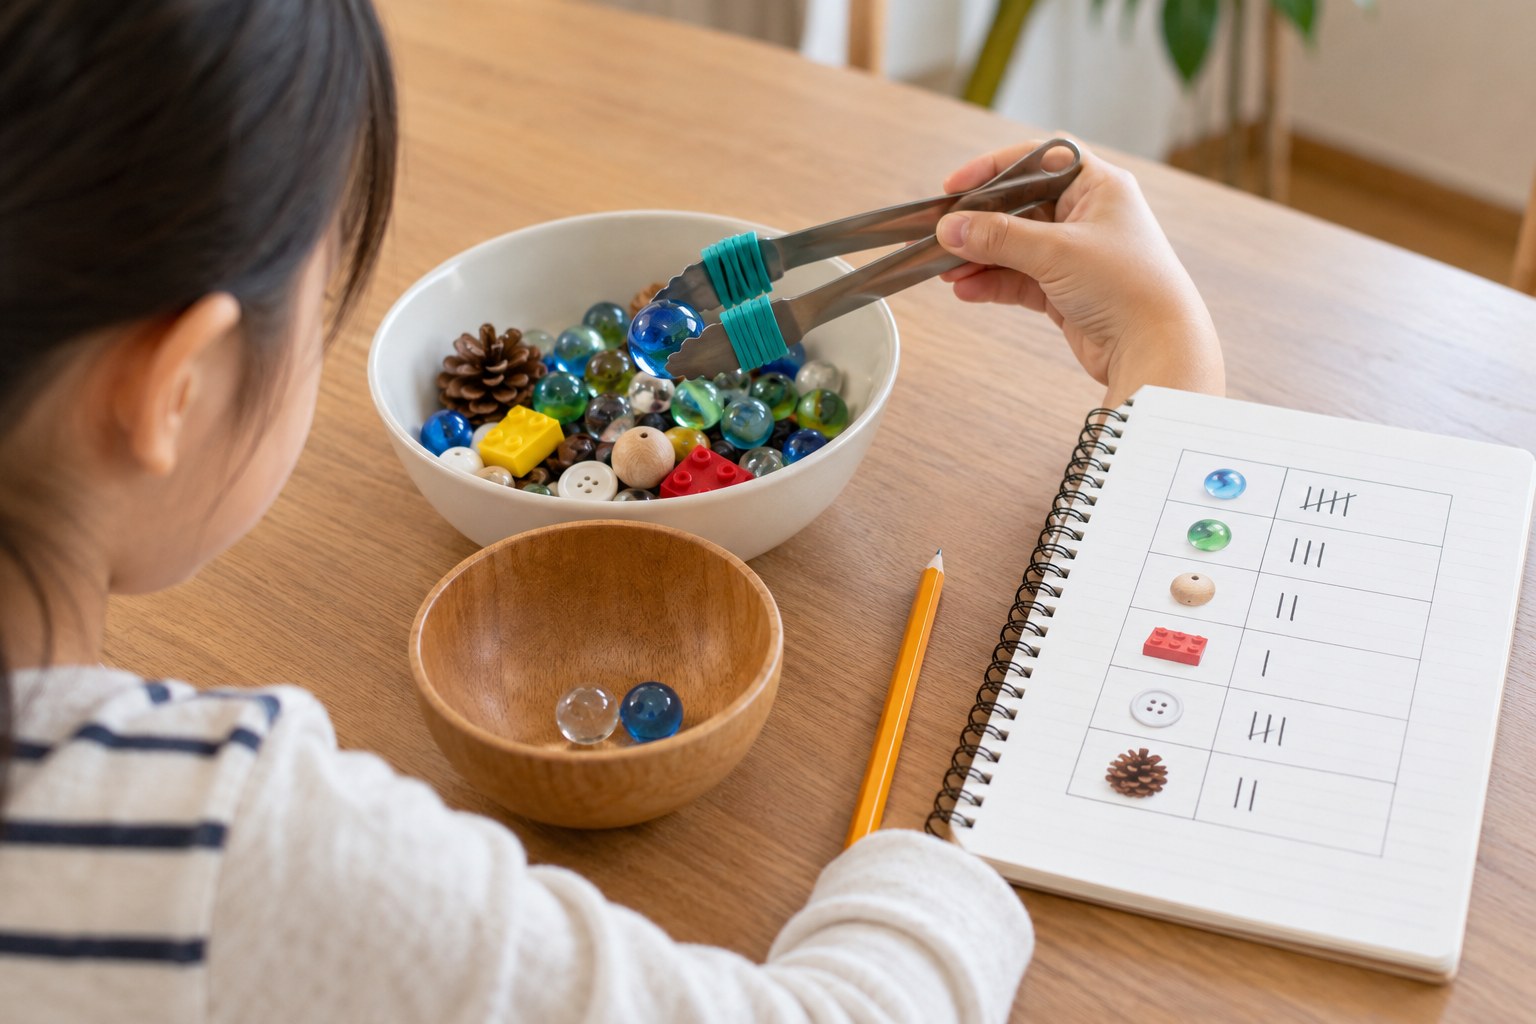
Robot Gripper Lab: Which Grip Surface Works Best?
Test robot gripper surfaces and analyze the data.
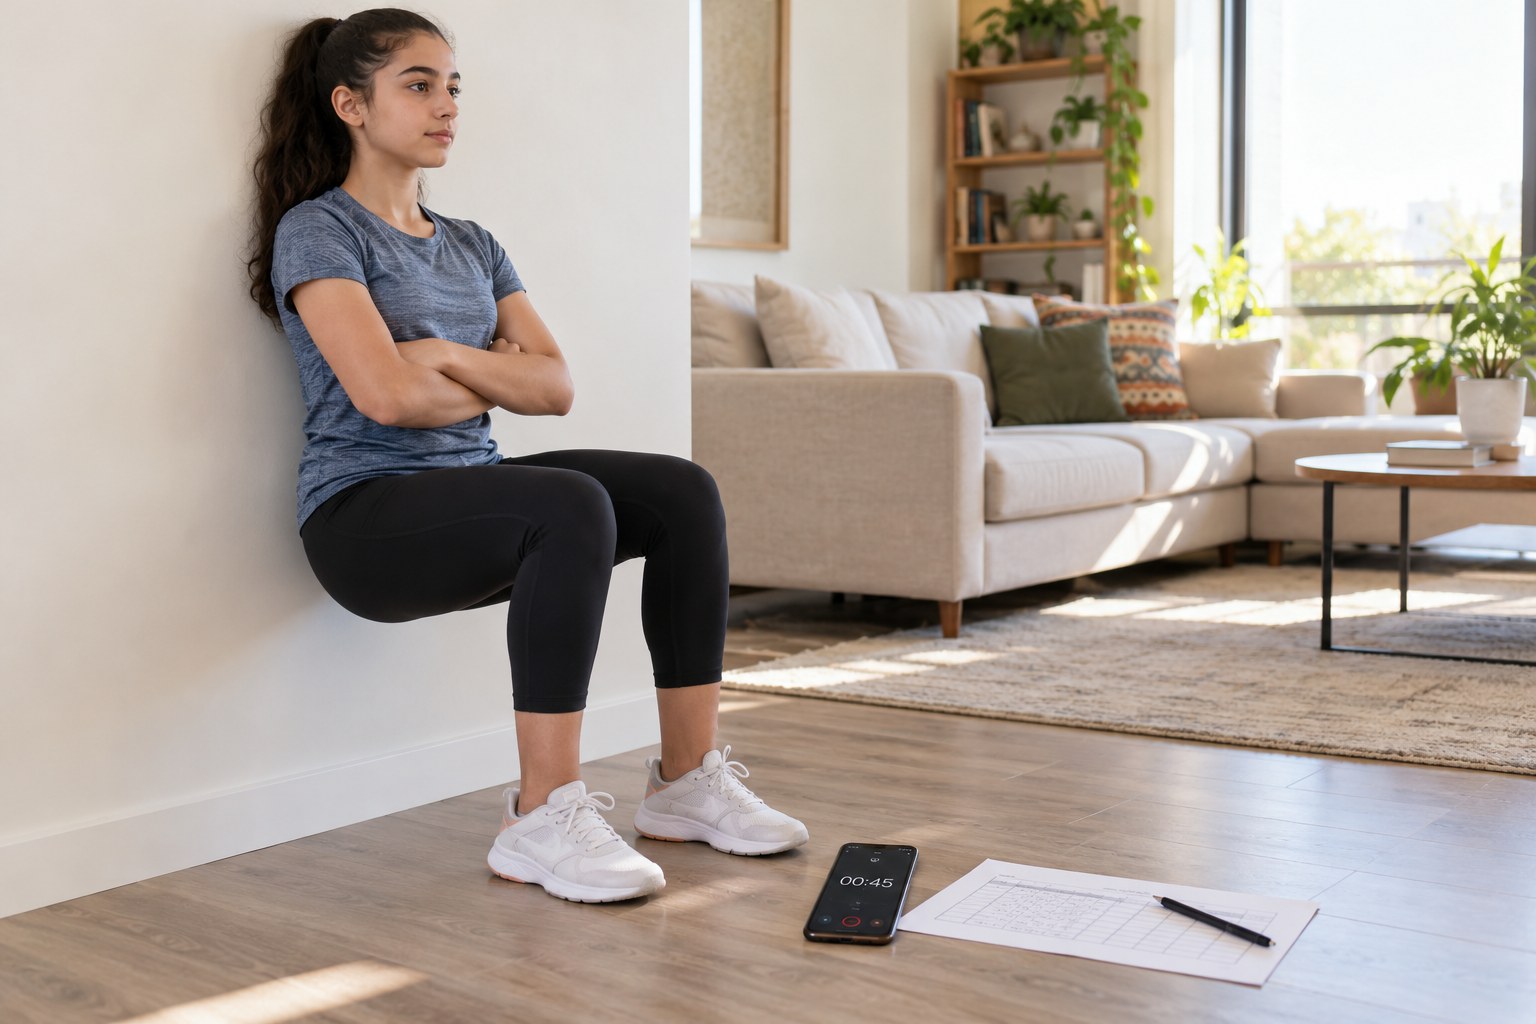
Hero Training Lab: Heart Rate Zones and Percent Change
Design a hero workout and use percents to analyze heart rate.
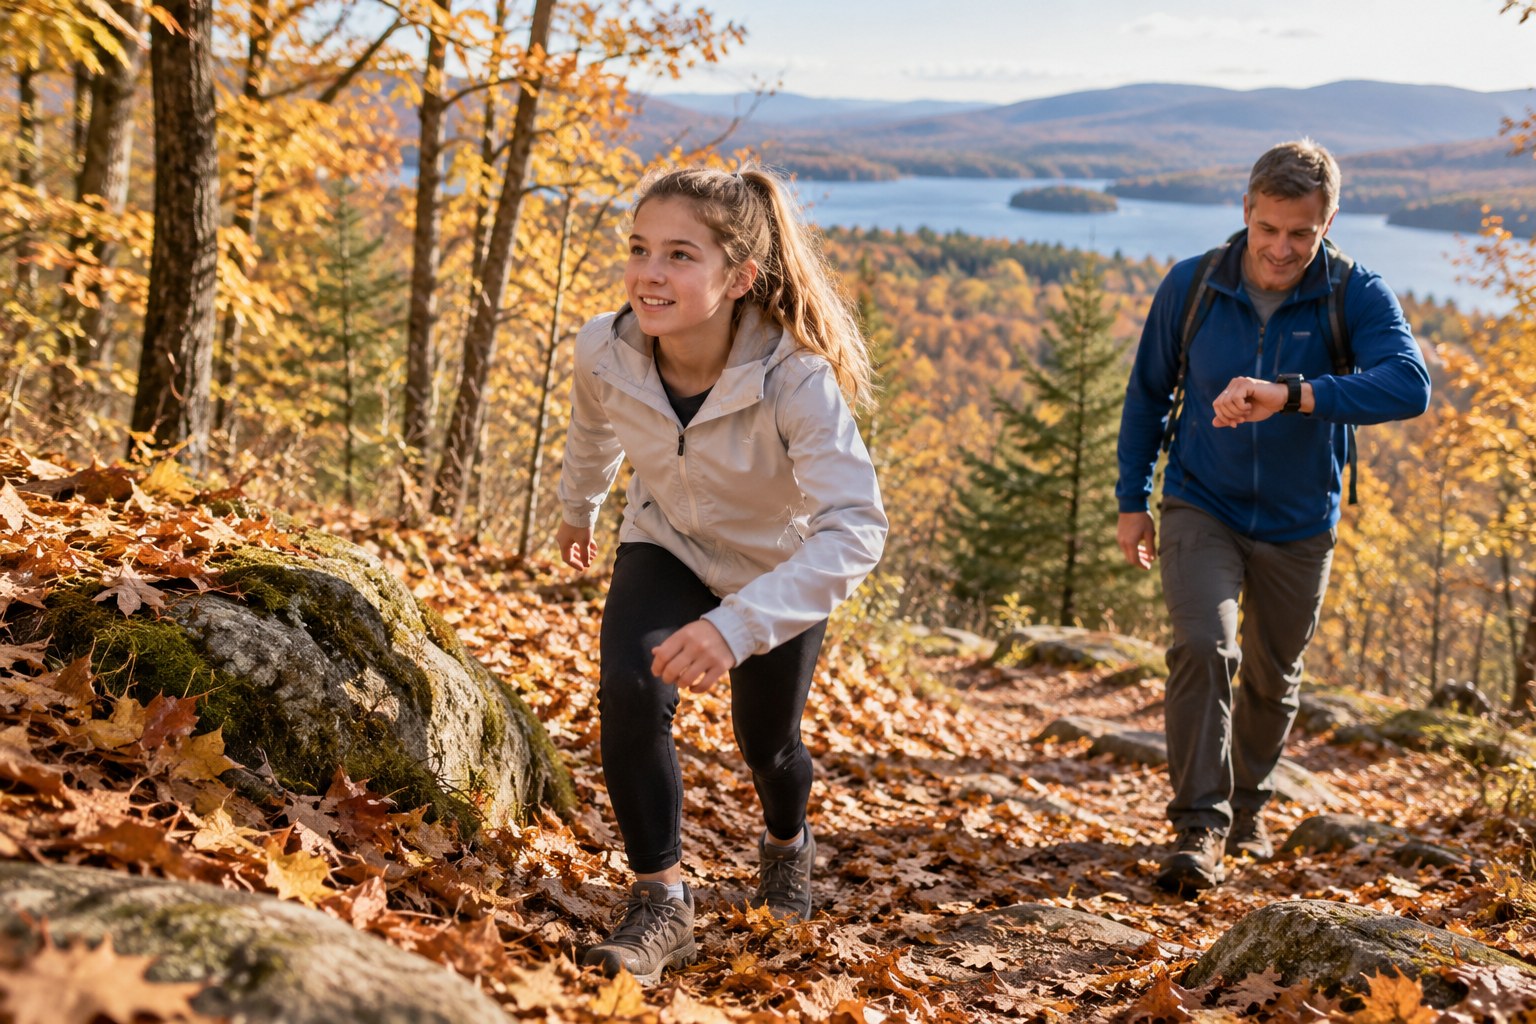
Cool-Air Hill Intervals: Heart Rate Data on a Fall Walk
Climb fall hills and analyze your heart-rate recovery data.
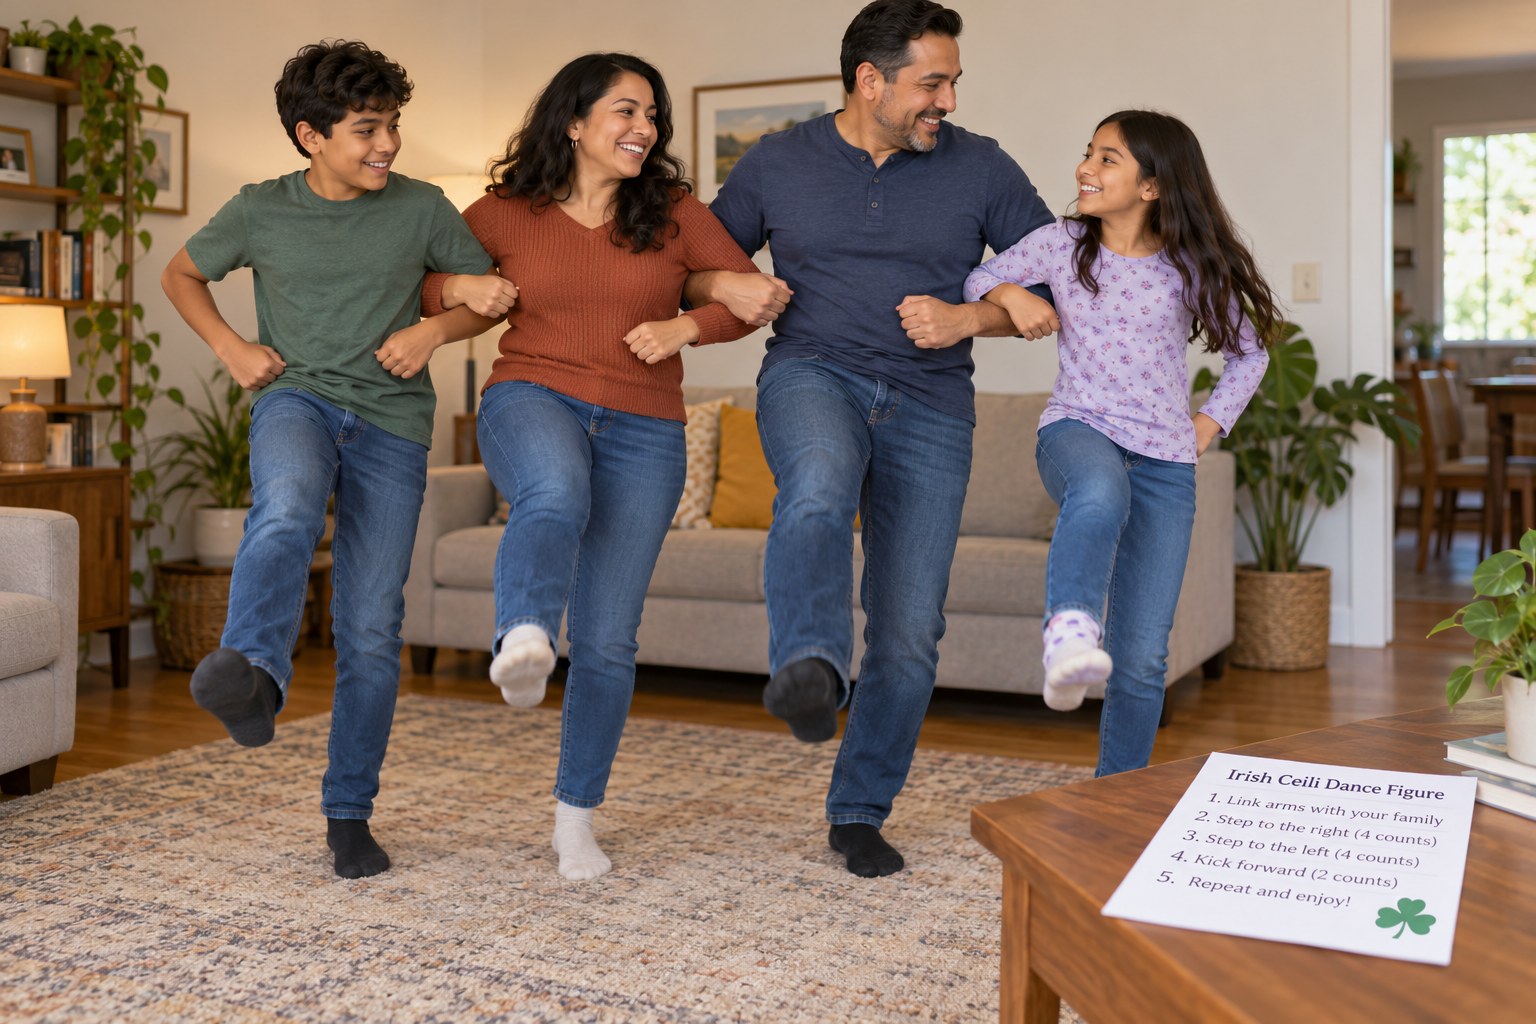
Ceili Dance Cardio: St. Patrick's Day Heart Rate Data
Dance ceili-style moves, collect heart rates and analyze the data.
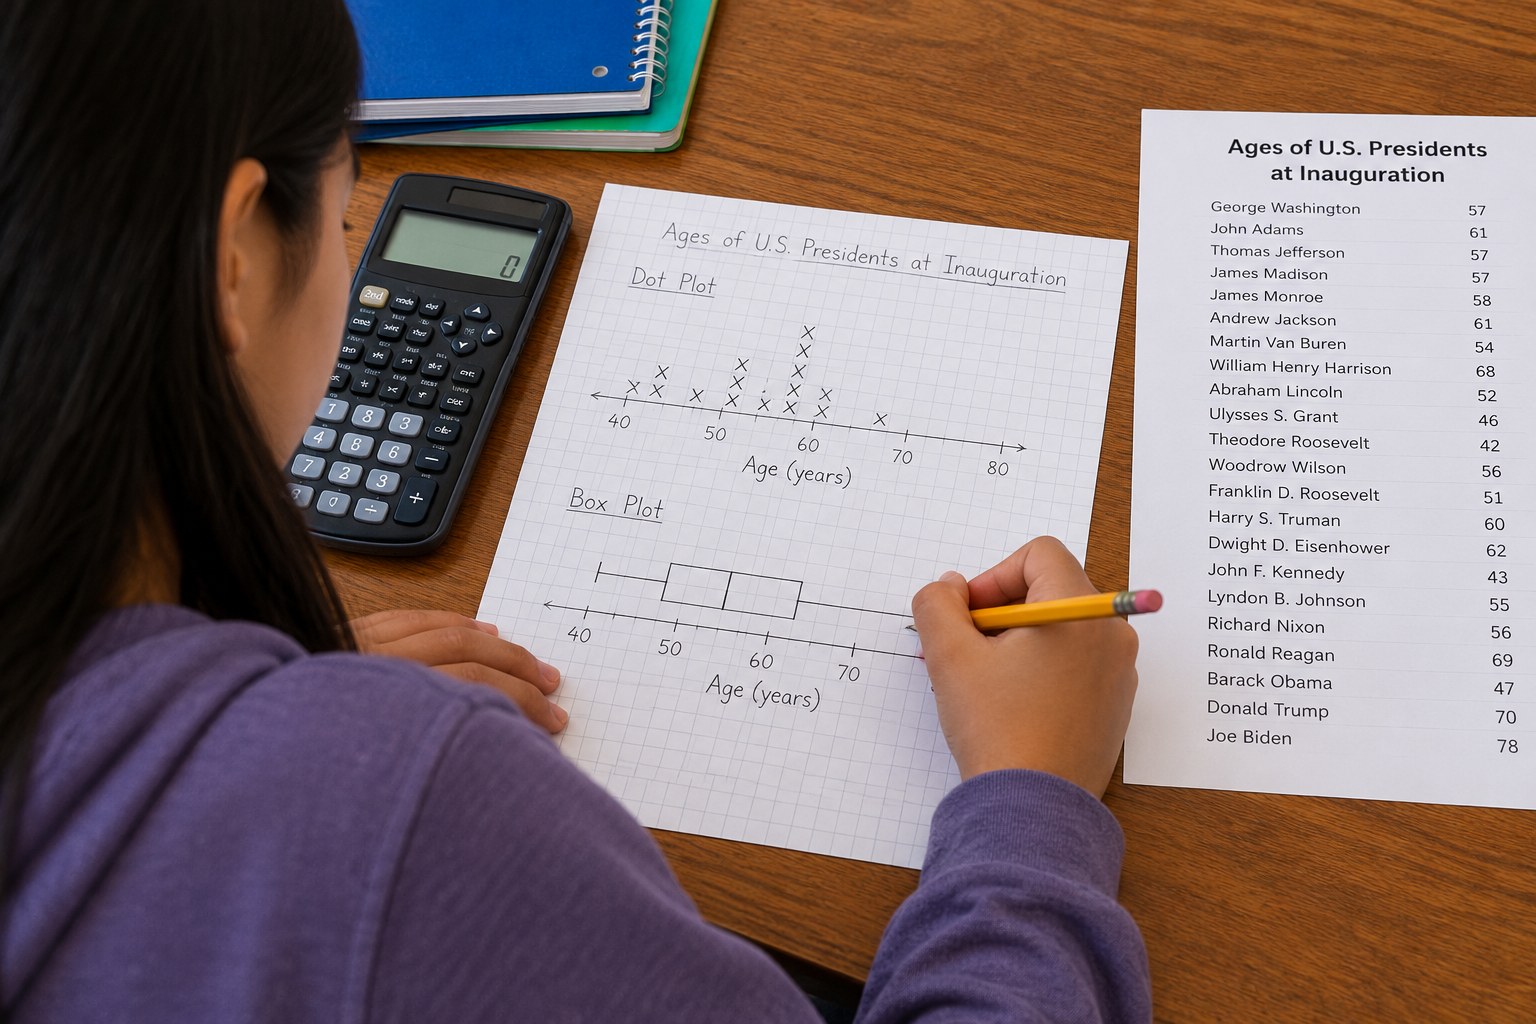
Presidents' Day Data: Inauguration Ages of the First 16 Presidents
Plot and summarize the ages of presidents from Washington to Lincoln.
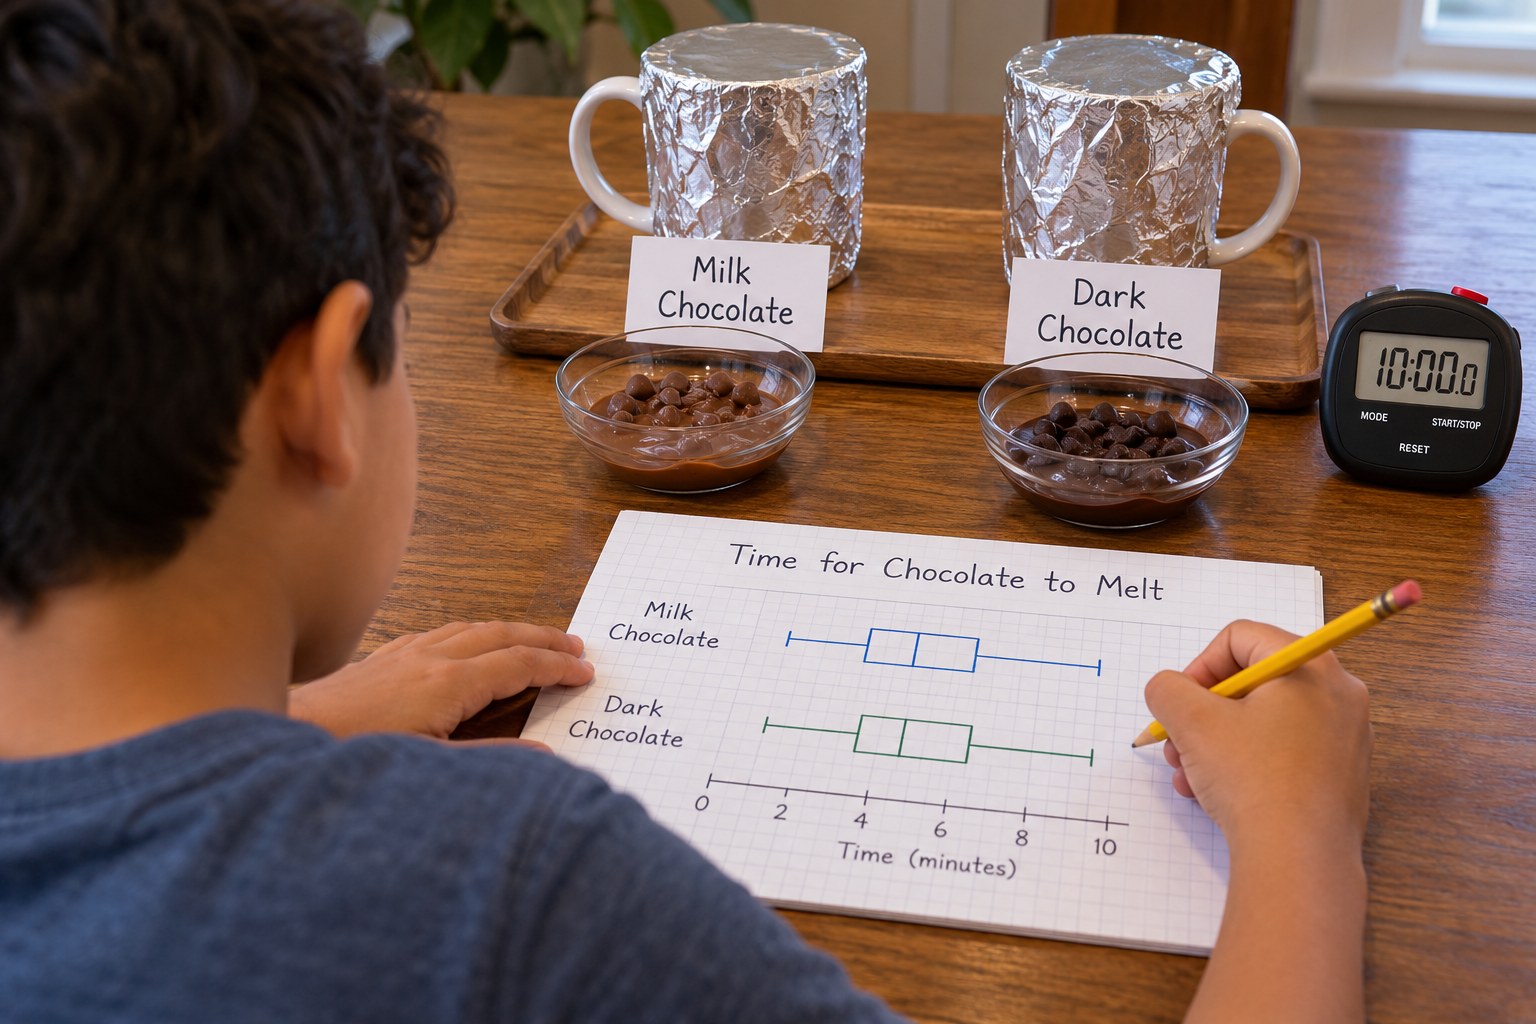
Valentine Chocolate Melt Test: Data and Variability
Time melting chocolate and compare the data with box plots.
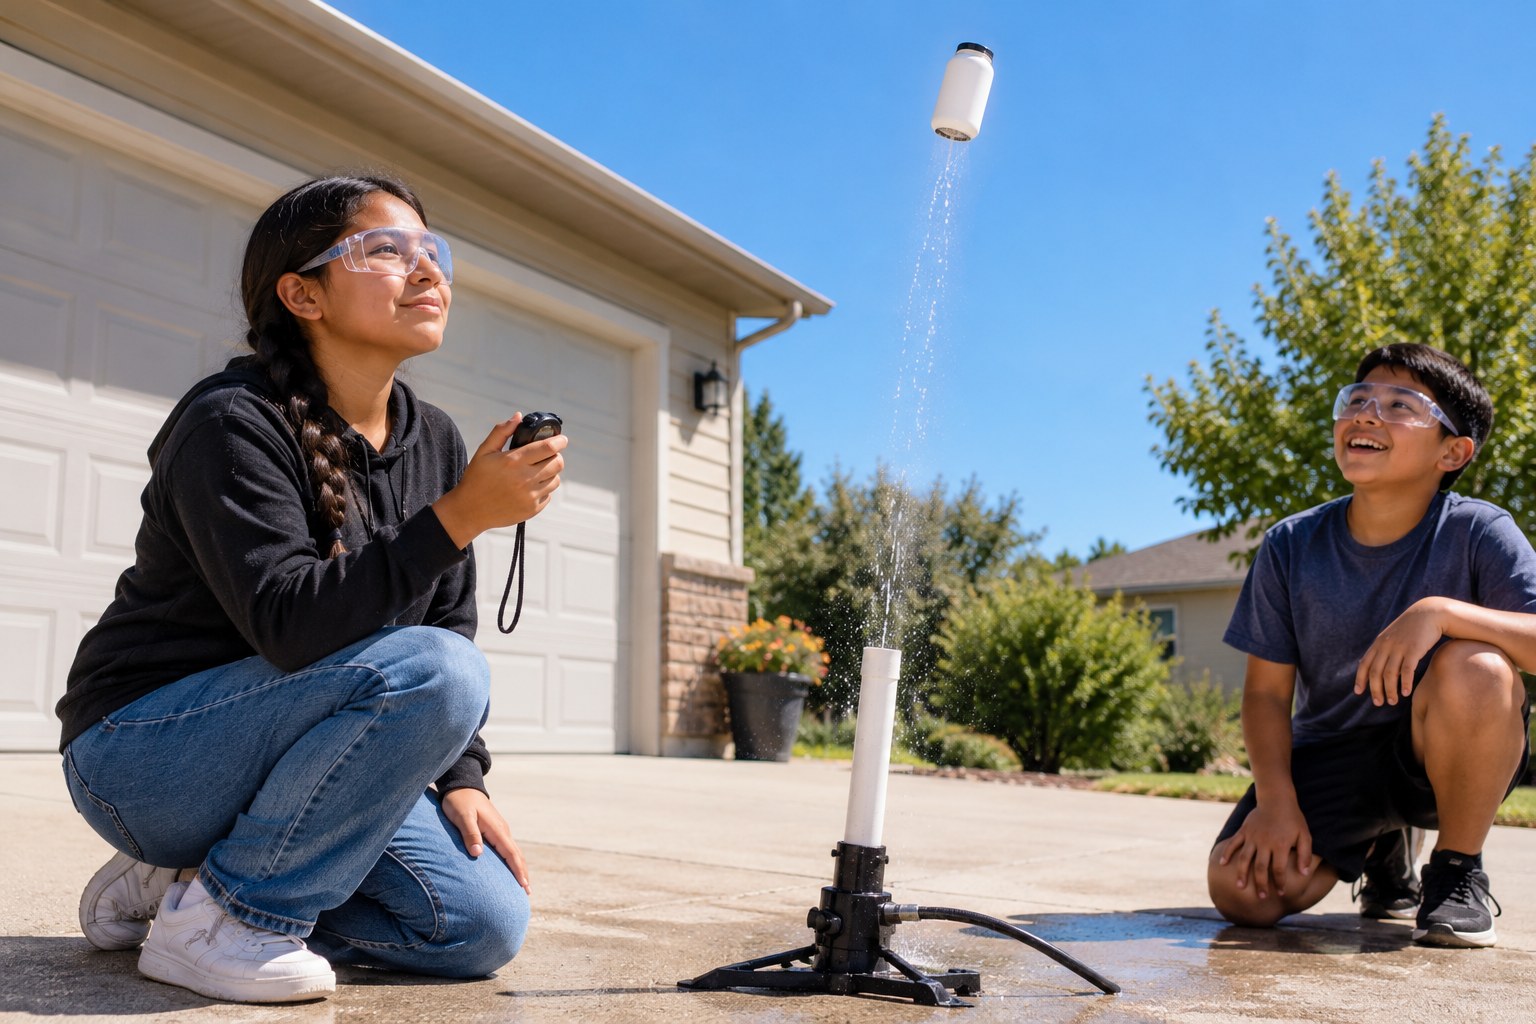
New Year's Countdown Popper Rockets: Timing Gas Pressure
Time fizzing popper rockets and use data to launch on the countdown.
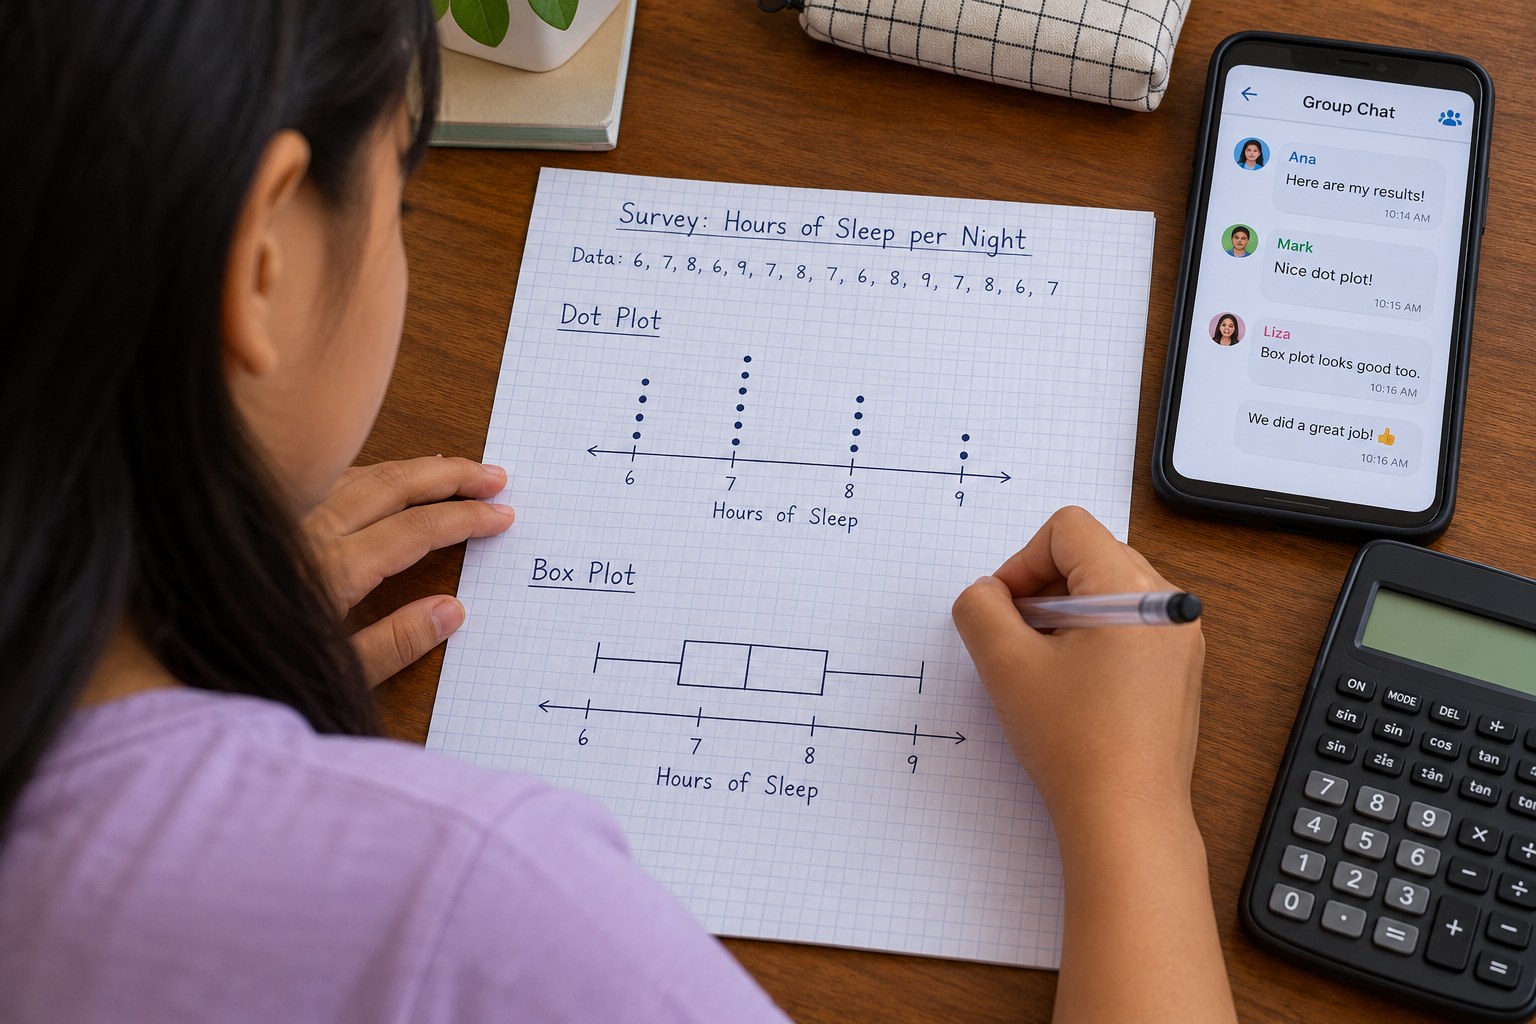
New Year's Resolution Survey: Dot Plots, Median and IQR
Survey people about New Year's resolutions and analyze the data.
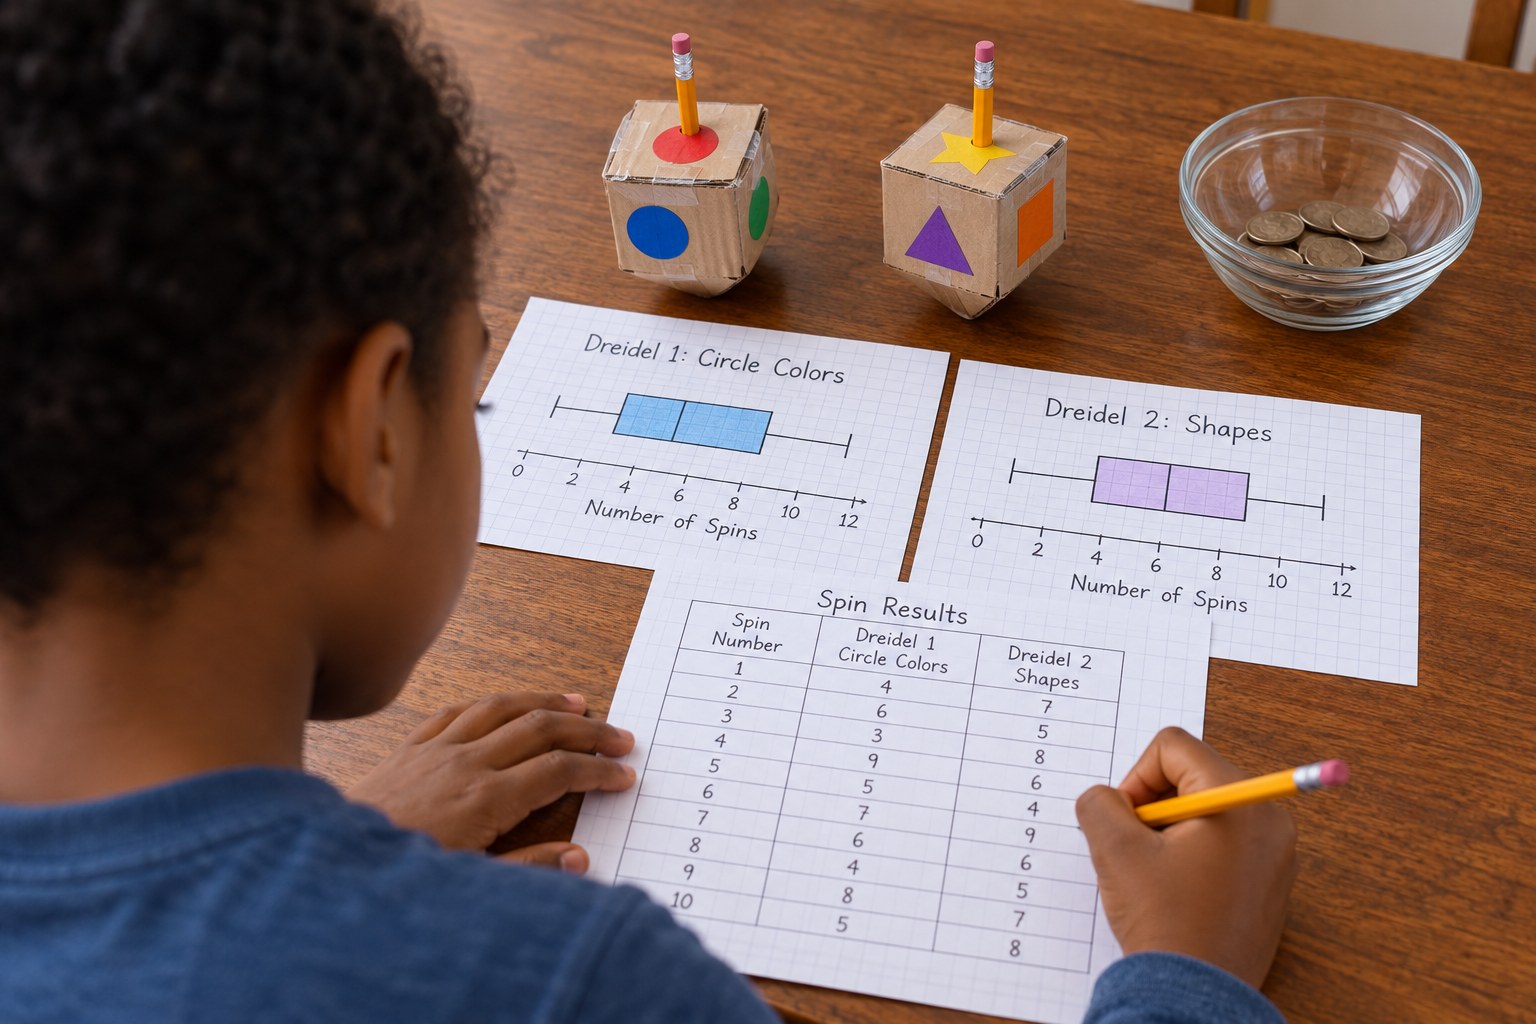
Dreidel Design Lab: Spin Time Data
Engineer two dreidels and compare spin times with box plots.
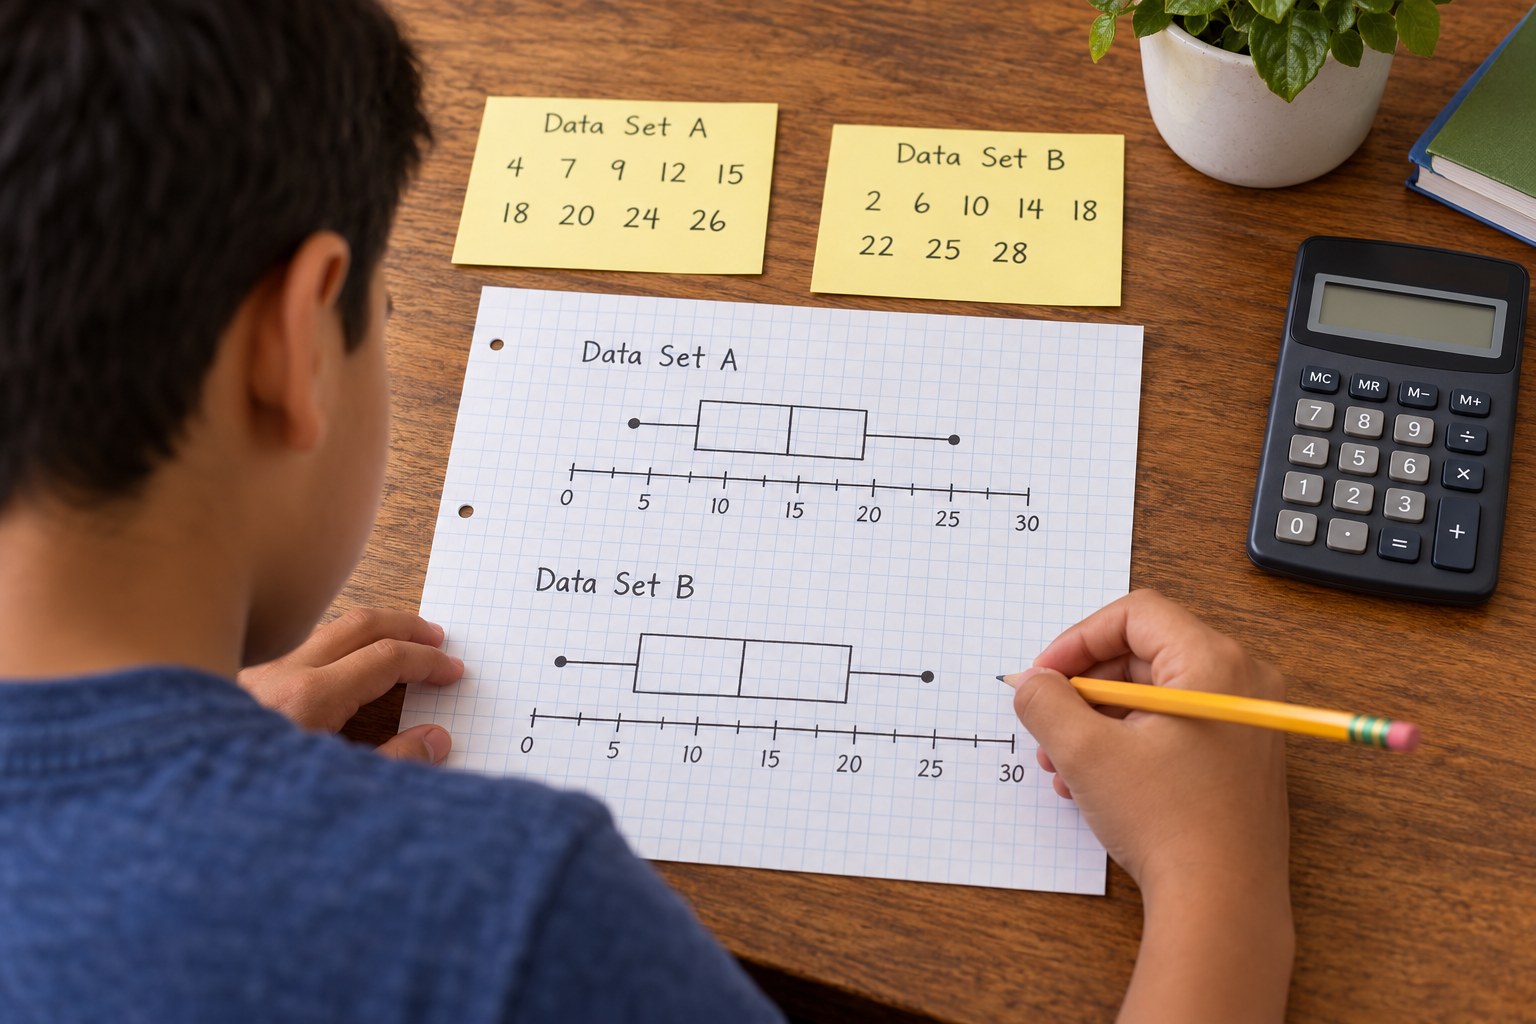
Veterans Day Data: Box Plots of Ages and Years of Service
Build box plots and choose the best measure of center.
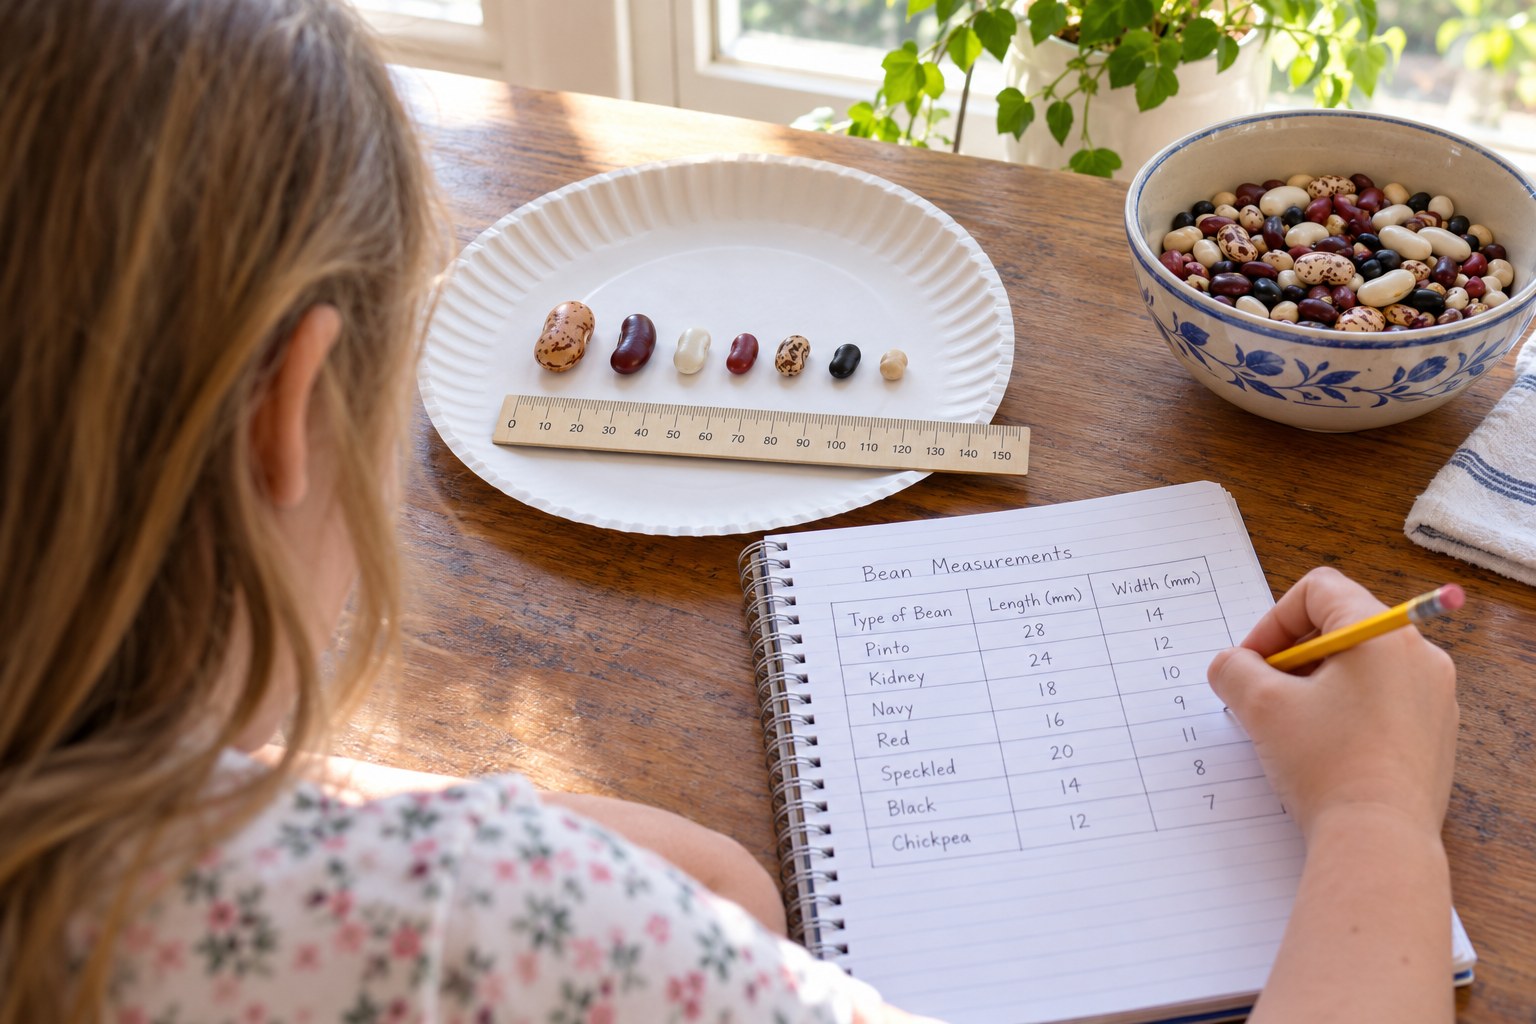
Bean Bag Variation: Measuring and Reporting on 25 Seeds
Measure 25 beans and write a real data report.
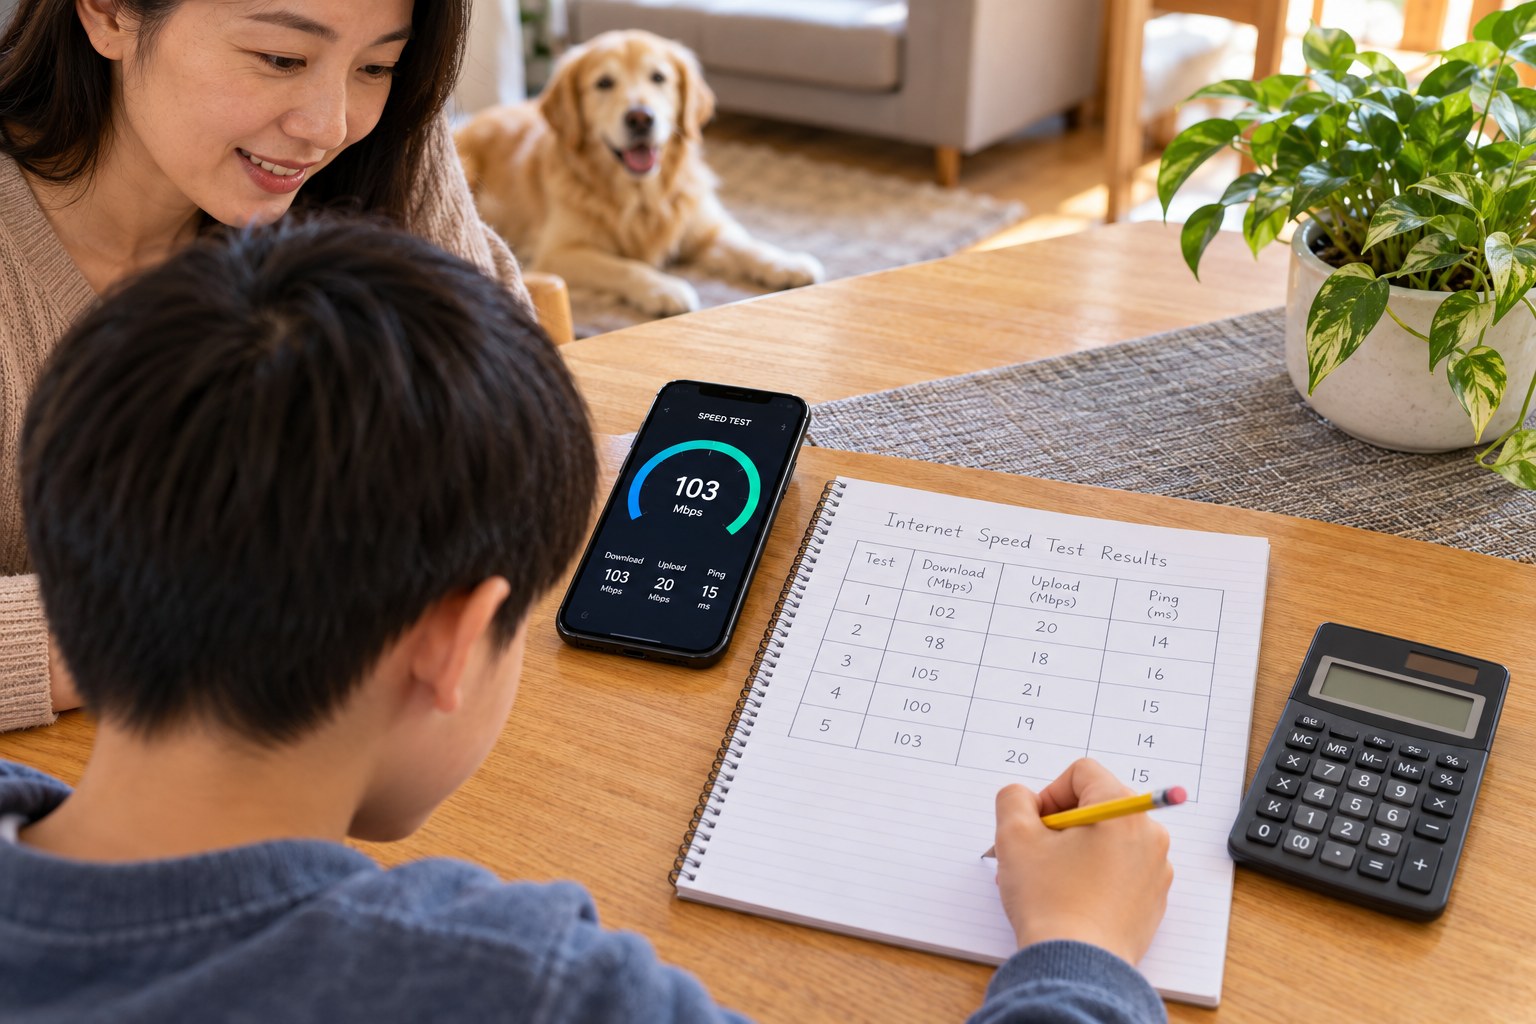
Wi-Fi Speed Map: Mean, Median and the Spread of Your Home Internet
Speed-test every room, then summarize the data with statistics.
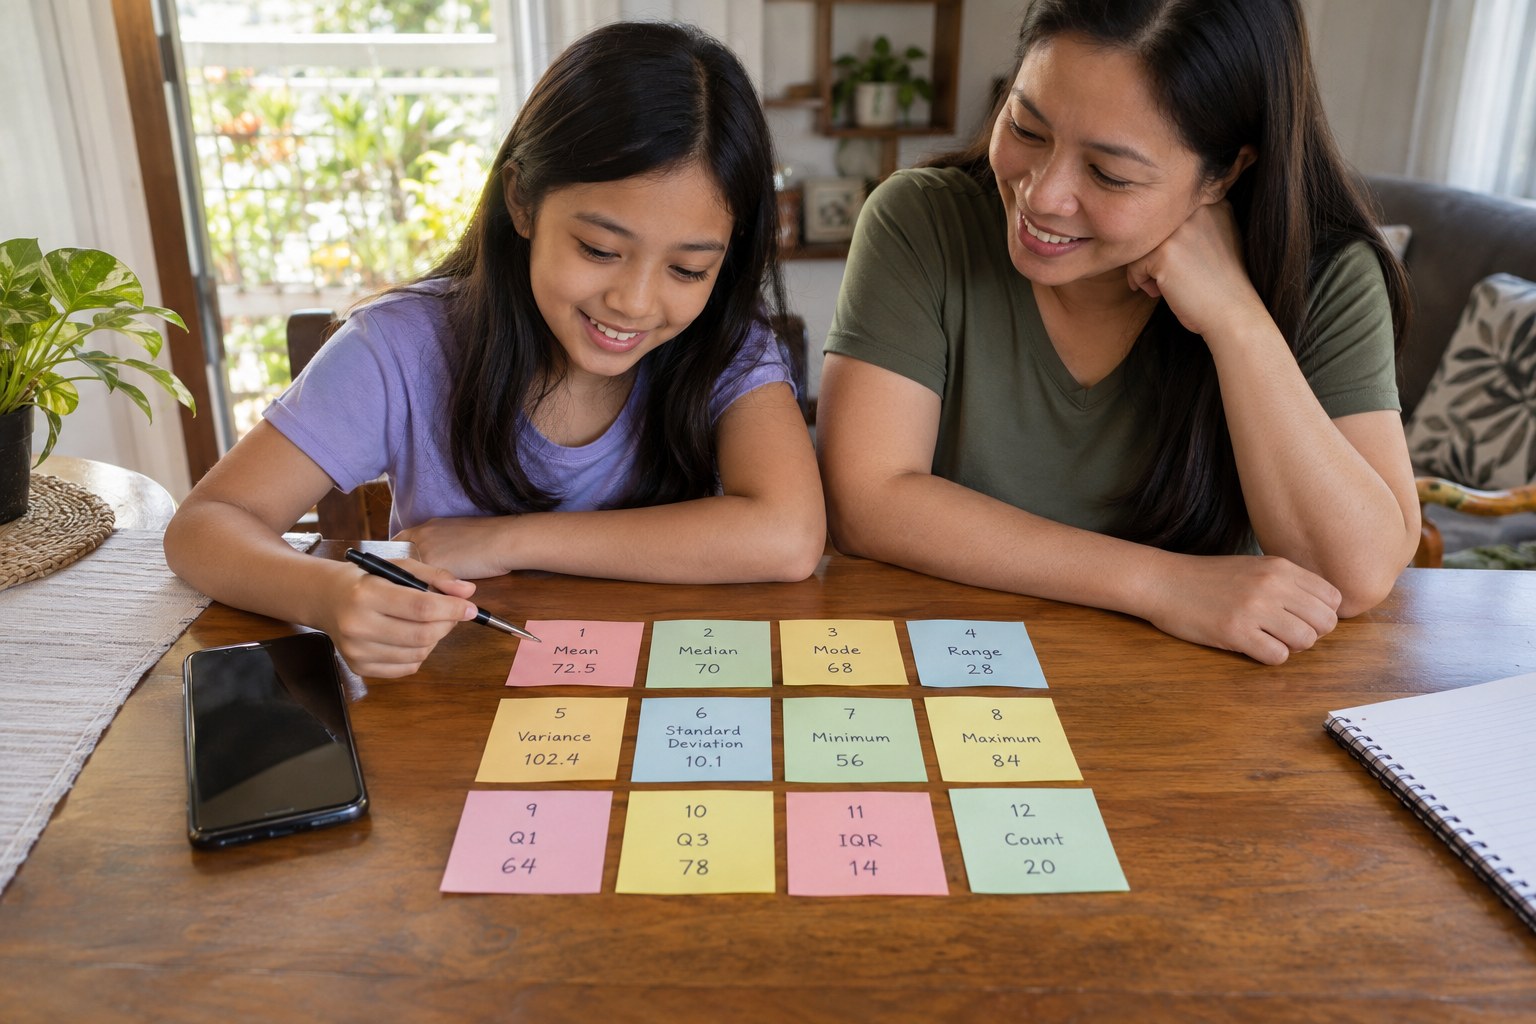
Camera Roll Census: Summarize 12 Days of Family Photos
Count daily photos and summarize them with statistics.
See all grade 6 standards with lesson plans
Make a lesson like this in a minute
Pick a topic, grade, group size and length. Resource Portal AI writes the objectives, materials, steps and pictures.
Sign up FREEFree forever · no credit card needed. Members get all 5,100+ lessons for $14.99/month, with the first 7 days free.