Summer Heat Island Test: Ice Melt Times on Five Surfaces
Overview
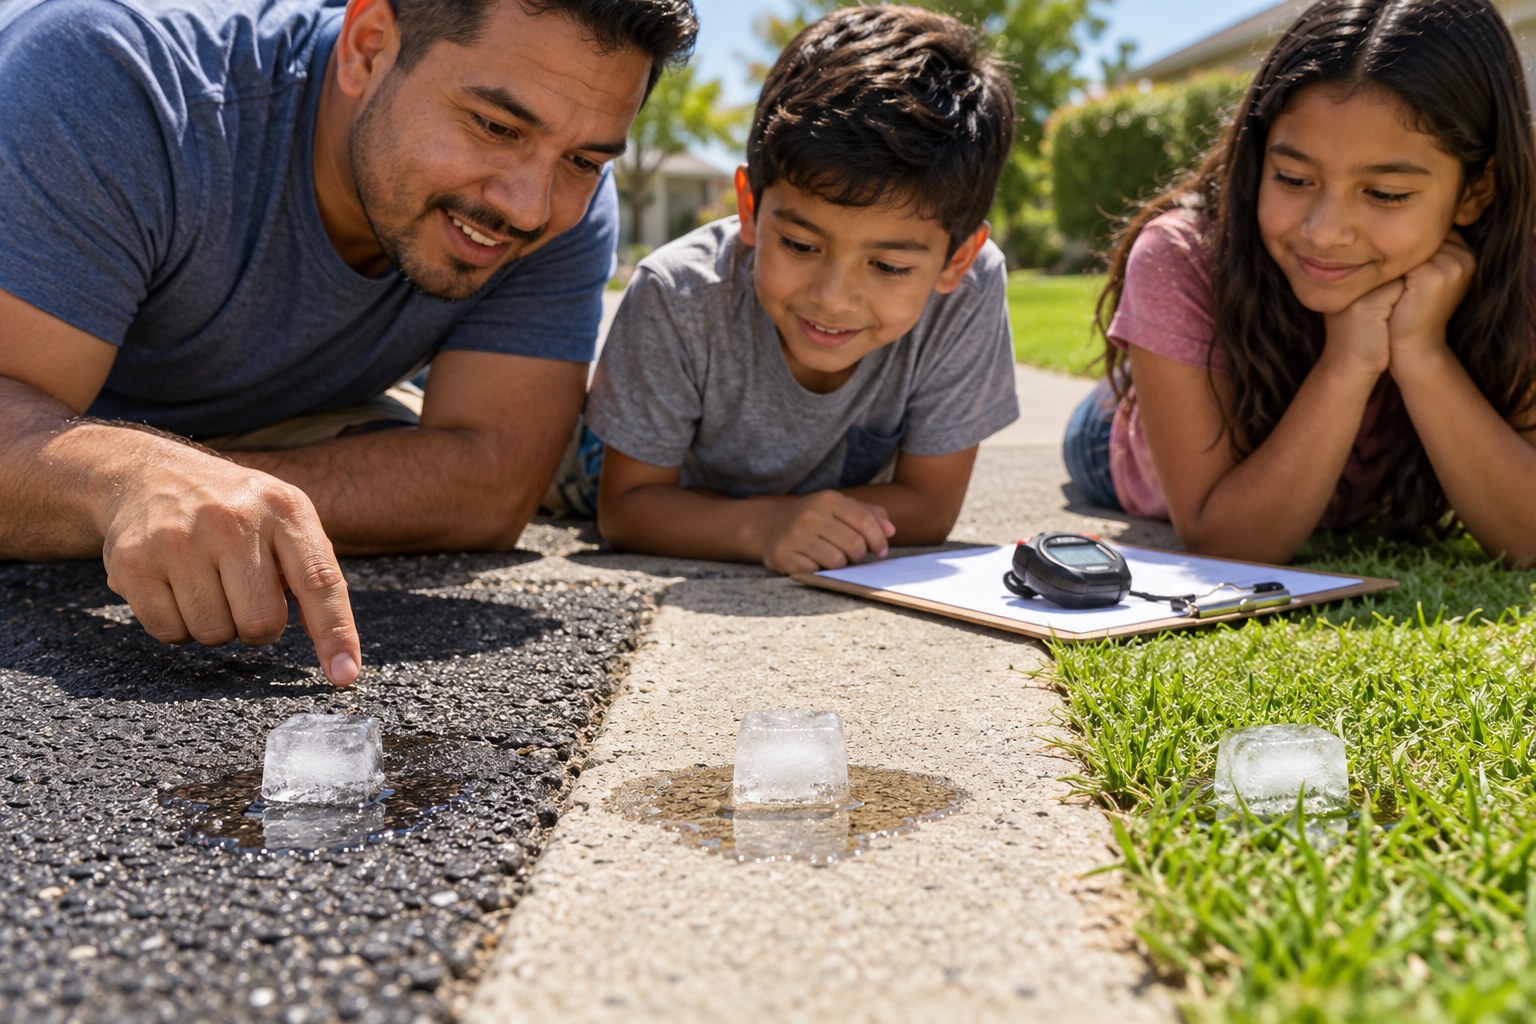
Time ice melting on five surfaces and compare with mean and MAD.
Description
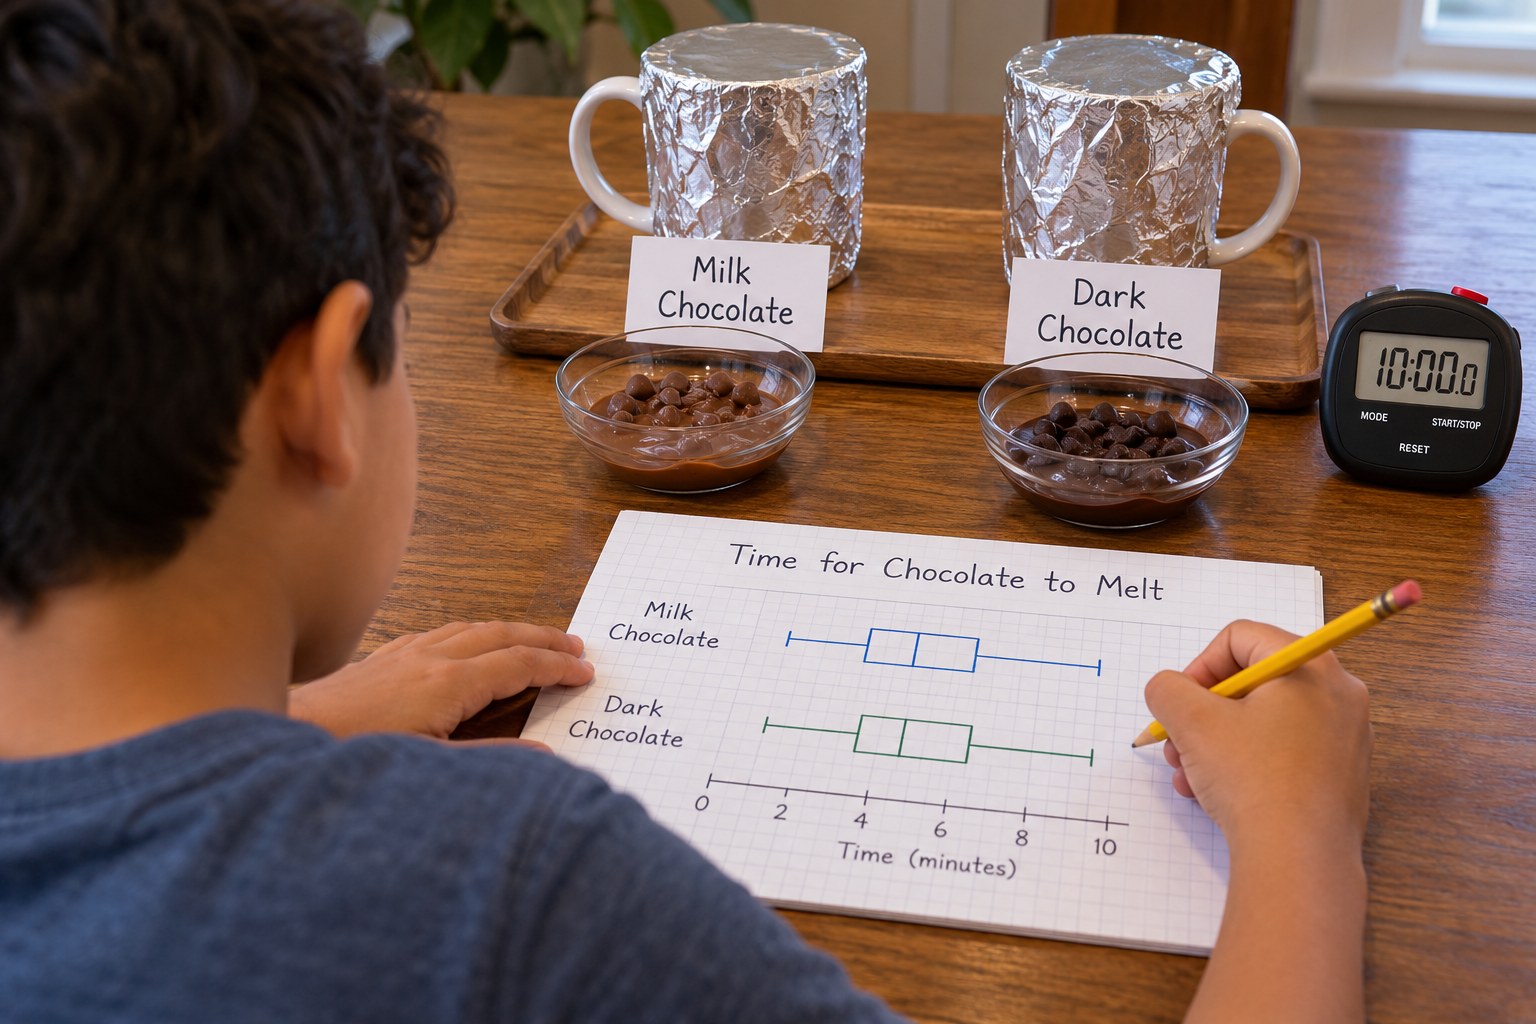
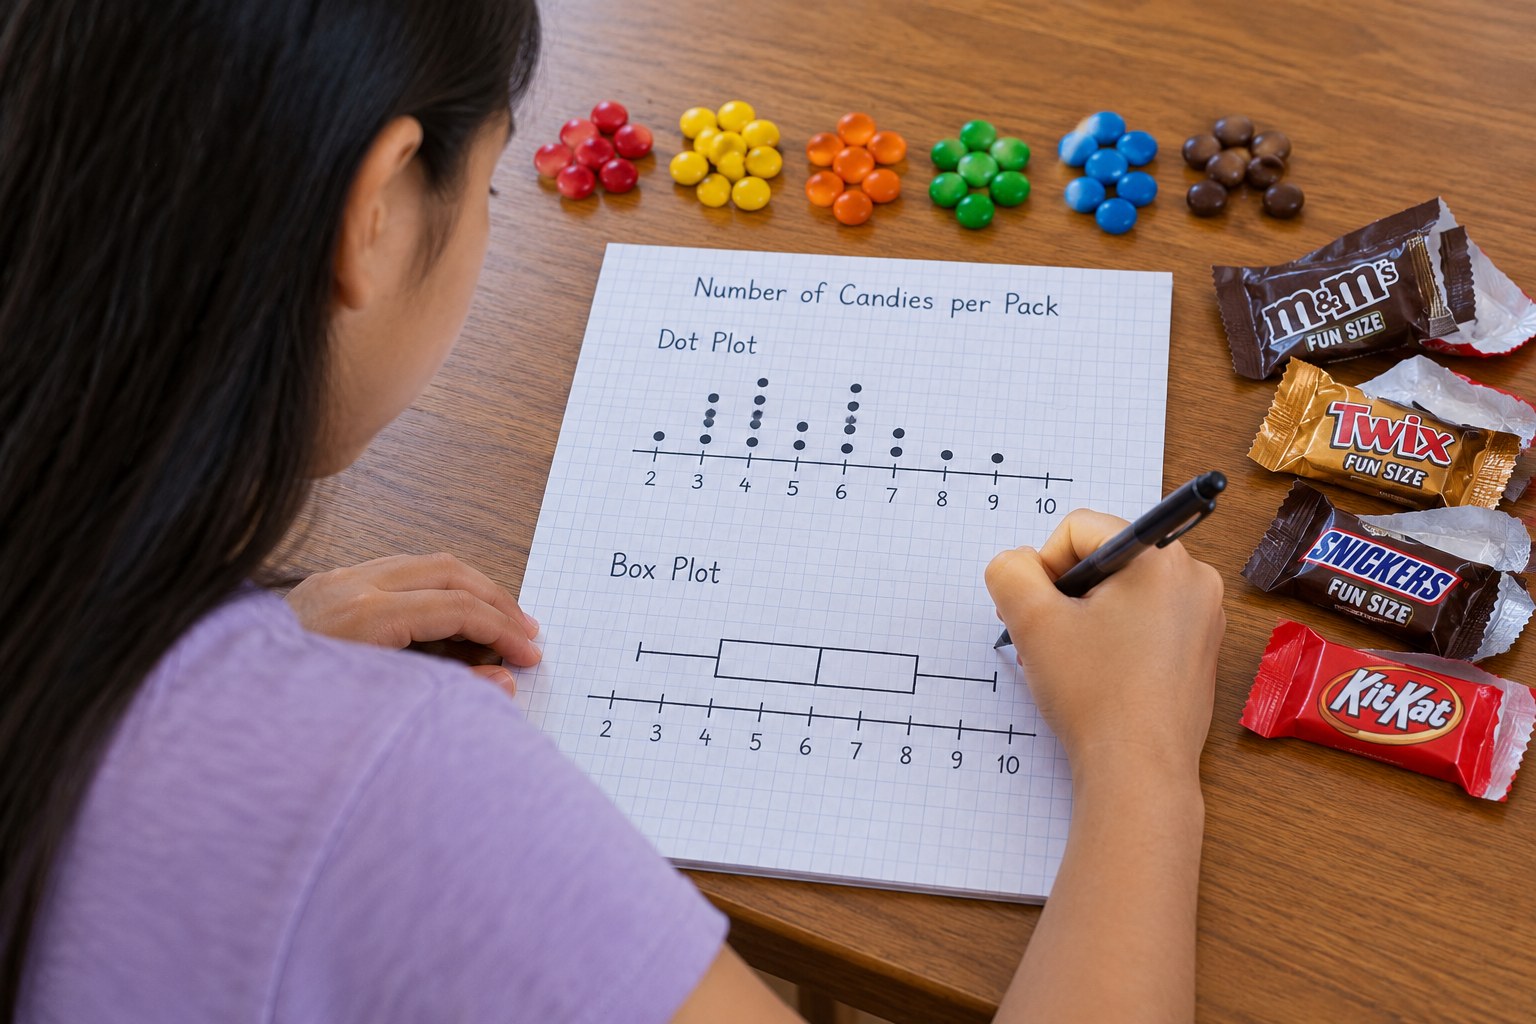
Your teen investigates why parking lots and streets feel so much hotter than a lawn on a summer afternoon. They time how long ice cubes last on five surfaces, make dot plots, and compare surfaces using mean and mean absolute deviation.
Objective
Your teen will collect melt-time data on different summer surfaces, display it in dot plots, and summarize it with the mean and mean absolute deviation, explaining results in terms of the urban heat island effect.
Standards
Materials
| Item | Quantity |
|---|---|
| Ice cubes from the same tray | 15 |
| Five surfaces in full sun or shade: asphalt, concrete, grass, bare dirt and a shaded spot | 1 of each |
| Small labels or sticky notes and a pen | 5 |
| Timer or phone stopwatch | 1 |
| Cooler or insulated bag to carry ice | 1 |
| Graph paper, pencil and calculator | 1 each |
Vocabulary
Preparation
- Run this between 1 and 4 p.m. on a sunny day for the biggest differences. Pick five spots within a short walk of each other and label each one.
- Read 'Summer safety.' Teens should wear shoes; asphalt in summer sun can burn bare feet.
- Copy the data table from 'Data table and worked example.'
Introduction
Ask your teen to hover a hand (not touch) a few inches above the driveway, then above the grass. Ask: if you were an ice cube, where would you want to be?
Why might a city be several degrees hotter at night than the countryside around it?
Which surface do you predict will melt ice fastest, and by how much?
Steps
Conclusion
Ask: how much faster did ice melt on the hottest surface than in the shade? Talk about what cities do to cool down: shade trees, light-colored 'cool roofs' and cool pavement coatings.
Make your own lesson plan in minutes
Describe a topic and Resource Portal AI writes the objectives, materials and steps for your group.
Try Resource Portal AI