
Lesson plans for 6.SP.5d
Math · Grade 6 · Statistics & Probability
Relating the choice of measures of center and variability to the shape of the data distribution and the context in which the data were gathered.
5 ready-to-teach lesson plans aligned to this standard. Each includes objectives, a materials list, vocabulary and step-by-step activities.
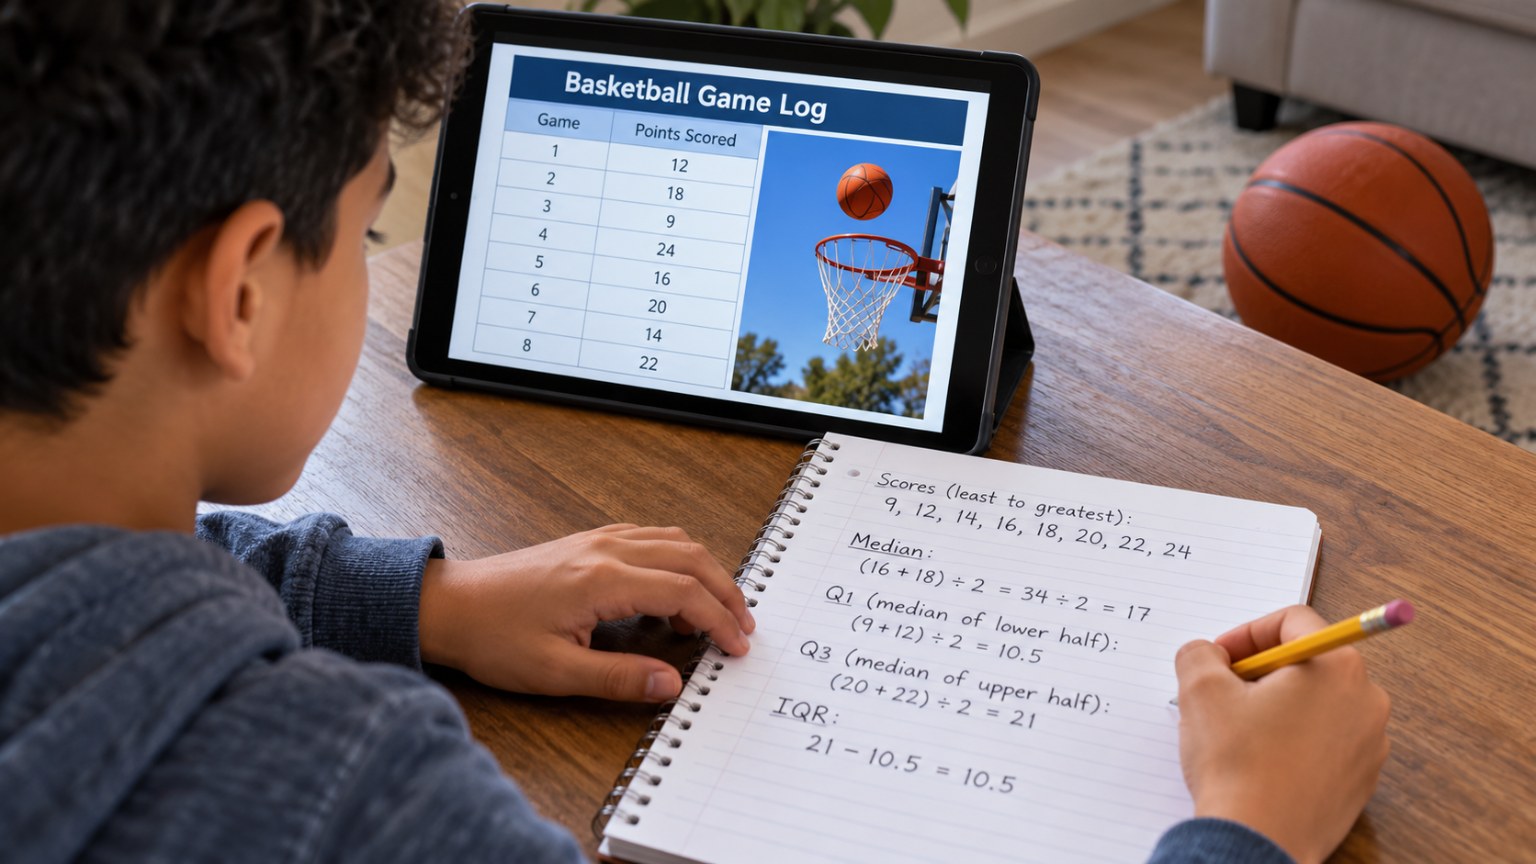
Points per Game Under the Microscope: Mean, Median and a 40-Point Night
Write a stats-backed scouting report on a real player.
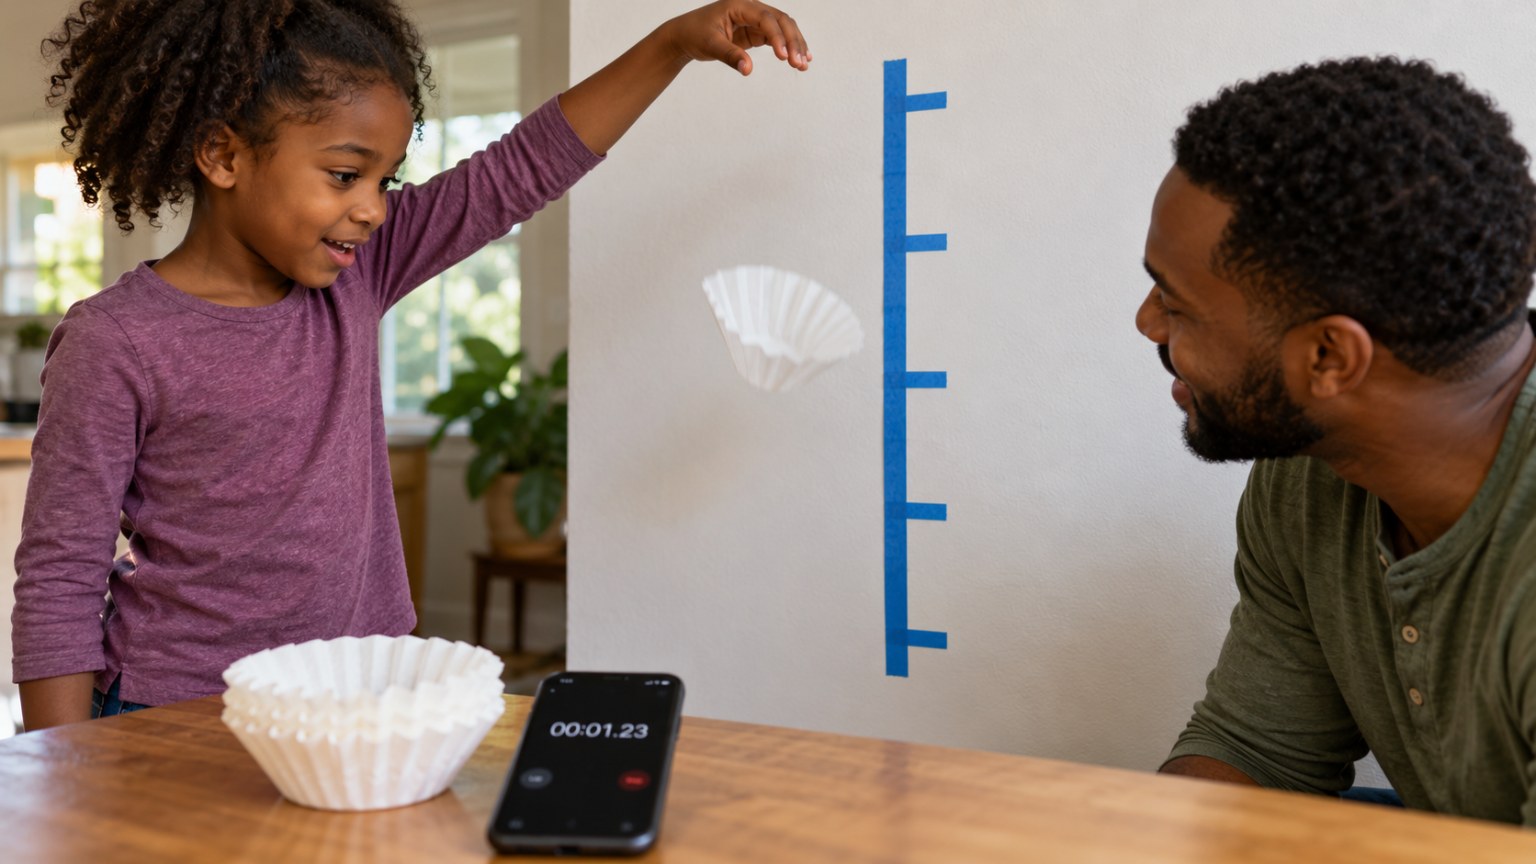
Falling Coffee Filters: Air Resistance and the Spread of Drop Times
Time falling coffee filters and choose the best average.
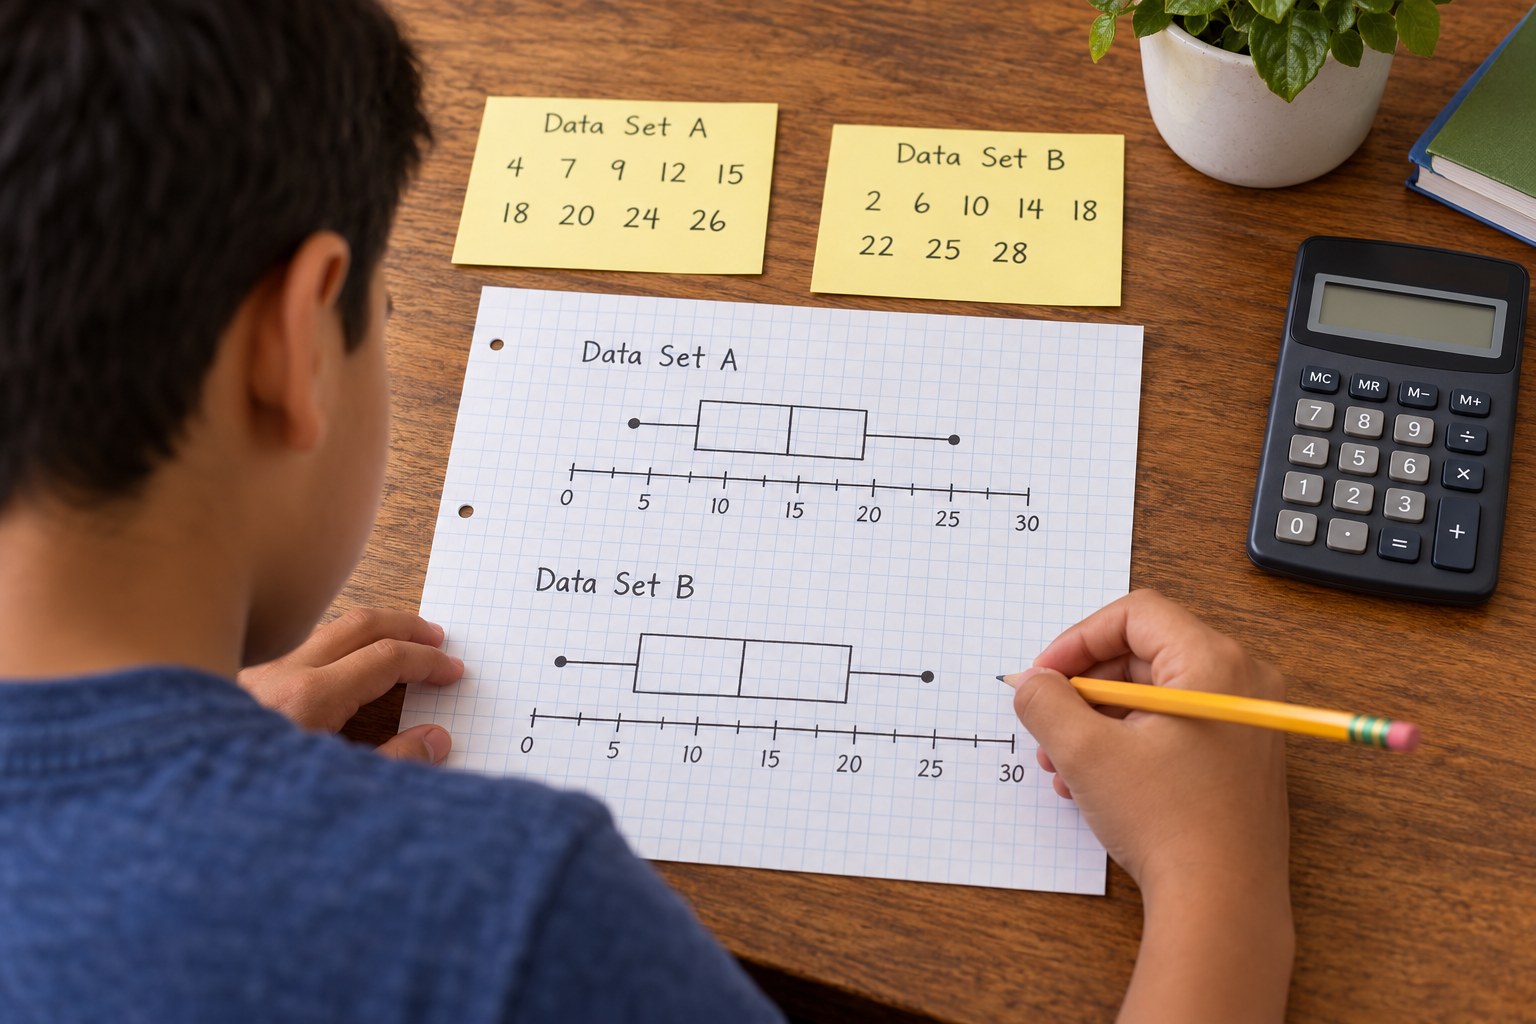
Veterans Day Data: Box Plots of Ages and Years of Service
Build box plots and choose the best measure of center.
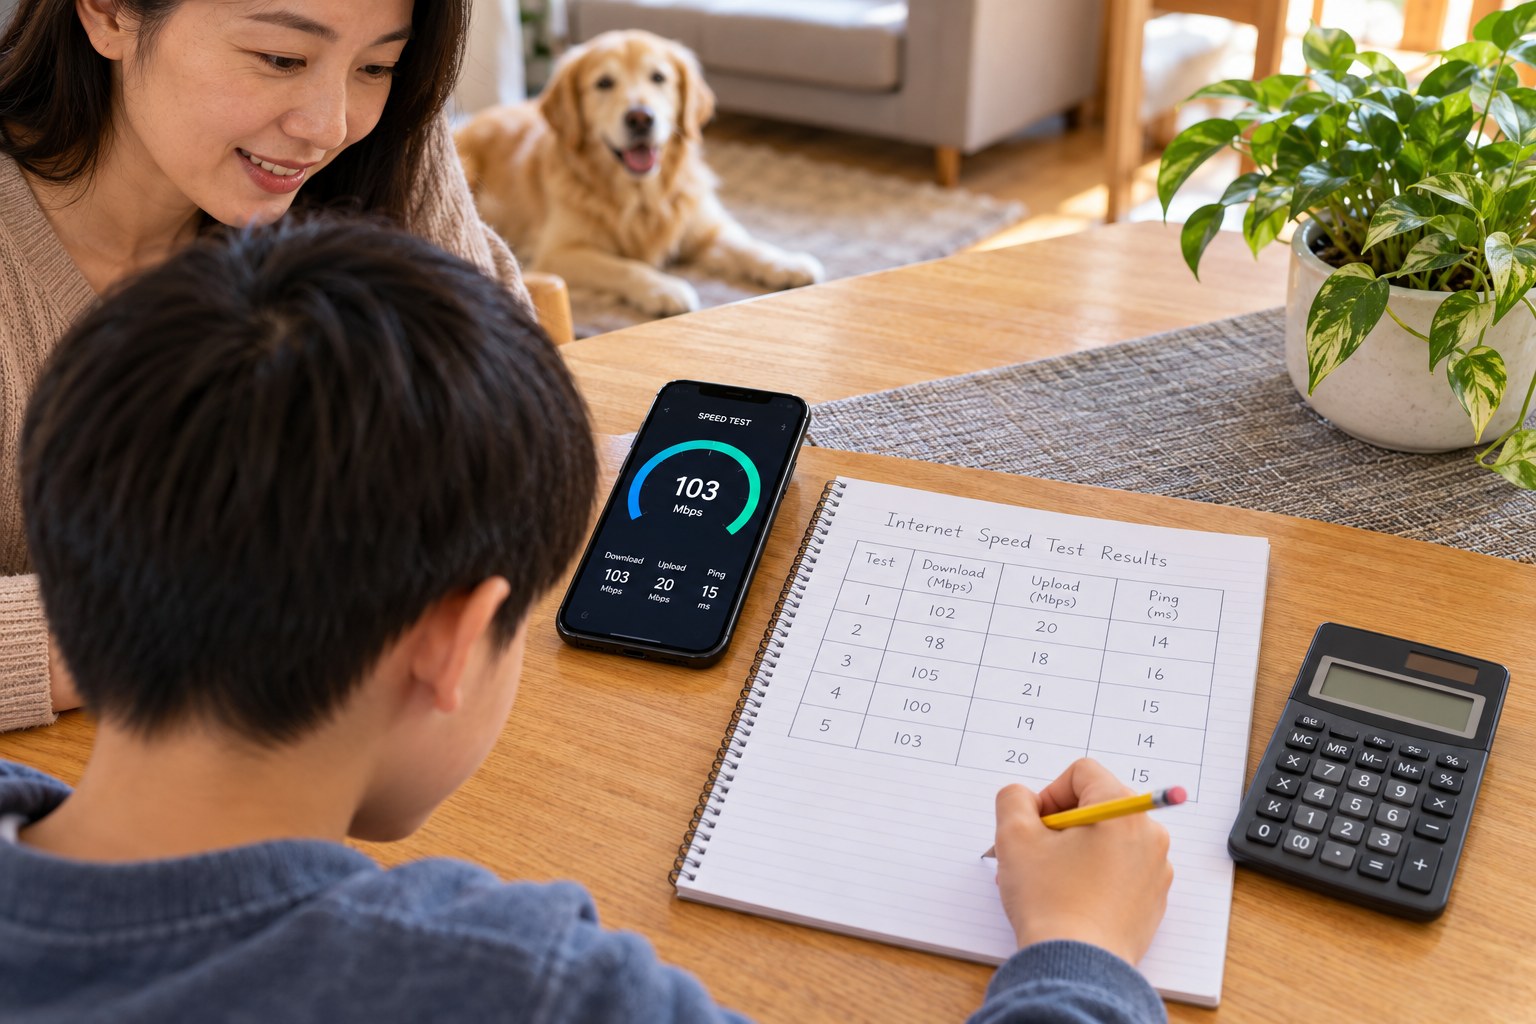
Wi-Fi Speed Map: Mean, Median and the Spread of Your Home Internet
Speed-test every room, then summarize the data with statistics.
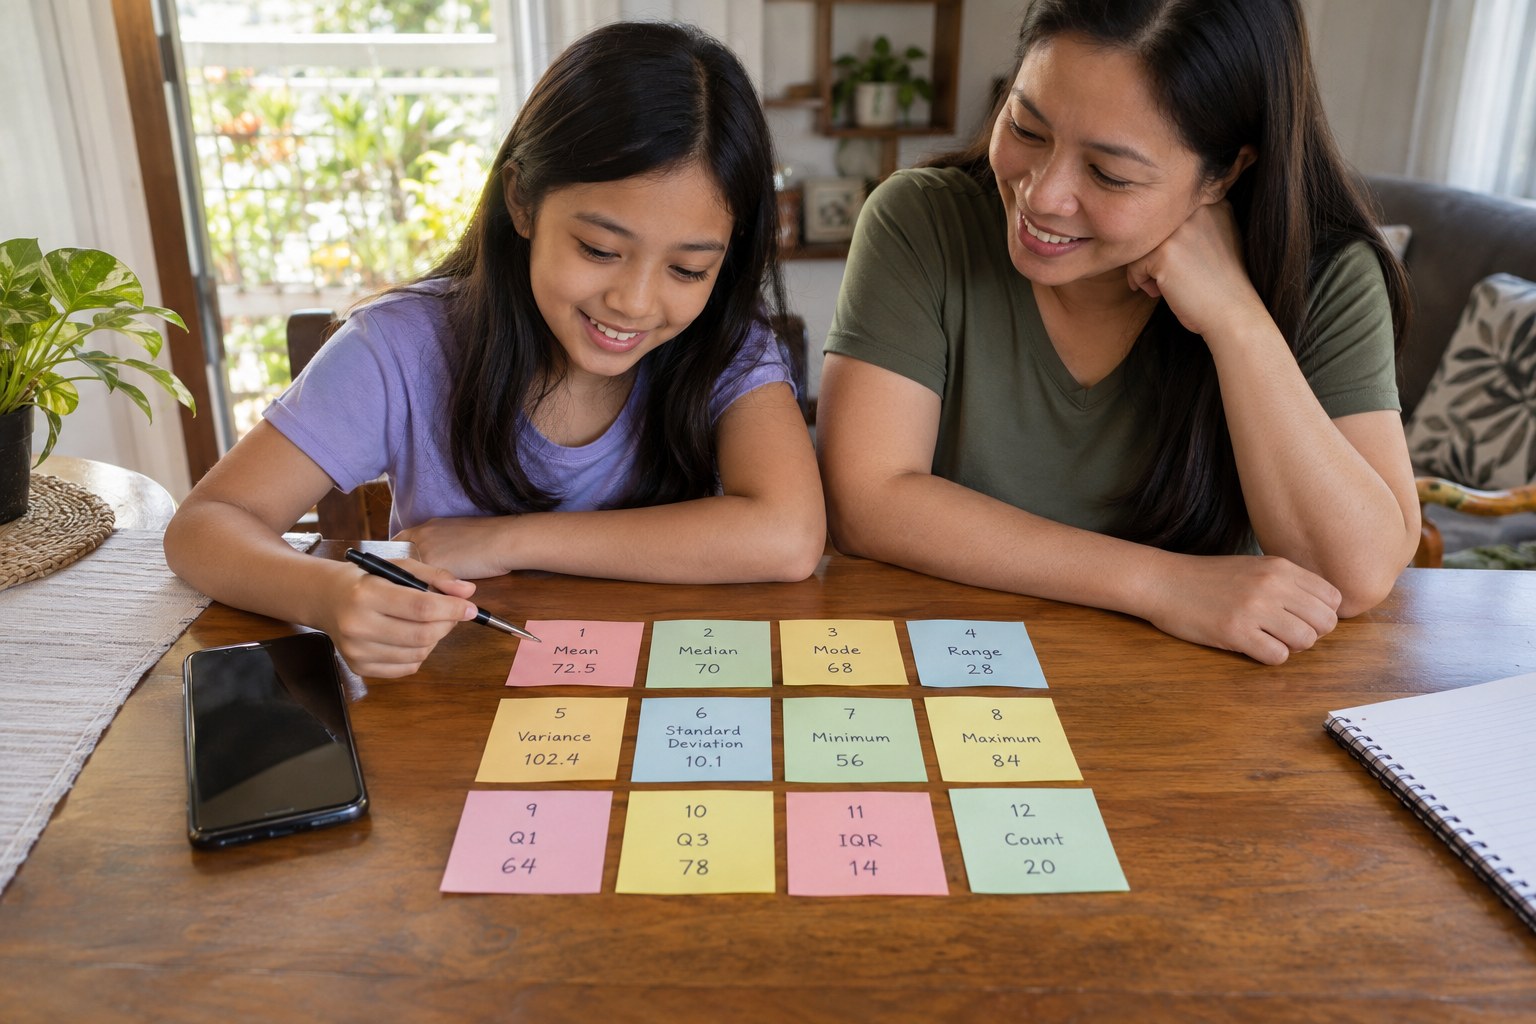
Camera Roll Census: Summarize 12 Days of Family Photos
Count daily photos and summarize them with statistics.
See all grade 6 standards with lesson plans
Make a lesson like this in a minute
Pick a topic, grade, group size and length. Resource Portal AI writes the objectives, materials, steps and pictures.
Sign up FREEFree forever · no credit card needed. Members get all 5,100+ lessons for $14.99/month, with the first 7 days free.