Rainforest Tree Heights Scaled Bar Graph
Overview
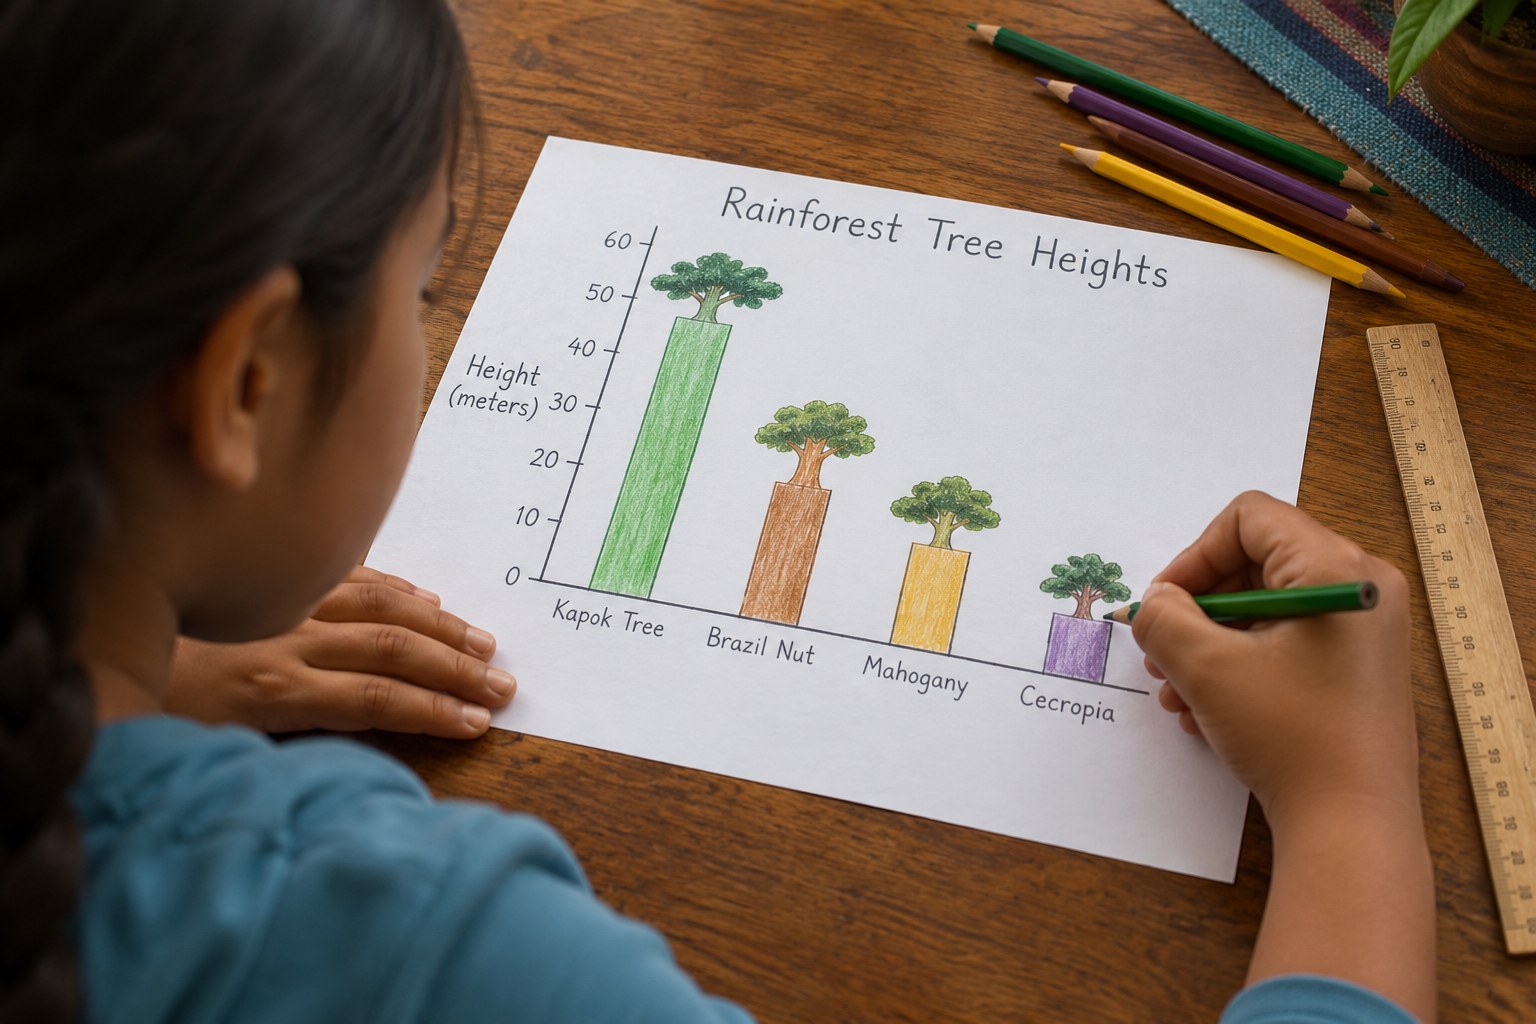
Graph rainforest tree heights with a scale of 25 feet.
Description
Your child turns real rainforest tree heights into a scaled bar graph where each square stands for 25 feet, then answers how-many-more and how-many-less questions, comparing the tall emergent kapok tree to the cacao tree on the shady floor.
Objective
Your child will draw a scaled bar graph of rainforest tree heights and solve one- and two-step how-many-more and how-many-less problems using the graph.
Standards
Materials
| Item | Quantity |
|---|---|
| Graph paper or a printed grid | 2 sheets |
| Ruler | 1 |
| Colored pencils (green, brown) | 1 set |
| Pencil | 1 |
| Tape measure (optional, to measure a real height for comparison) | 1 |
Vocabulary
Preparation
- Copy the data table from 'Tree height data' onto paper or read it from the screen.
- Draw the graph axes on graph paper with 9 lines up the side labeled 0, 25, 50, 75 ... 200. For a group, each child or pair makes their own graph.
Introduction
Ask: how tall do you think our house is? (About 25 feet for a two-story house.) The tallest rainforest trees are about 8 houses stacked on top of each other!
What would happen if each square on a graph stood for just 1 foot?
Which layer do you think has the tallest trees?
Steps
Conclusion
Ask: how much taller is the tallest tree than the shortest? Why do you think emergent trees grow so tall? (They reach above the canopy for sunlight.)
Make your own lesson plan in minutes
Describe a topic and Resource Portal AI writes the objectives, materials and steps for your group.
Try Resource Portal AI