Summer Cool-Down Lab: Graph How a Wet Cloth Cools a Thermometer
Overview
Find out how sweat cools you with three thermometers and a fan.
Description
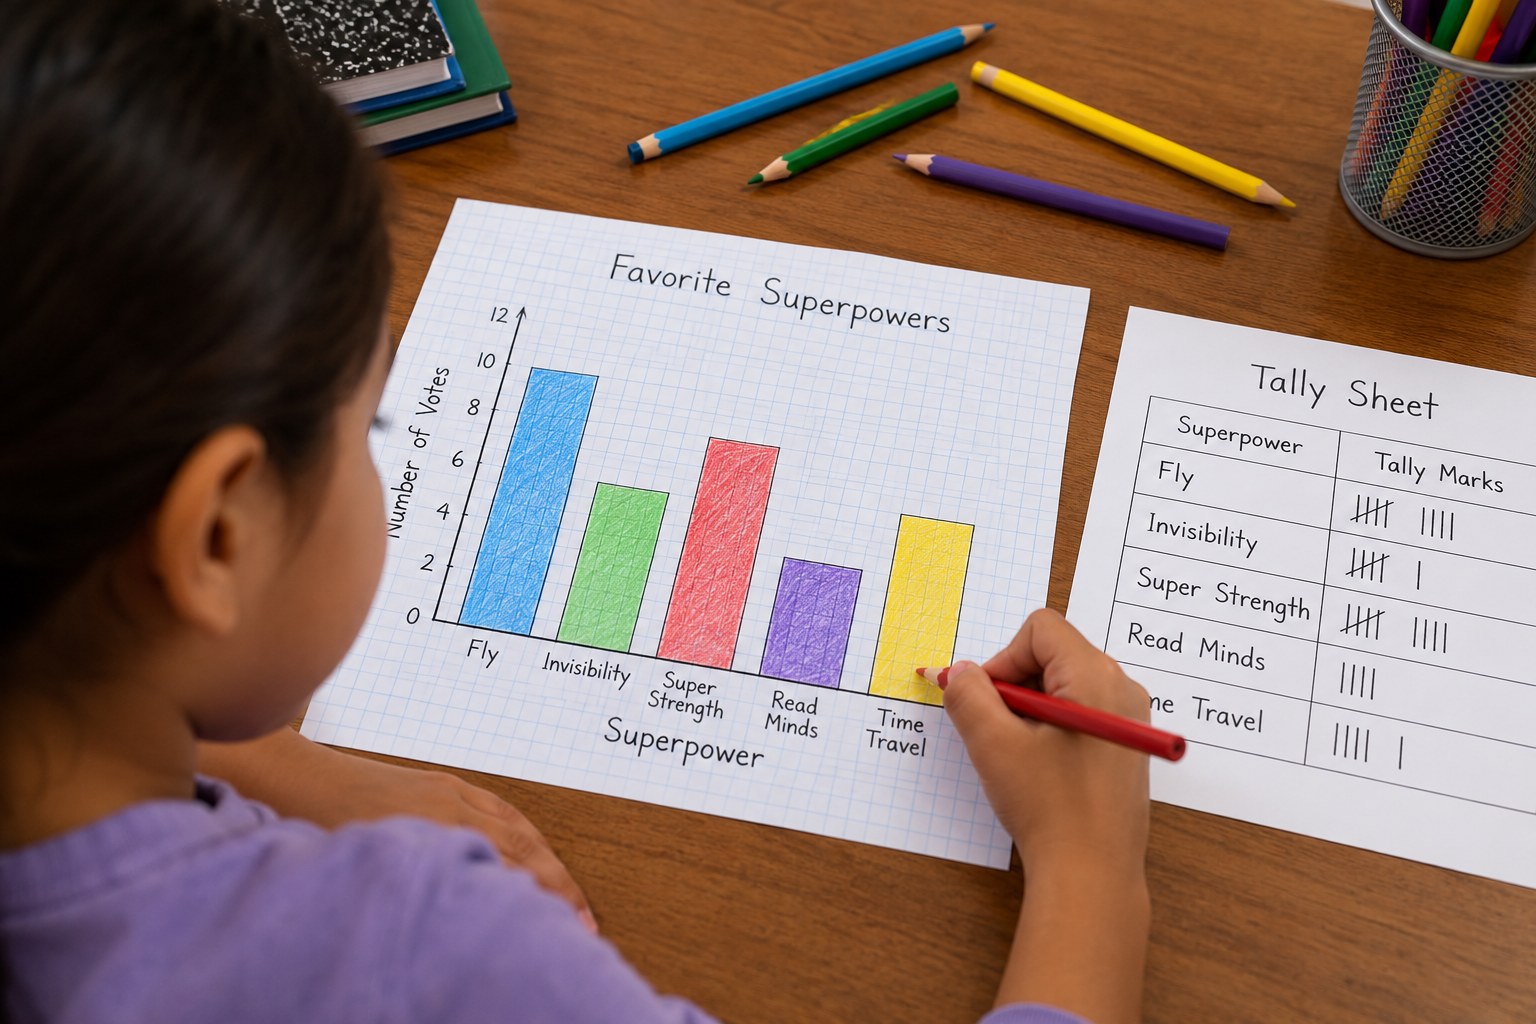
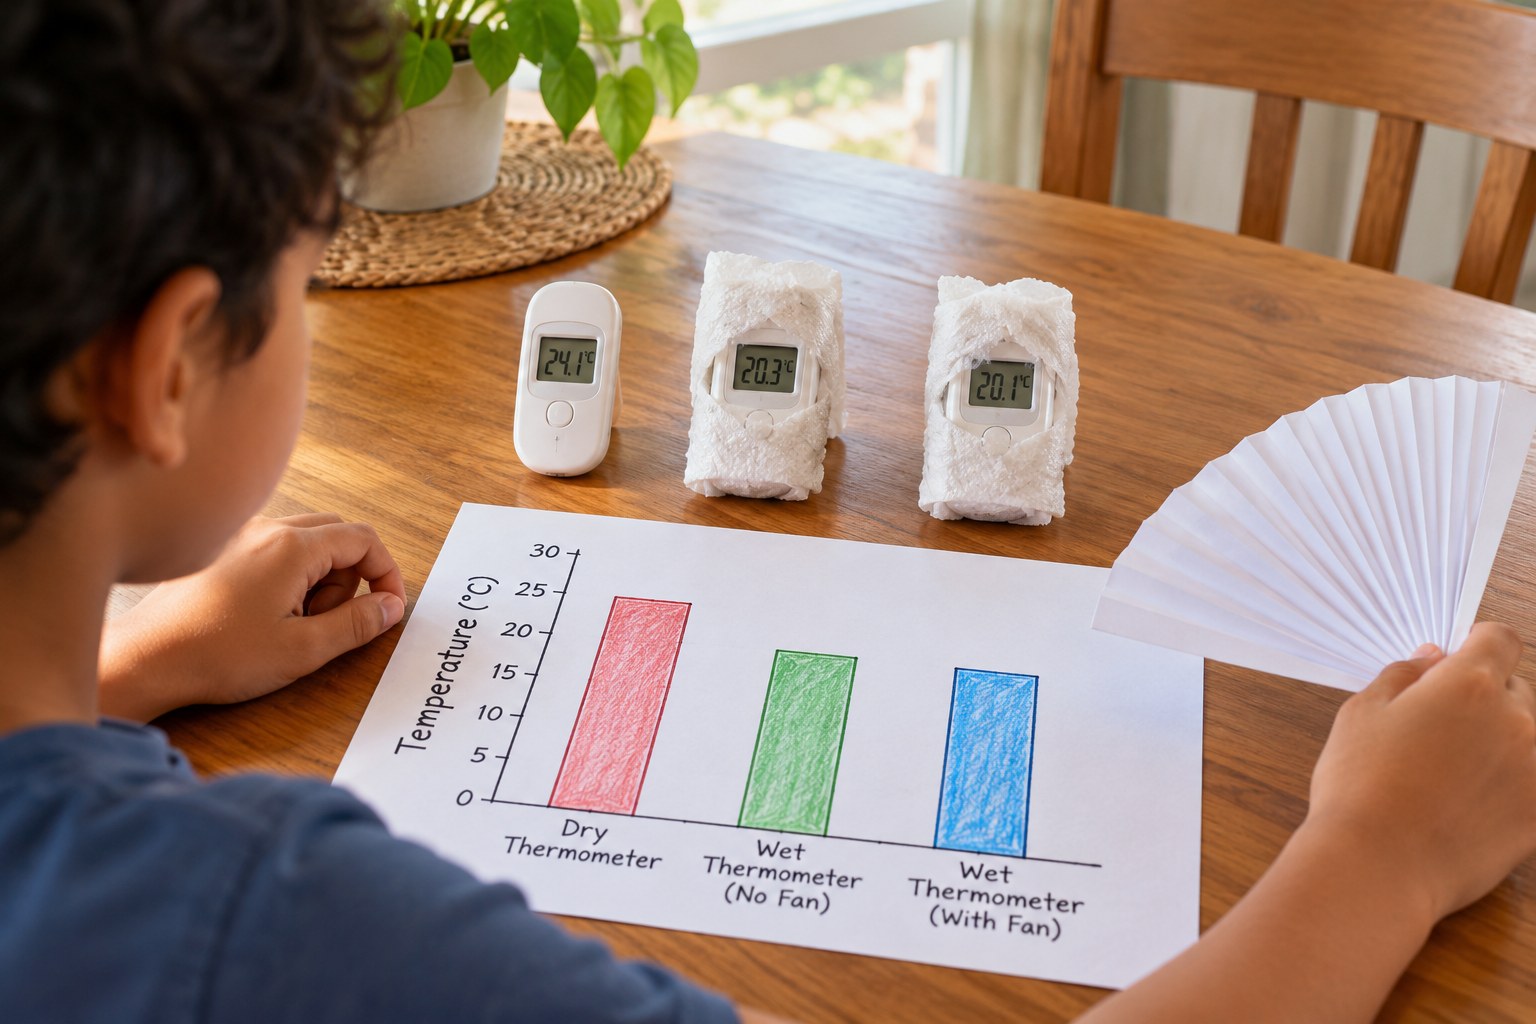
On a hot summer day your child discovers why sweat cools us. They wrap thermometers in dry, damp and soaked cloth, fan them for five minutes, and draw a scaled bar graph of how many degrees each one dropped.
Objective
Your child will test how evaporating water cools a thermometer and show the temperature drops on a scaled bar graph, then answer 'how many more' questions about it.
Standards
Materials
| Item | Quantity |
|---|---|
| Thermometers (outdoor, aquarium or digital kitchen probe) | 3, or 1 used three times |
| Paper towel or thin cotton cloth squares | 3 pieces, about 4 by 4 inches |
| Bowl of water left out for an hour so it is room temperature | 1 cup |
| Rubber bands or tape | 3 |
| Hand fan, folded paper or an electric fan on low | 1 |
| Graph paper or lined paper, pencil and ruler | 1 sheet each per child |
Vocabulary
Preparation
- Set a bowl of water out at least an hour early so it matches room temperature. Cold water would cool the thermometer by itself and spoil the test.
- Choose an indoor spot away from direct sun, or a shady spot outdoors with no wind.
- Copy the recording chart from 'Recording chart' onto paper.
Introduction
Dip your child's fingertip in room-temperature water and have them blow on it. Ask: the water was not cold, so why does your finger feel cool?
Why do people sweat more on summer days?
Do you think a soaked cloth or a damp cloth will cool a thermometer more? Why?
Steps
Conclusion
Ask: why does a wet towel on your neck help on a hot day? Our bodies sweat so the evaporating water can carry heat away, and that is why drinking water in summer matters so much.
Make your own lesson plan in minutes
Describe a topic and Resource Portal AI writes the objectives, materials and steps for your group.
Try Resource Portal AI