
8.SP: lesson ideas
Math · Grade 8 · Statistics & Probability
Statistics and Probability
Teaching this standard
8.SP is part of Grade 8 Math (Statistics & Probability). The lessons below are aligned to standards right next to it, so they build the same skills.
There is no ready-made lesson for this exact standard in the library yet. Ria, the Resource Portal AI assistant, can write one in about a minute: tell it the standard, the grade and how much time you have, and it plans the objectives, materials, vocabulary and step-by-step activities.
Lesson plans for related grade 8 standards
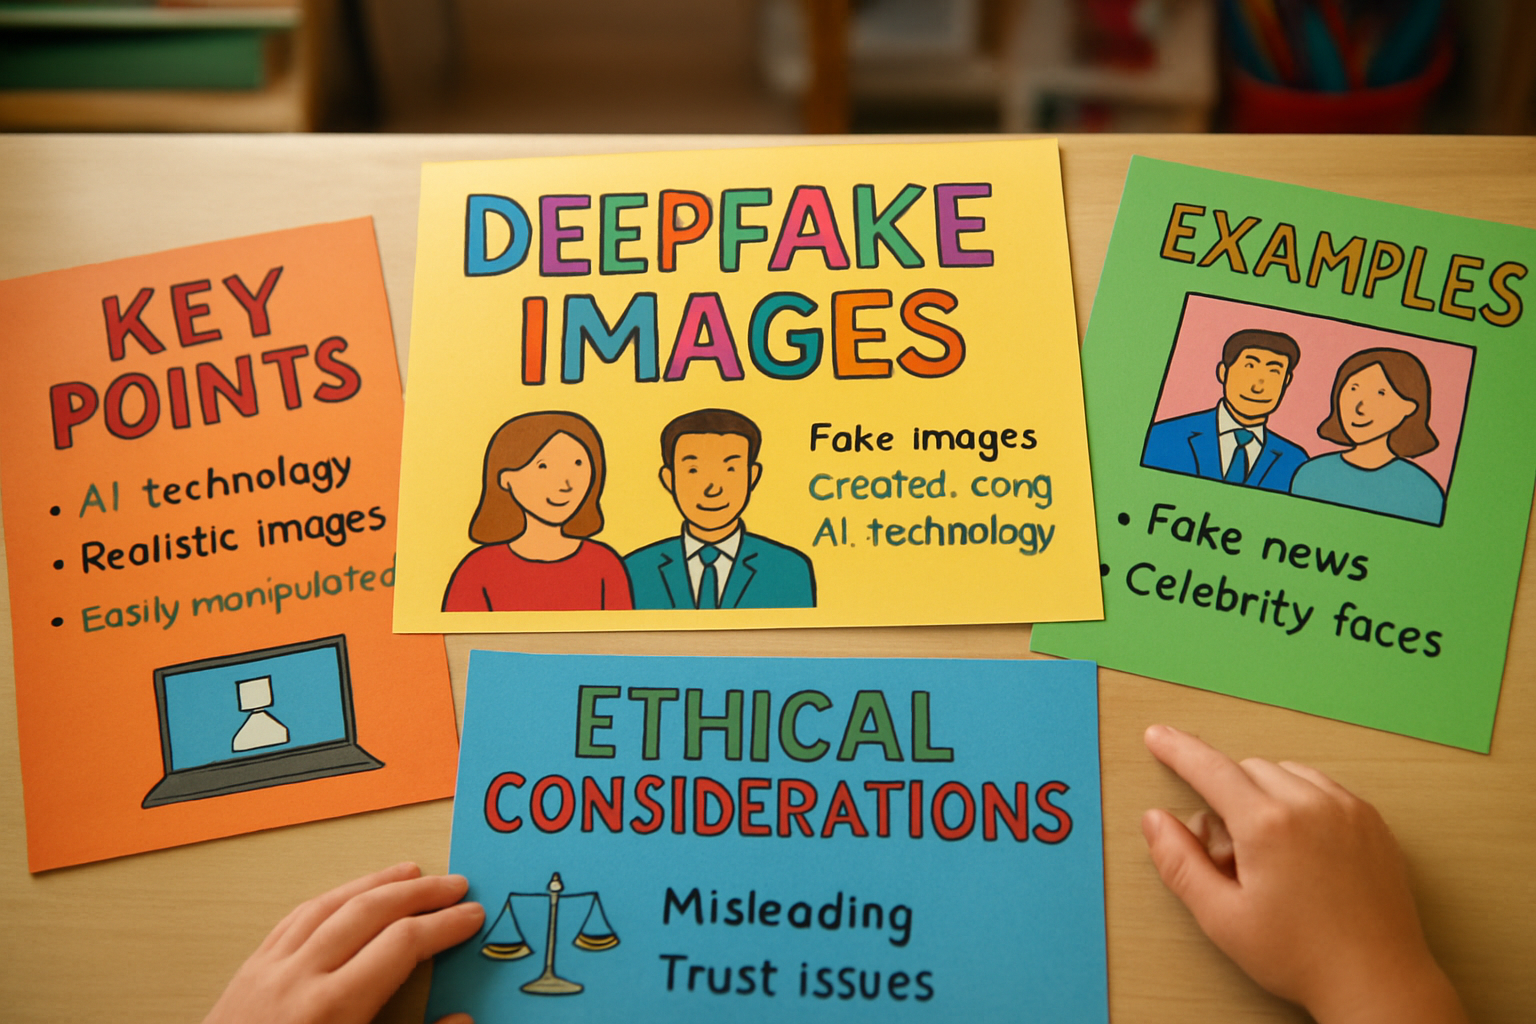
Real or AI? Spotting Deepfake Images
Explore the world of deepfake images and develop skills to critically analyze media in this engaging lesson focused on technology and its societal impacts.
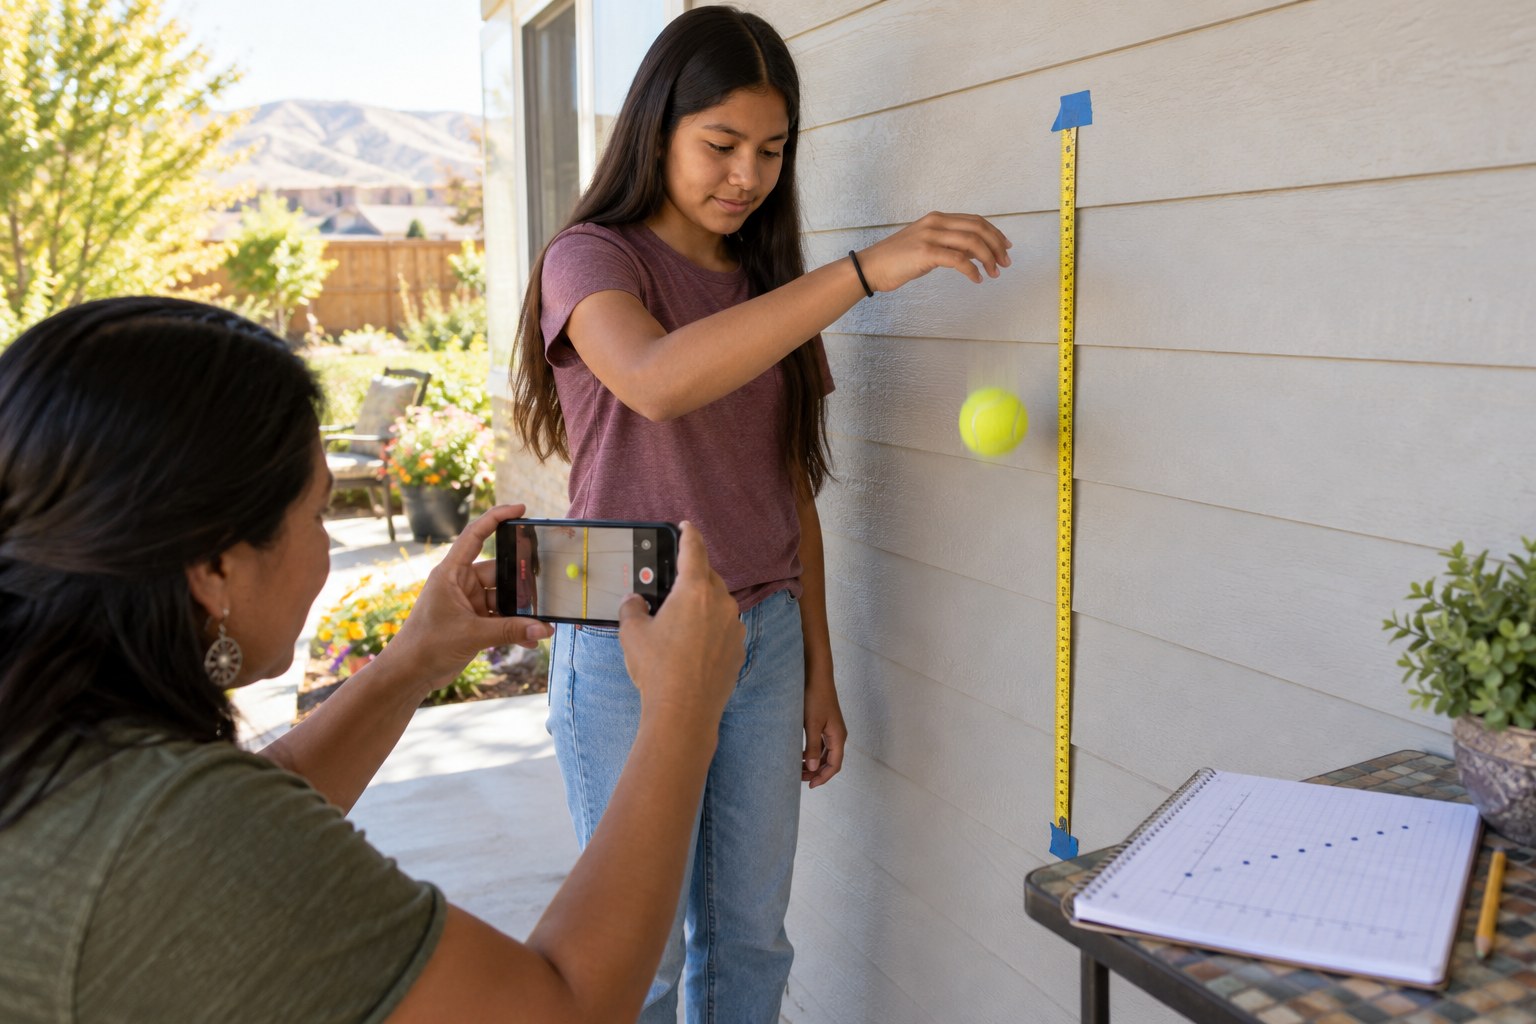
Bounce Back: Drop Height vs. Rebound Height Scatter Plot
Drop, film, plot and model a ball's bounce.
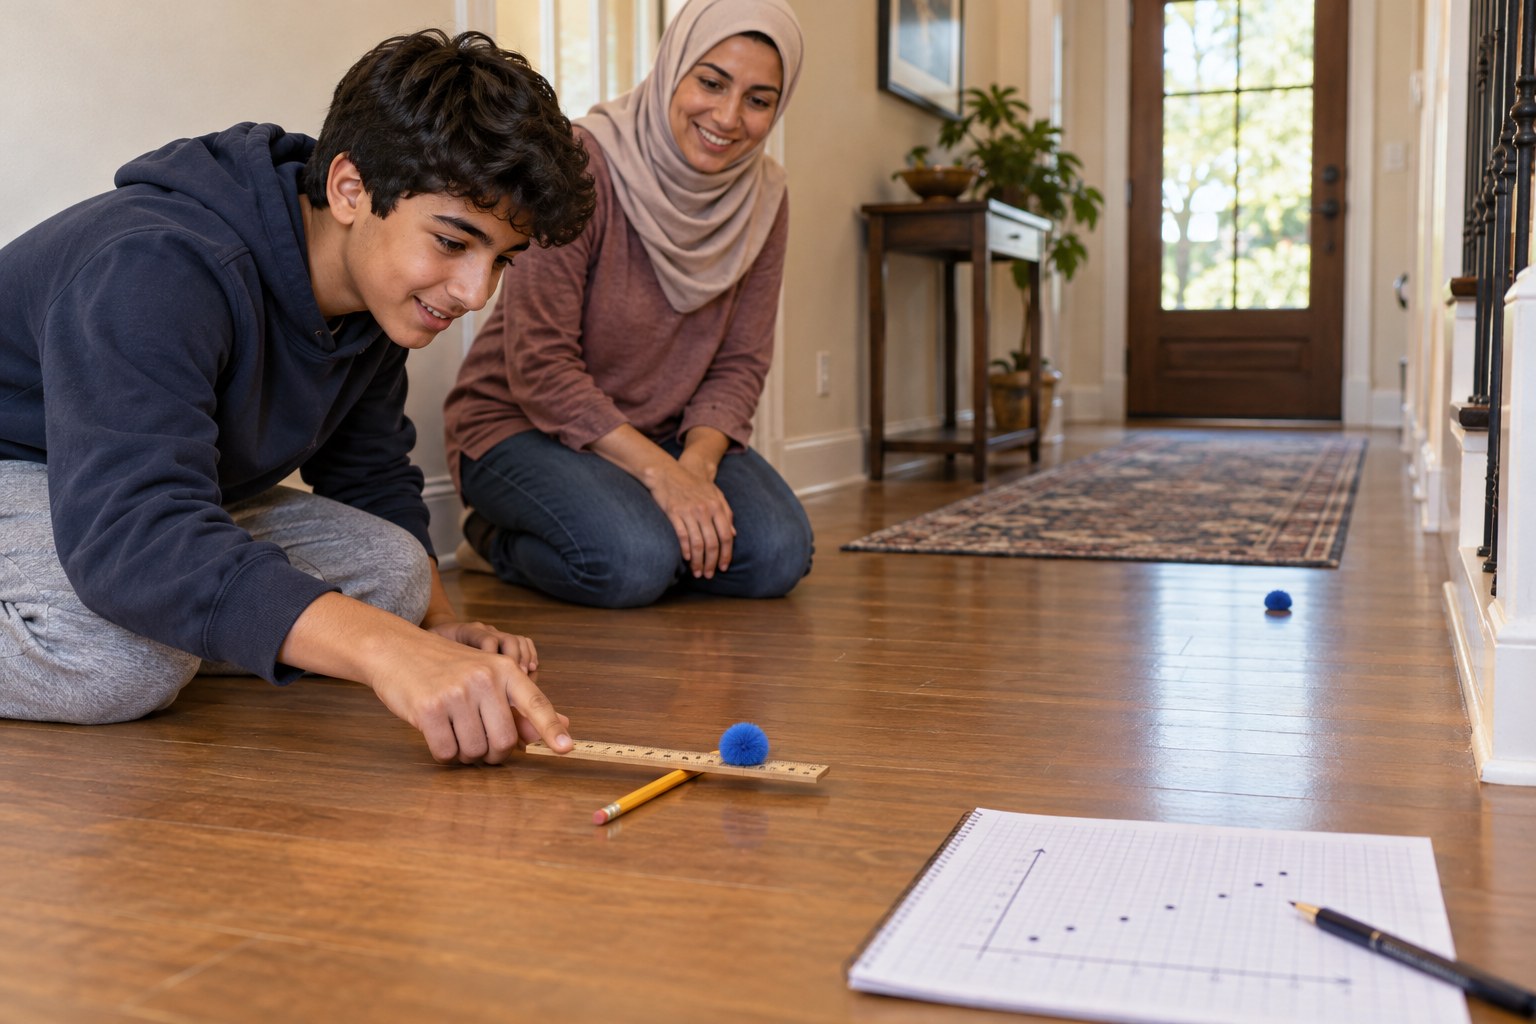
Ruler Launcher Lab: Pivot Position vs. Distance Scatter Plot
Launch pom-poms, plot the data and fit a line.
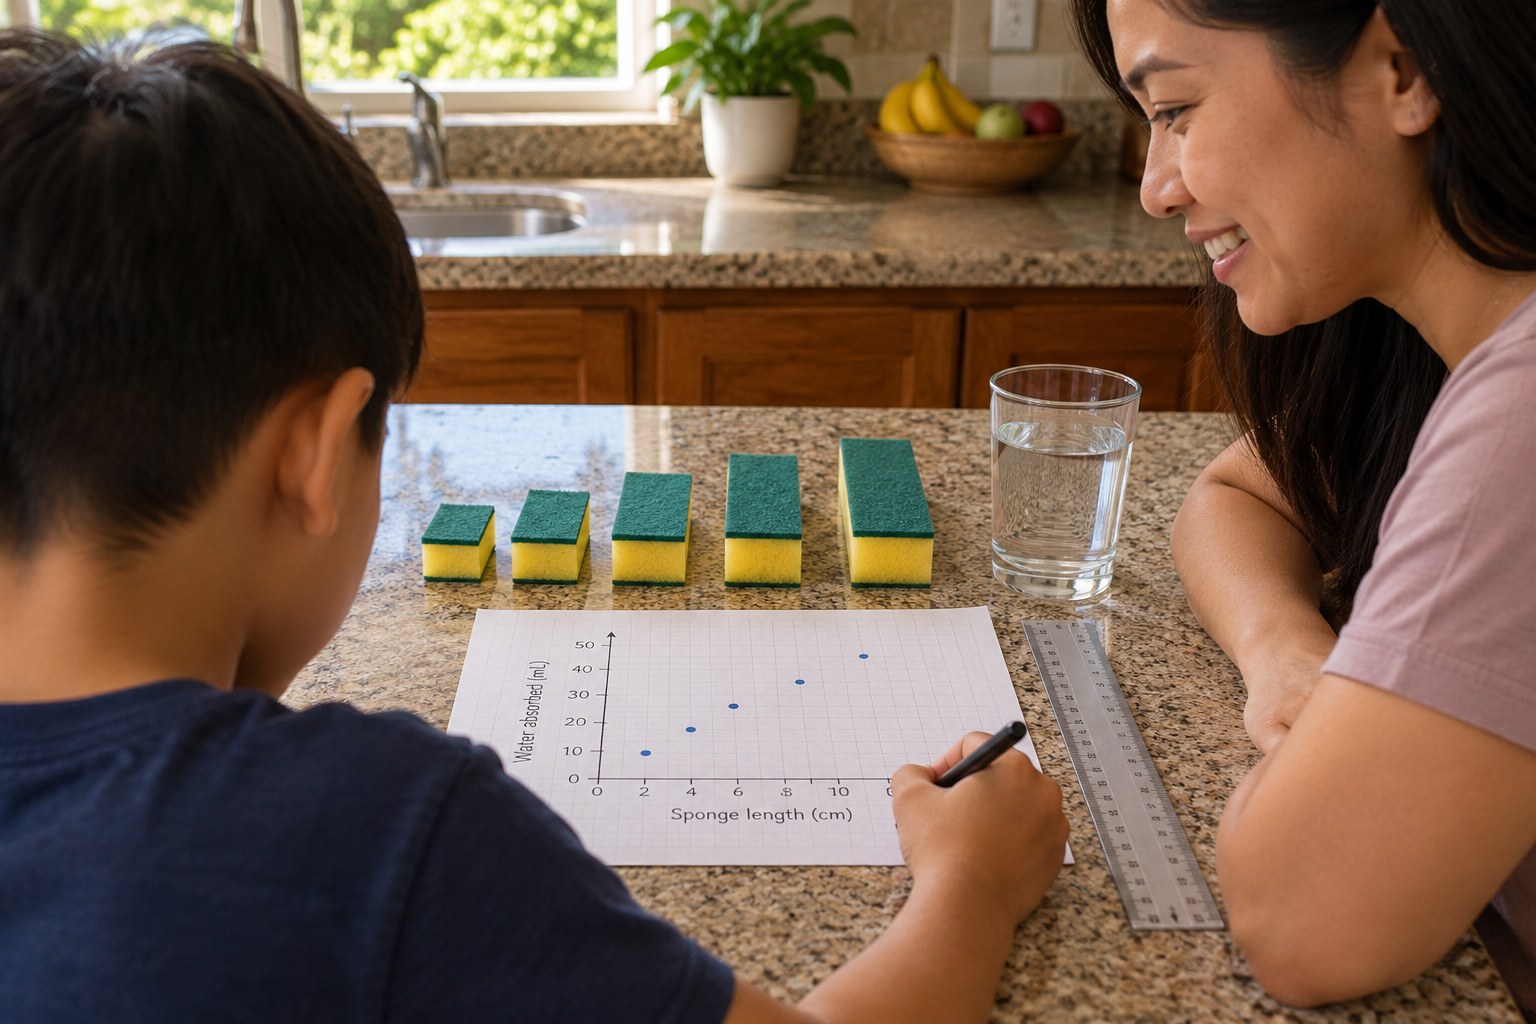
Sponge Soak Lab: Sponge Size vs. Water Held Scatter Plot
Squeeze sponges and plot how much water they hold.
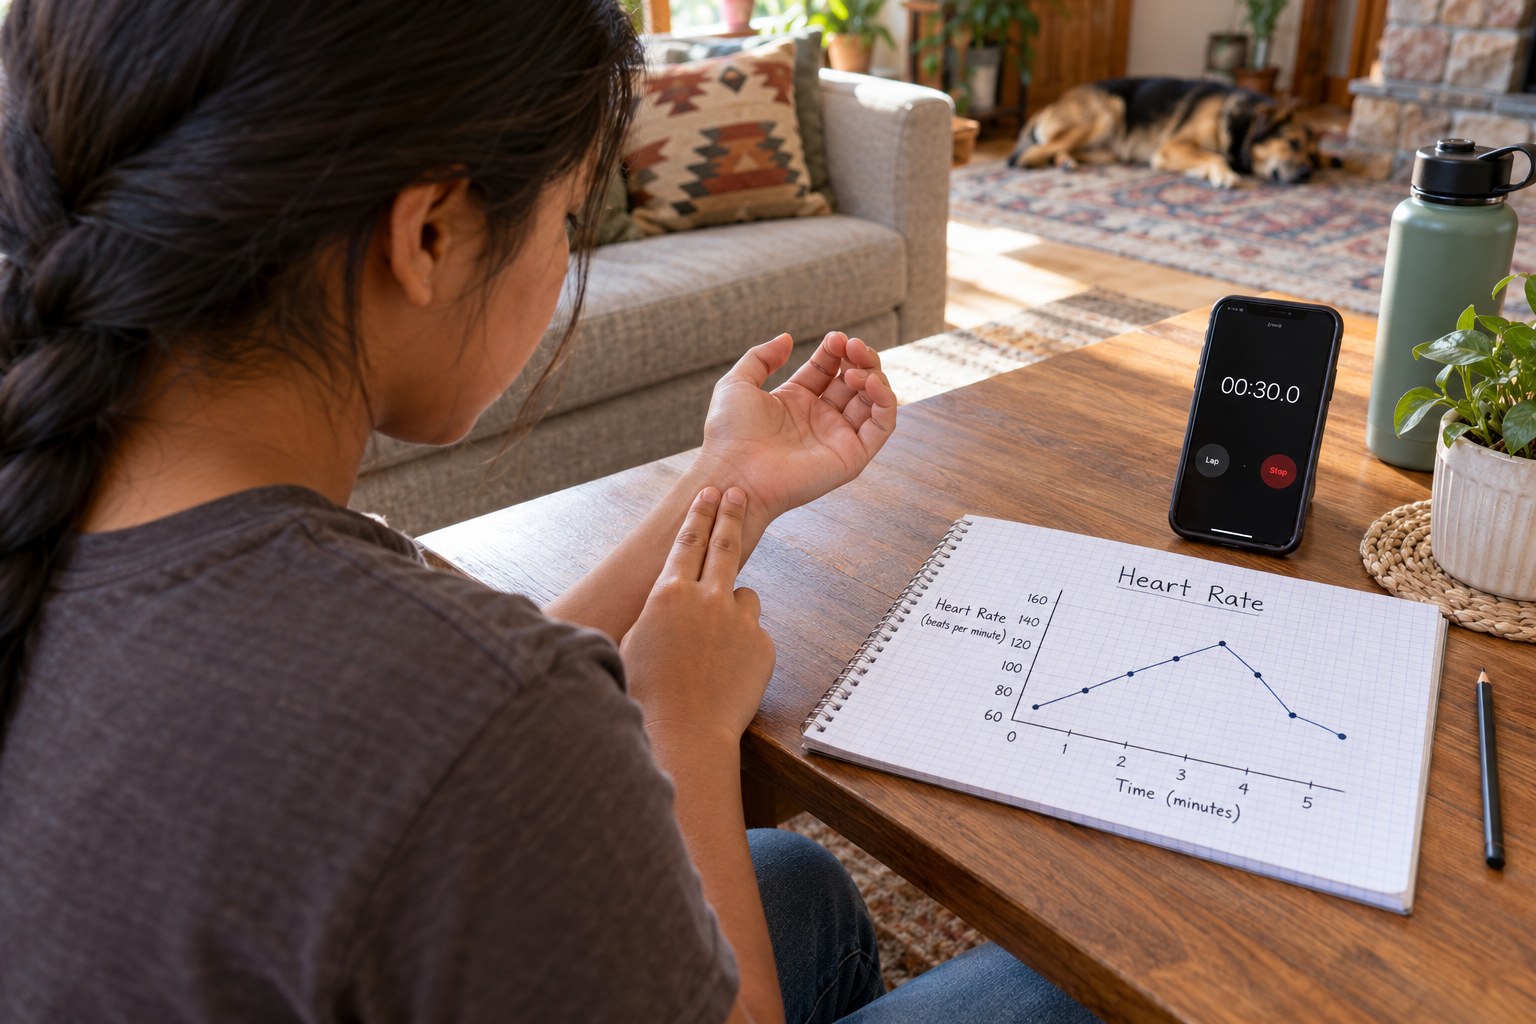
Heart Rate Recovery: Graph How Fast Your Pulse Settles
Graph your heart rate rising and recovering after exercise.
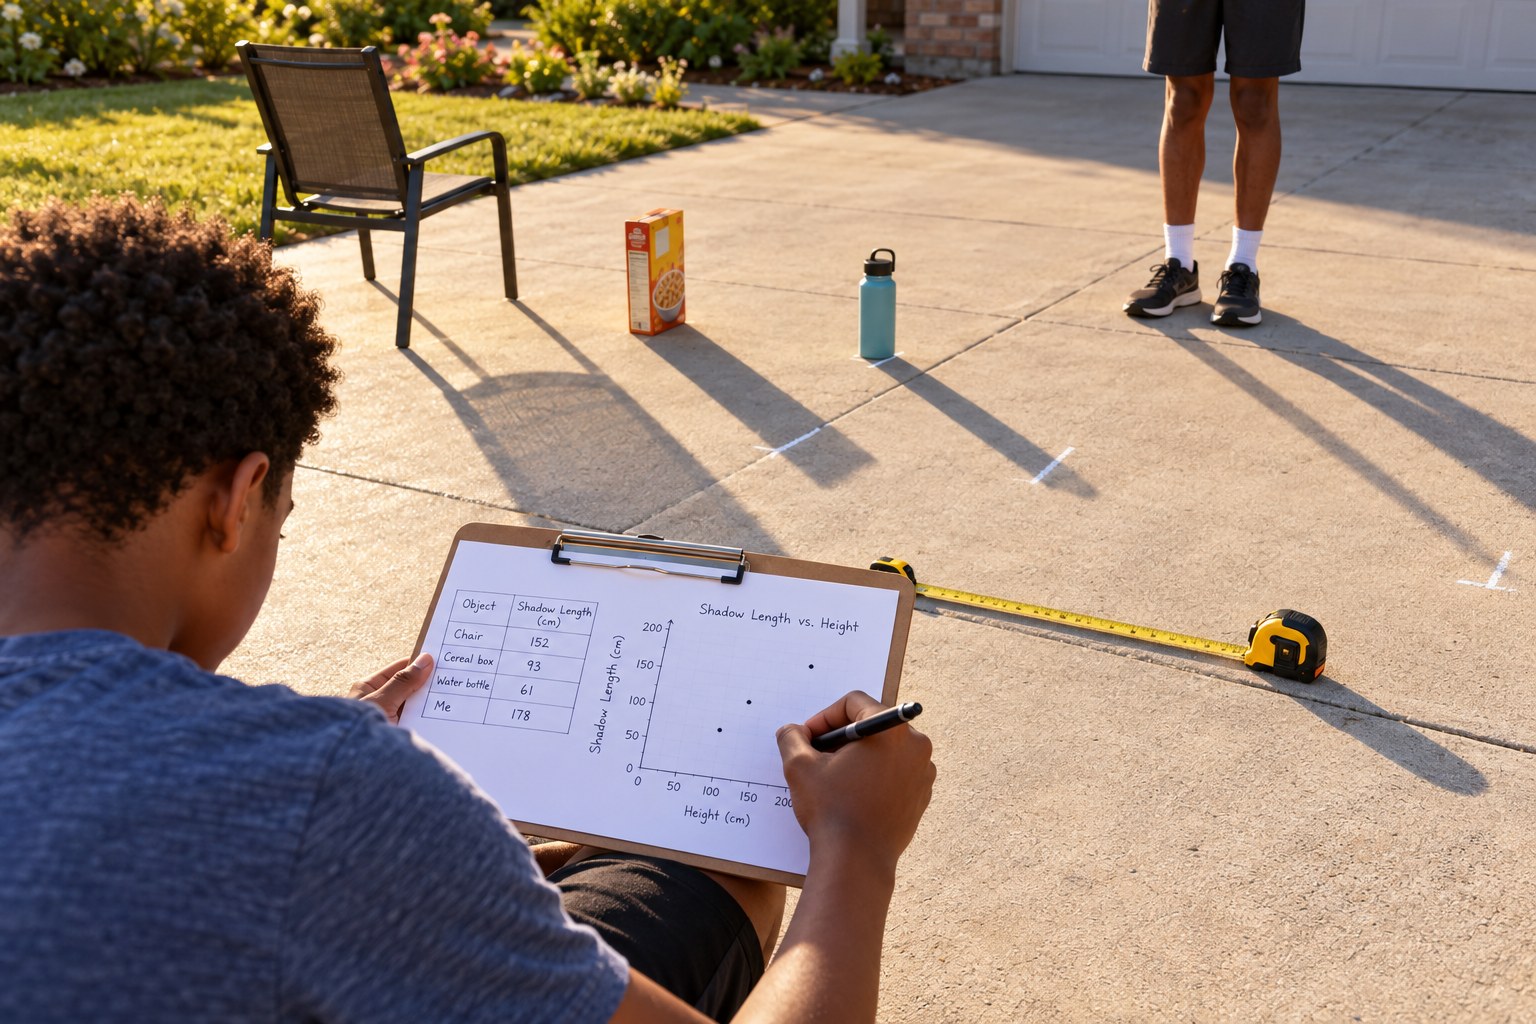
Shadow Survey: Object Height vs. Shadow Length Scatter Plot
Measure 8 shadows fast, plot them and fit a line.
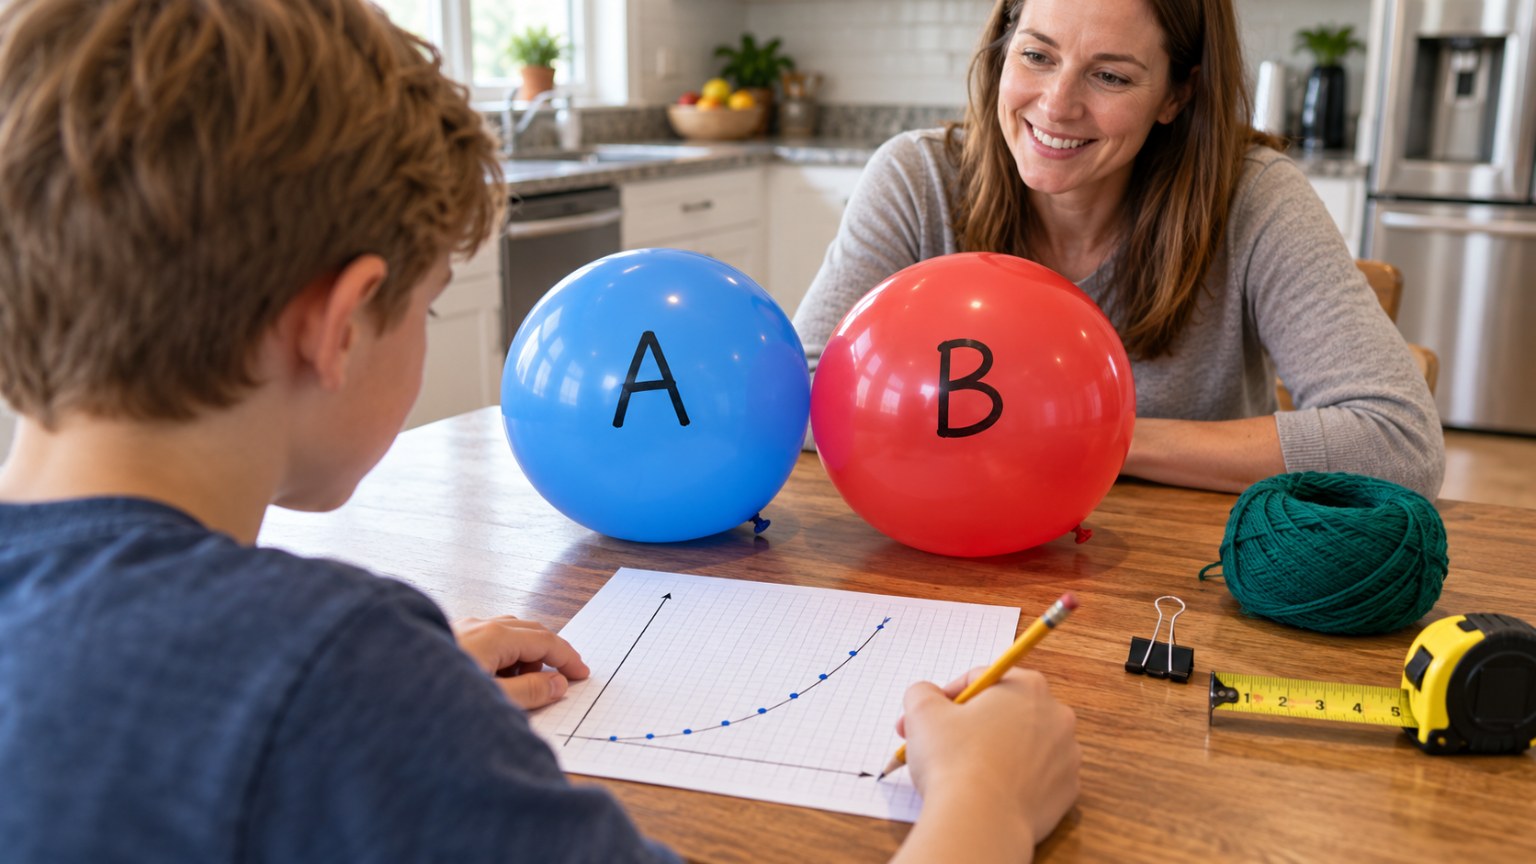
Breath by Breath: A Balloon Circumference Scatter Plot
Measure a balloon breath by breath and graph the curve.
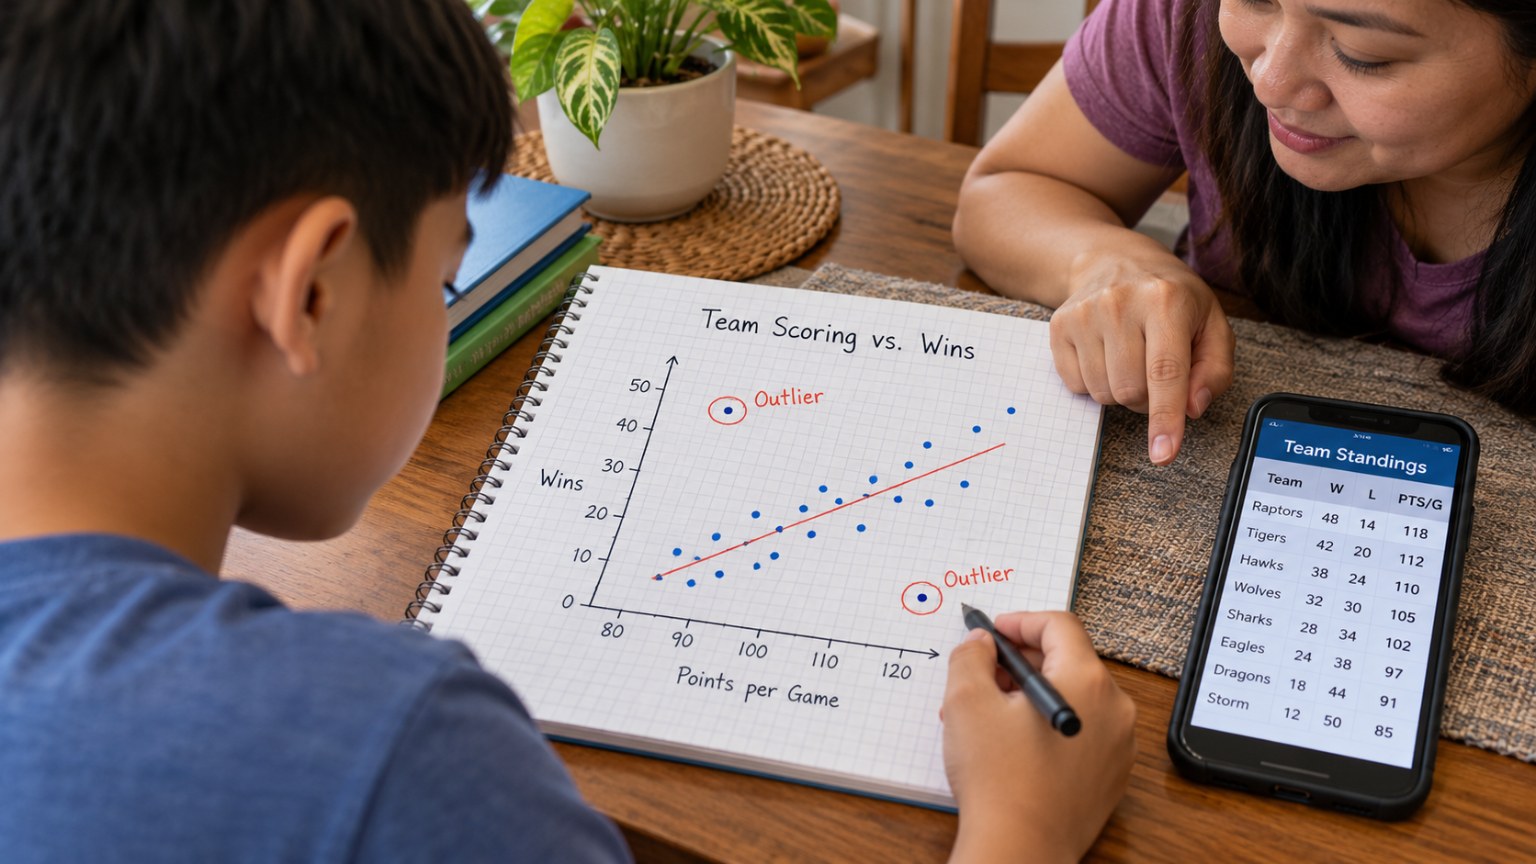
Points vs. Wins: A Real-League Scatter Plot Scouting Report
Plot a real league's scoring against its wins.
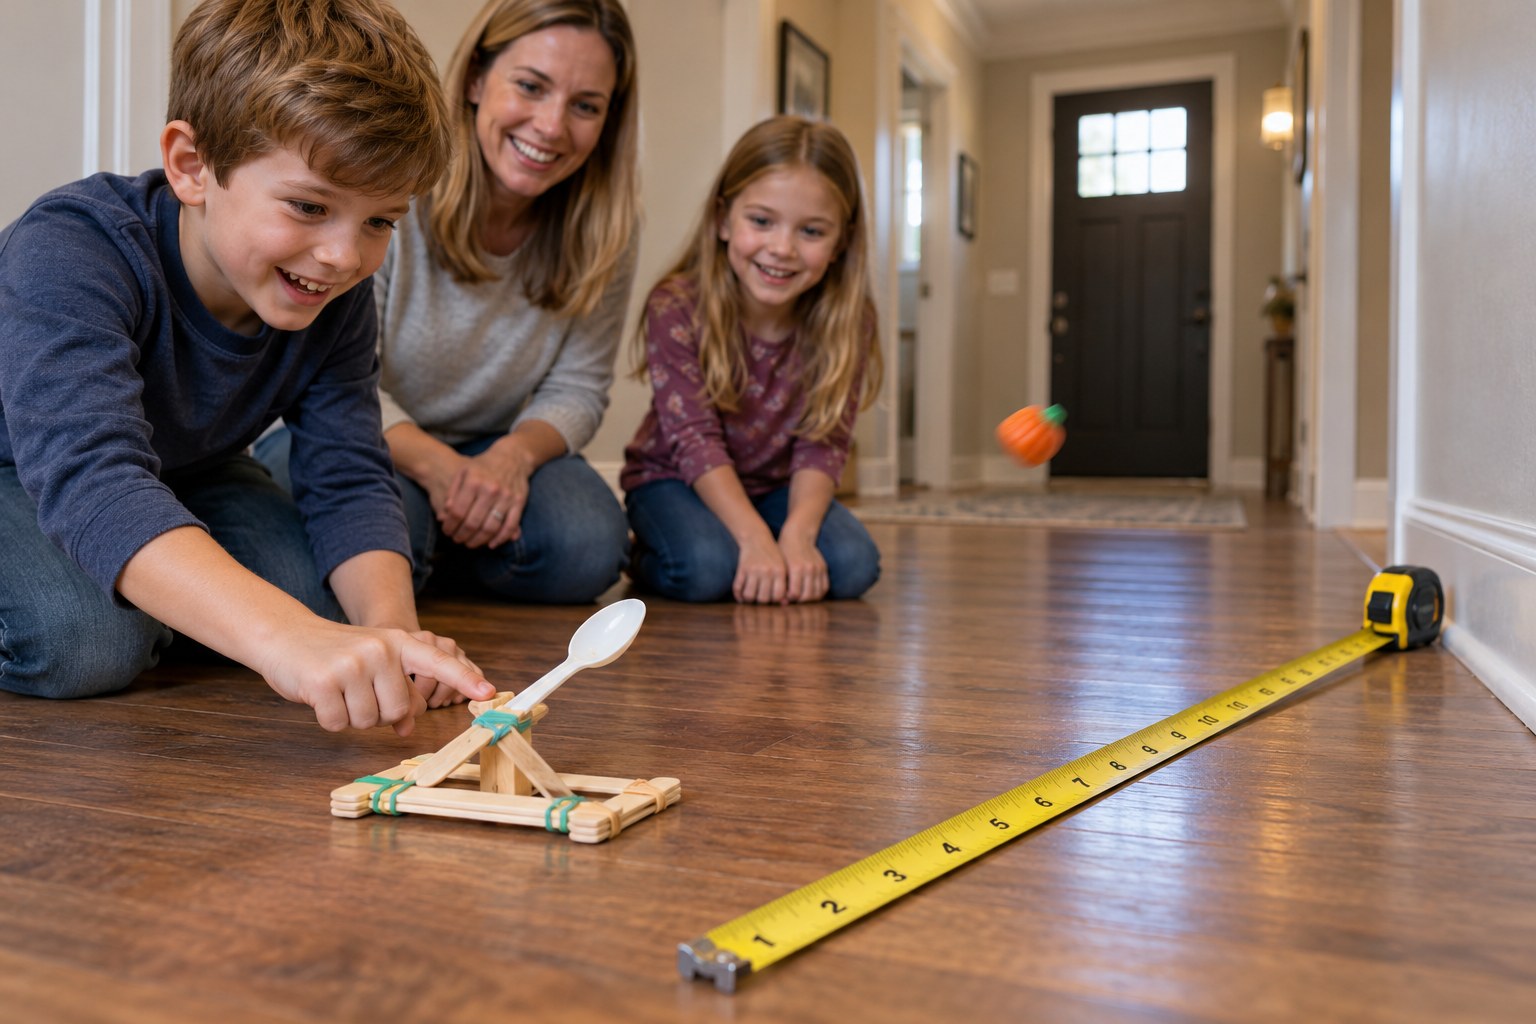
Candy Pumpkin Catapult: Scatter Plot Launch Lab
Build a catapult and graph pull-back against launch distance.
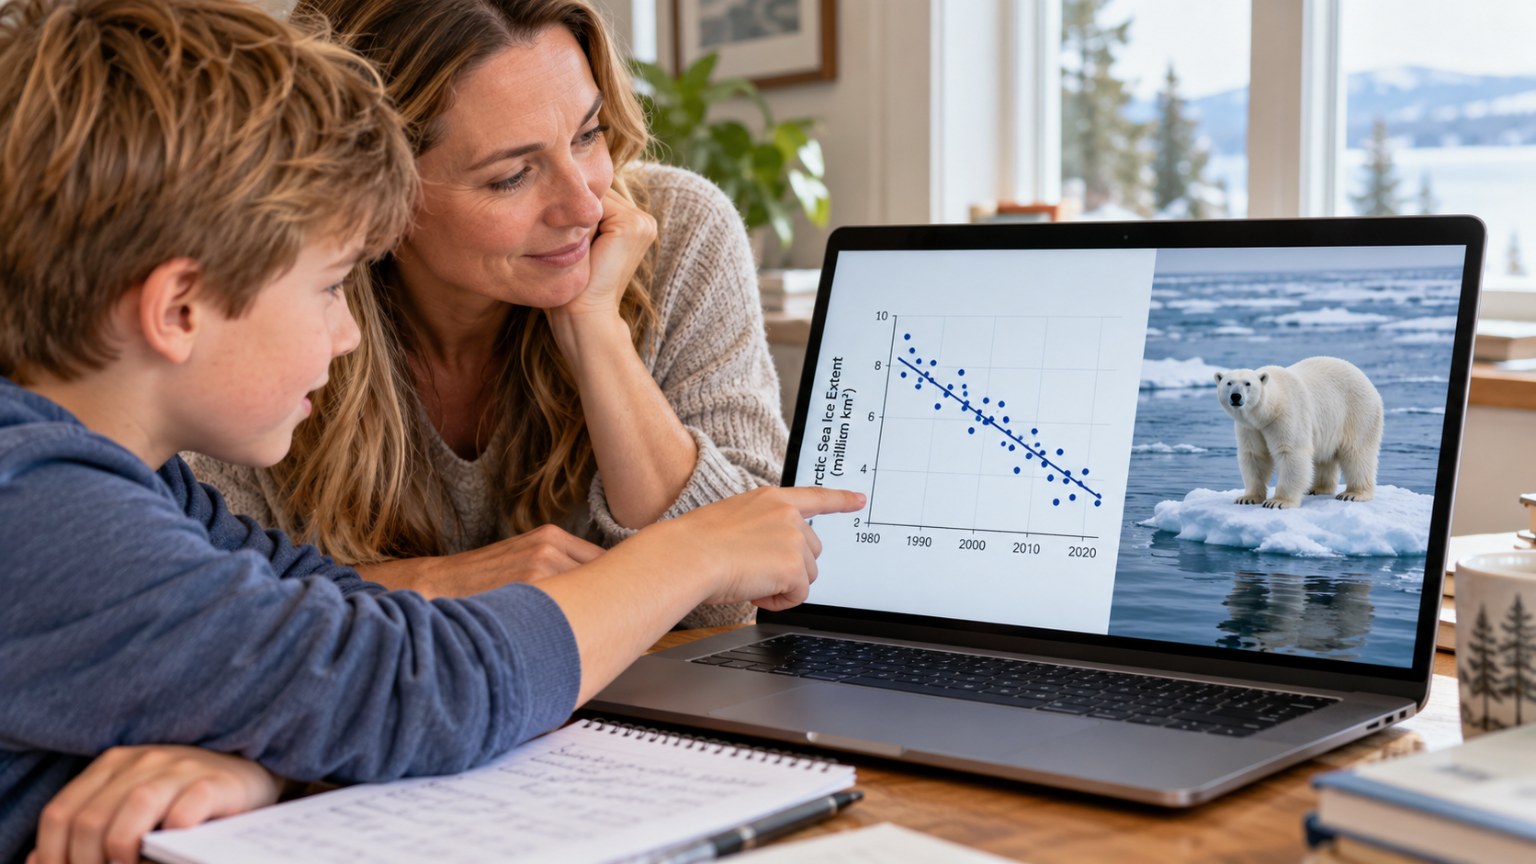
Shrinking Arctic Sea Ice: Scatter Plot and Trend Line for Polar Bear Habitat
Model the decline of Arctic sea ice with a trend line.
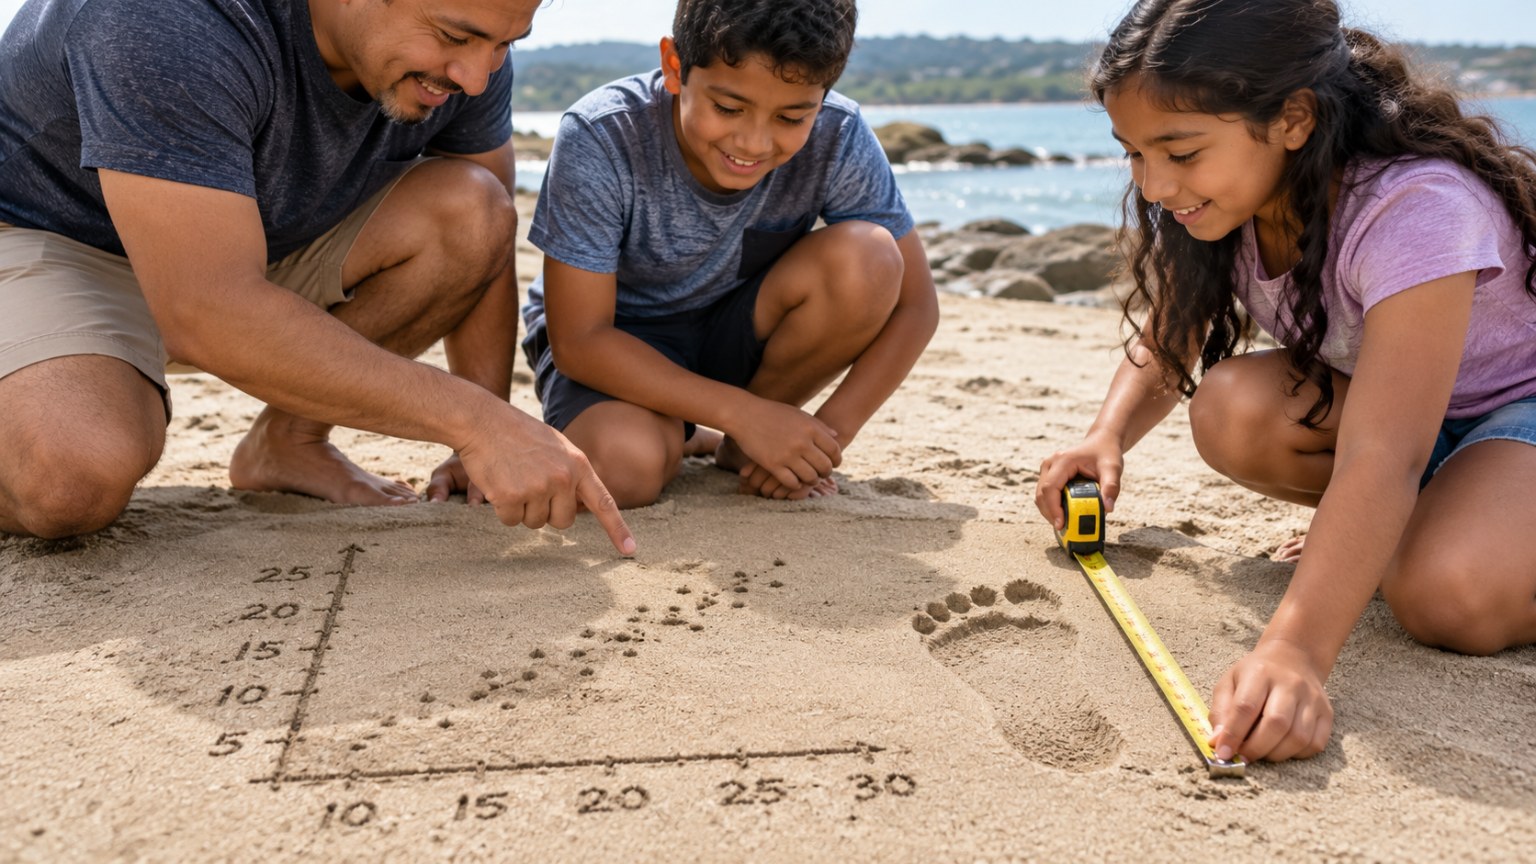
Forensic Footprint Math: Estimate Height from Foot Length with a Scatter Plot
Use a line of best fit to estimate height from a footprint.
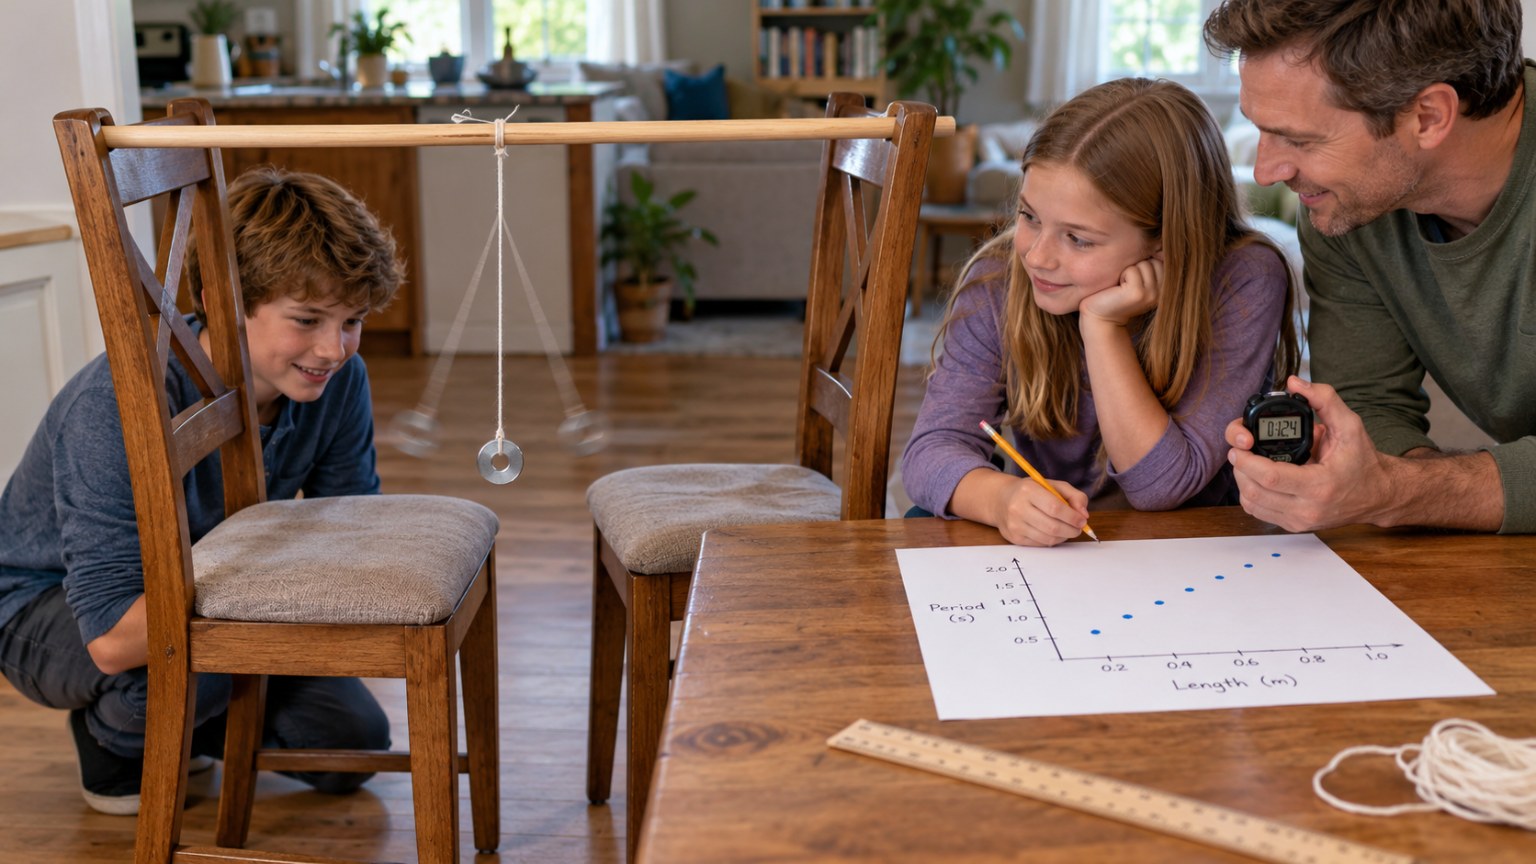
Benjamin Banneker's Clock: Pendulum Length vs. Swing Time Lab
Time a pendulum at five lengths and graph a curved pattern.
Related standards with lesson plans: 8.SP.1.
See all grade 8 Common Core standards
Make a lesson like this in a minute
Pick a topic, grade, group size and length. Resource Portal AI writes the objectives, materials, steps and pictures.
Sign up FREEFree forever · no credit card needed. Members get all 5,100+ lessons for $14.99/month, with the first 7 days free.