Lesson planBenjamin Banneker's Clock: Pendulum Length vs. Swing Time Lab
Science50 minutesGrades: 8th
Overview
Time a pendulum at five lengths and graph a curved pattern.
Description
Your teen learns how Benjamin Banneker built a working wooden striking clock around 1753, then times a homemade pendulum at five lengths, makes a scatter plot and describes the nonlinear relationship between length and swing time.
Objective
Your teen will collect bivariate data on pendulum length and period, construct a scatter plot, and describe the association as positive and nonlinear, connecting it to clock design.
Standards
8.F.5Math · Grade 8 · Functions Describe qualitatively the functional relationship between two quantities by analyzing a graph (e.g., where the function is increasing or decreasing, linear or nonlinear). Sketch a graph that exhibits the qualitative features of a function that has been described verbally.
8.SP.1Math · Grade 8 · Statistics & Probability Construct and interpret scatter plots for bivariate measurement data to investigate patterns of association between two quantities. Describe patterns such as clustering, outliers, positive or negative association, linear association, and nonlinear association.
Materials
| Item | Quantity |
|---|
| String or thread | about 4 feet |
| Small weight: a washer, a few nuts or a key | 1 |
| Tape and a ruler or meter stick | 1 each |
| Table edge, doorframe or broom handle across two chairs to hang from | 1 |
| Stopwatch or phone timer | 1 |
| Graph paper and pencil | 1 sheet each |
Vocabulary
Pendulum
A weight hanging from a fixed point that swings back and forth.
Period
The time for one full swing out and back.
Scatter plot
A graph of paired data points used to look for patterns.
Nonlinear
A relationship whose graph is not a straight line.
Preparation
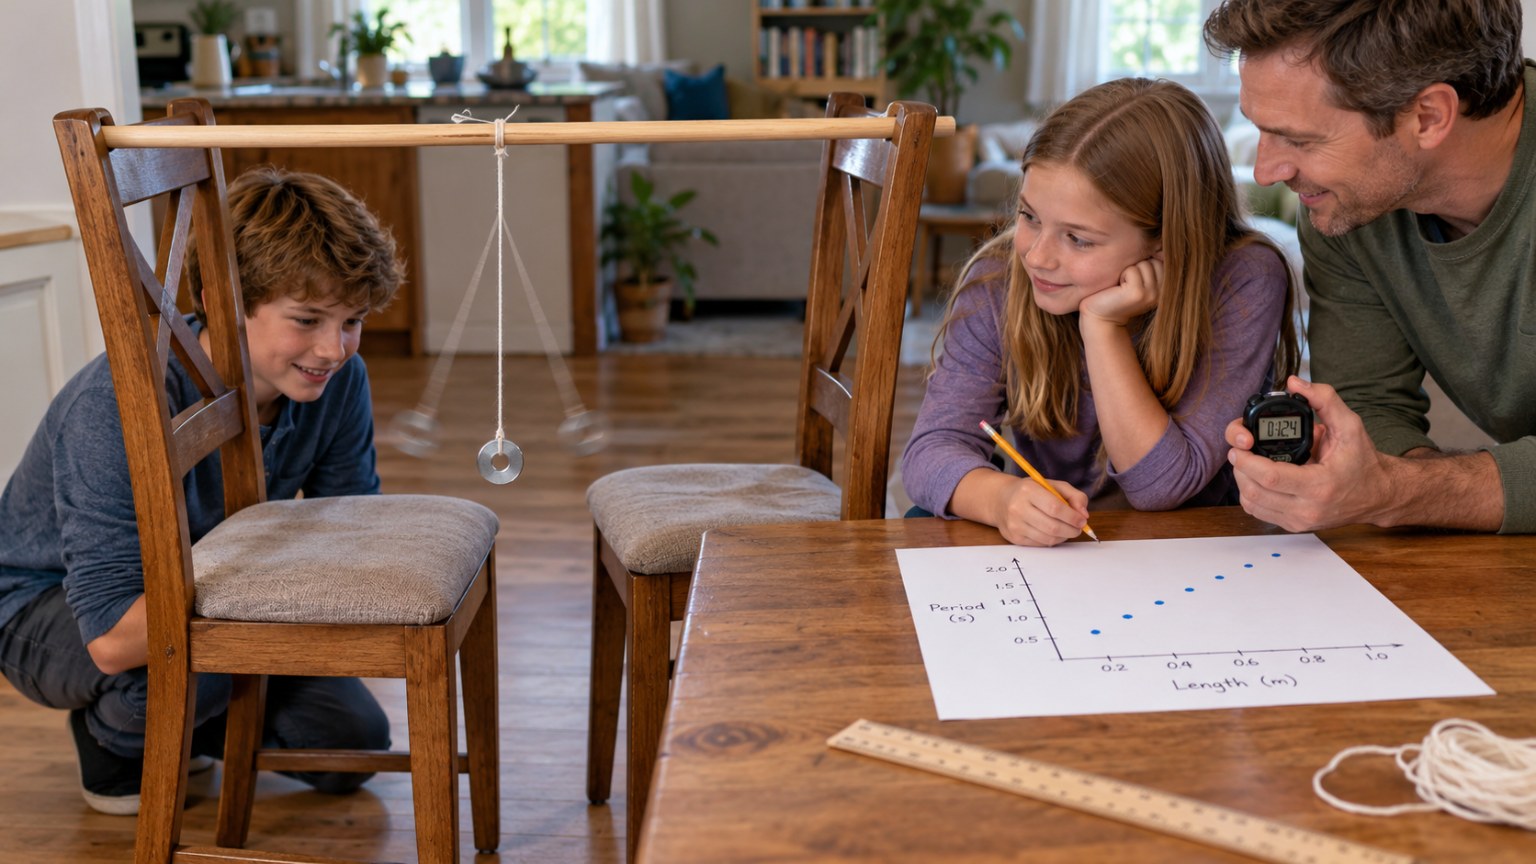
- Tie the weight to the string. Tape the free end to a table edge or broom handle so the weight swings freely without hitting anything.
- Mark the string at 20, 40, 60, 80 and 100 cm from the hanging point to the middle of the weight. Copy the data table from the sections below.
Introduction
Start the pendulum swinging and ask your teen to count seconds aloud. Then shorten the string and swing again. Ask: did it speed up? Clockmakers for centuries had to figure out exactly how long to make a pendulum.
What do you think happens to swing time if the string is twice as long?
Why would a clock need something that swings at a steady rate?
Steps
1Step 1
Meet Benjamin Banneker
(7 min) Read 'About Benjamin Banneker' together. Ask your teen to list three different kinds of work he did and to explain why building a clock from scratch, with no factory parts, was so impressive.
2Step 2
Time the swings
(15 min) Start with the 20 cm length. Pull the weight back a small amount (about 15 degrees), let go without pushing, and time 10 full swings; divide by 10 to get the period. Repeat for 40, 60, 80 and 100 cm, recording each in the table.
3Step 3
Plot the data
(10 min) Your teen makes a scatter plot with length (cm) on the x-axis and period (seconds) on the y-axis, choosing a sensible scale. They plot all five points.
4Step 4
Describe the pattern
(10 min) Your teen describes the association: positive or negative, linear or nonlinear, and where the graph rises quickly or slowly. They check: when the length went from 20 to 80 cm (4 times longer), did the period double?
5Step 5
Connect to clocks
(6 min) Using the graph, estimate the length needed for a 2-second period, the 'seconds pendulum' in tall case clocks. Compare it with the known answer of about 99 cm.
Conclusion
Ask: why can't a clockmaker just guess a pendulum's length? Banneker had no formula book to copy from; he studied, measured and adjusted until his clock kept time.
Make your own lesson plan in minutes
Describe a topic and Resource Portal AI writes the objectives, materials and steps for your group.
Try Resource Portal AI