
Lesson plans for 8.F.5
Math · Grade 8 · Functions
Describe qualitatively the functional relationship between two quantities by analyzing a graph (e.g., where the function is increasing or decreasing, linear or nonlinear). Sketch a graph that exhibits the qualitative features of a function that has been described verbally.
11 ready-to-teach lesson plans aligned to this standard. Each includes objectives, a materials list, vocabulary and step-by-step activities.
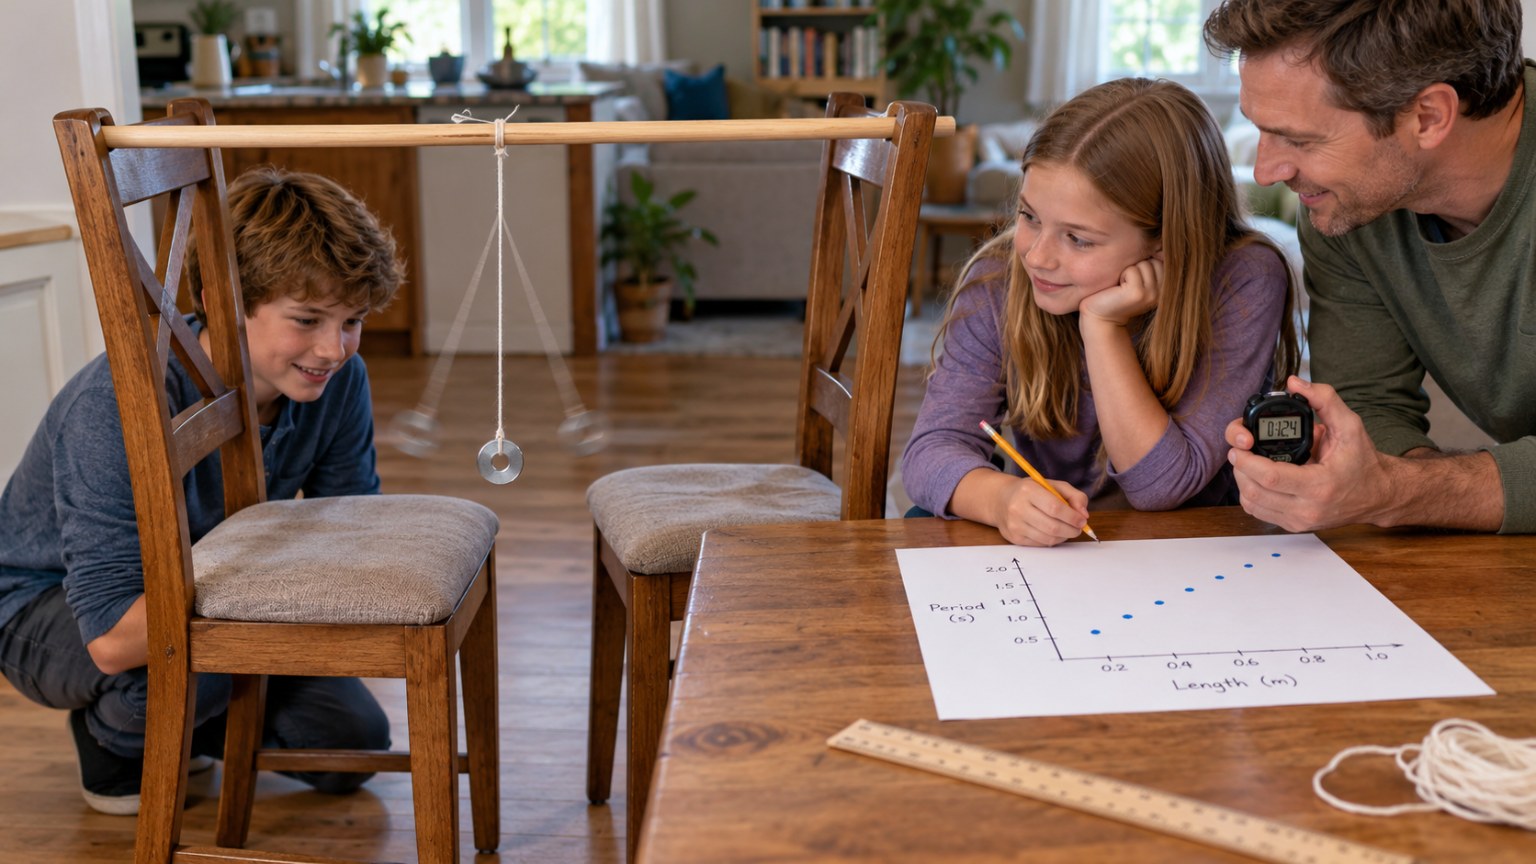
Benjamin Banneker's Clock: Pendulum Length vs. Swing Time Lab
Time a pendulum at five lengths and graph a curved pattern.
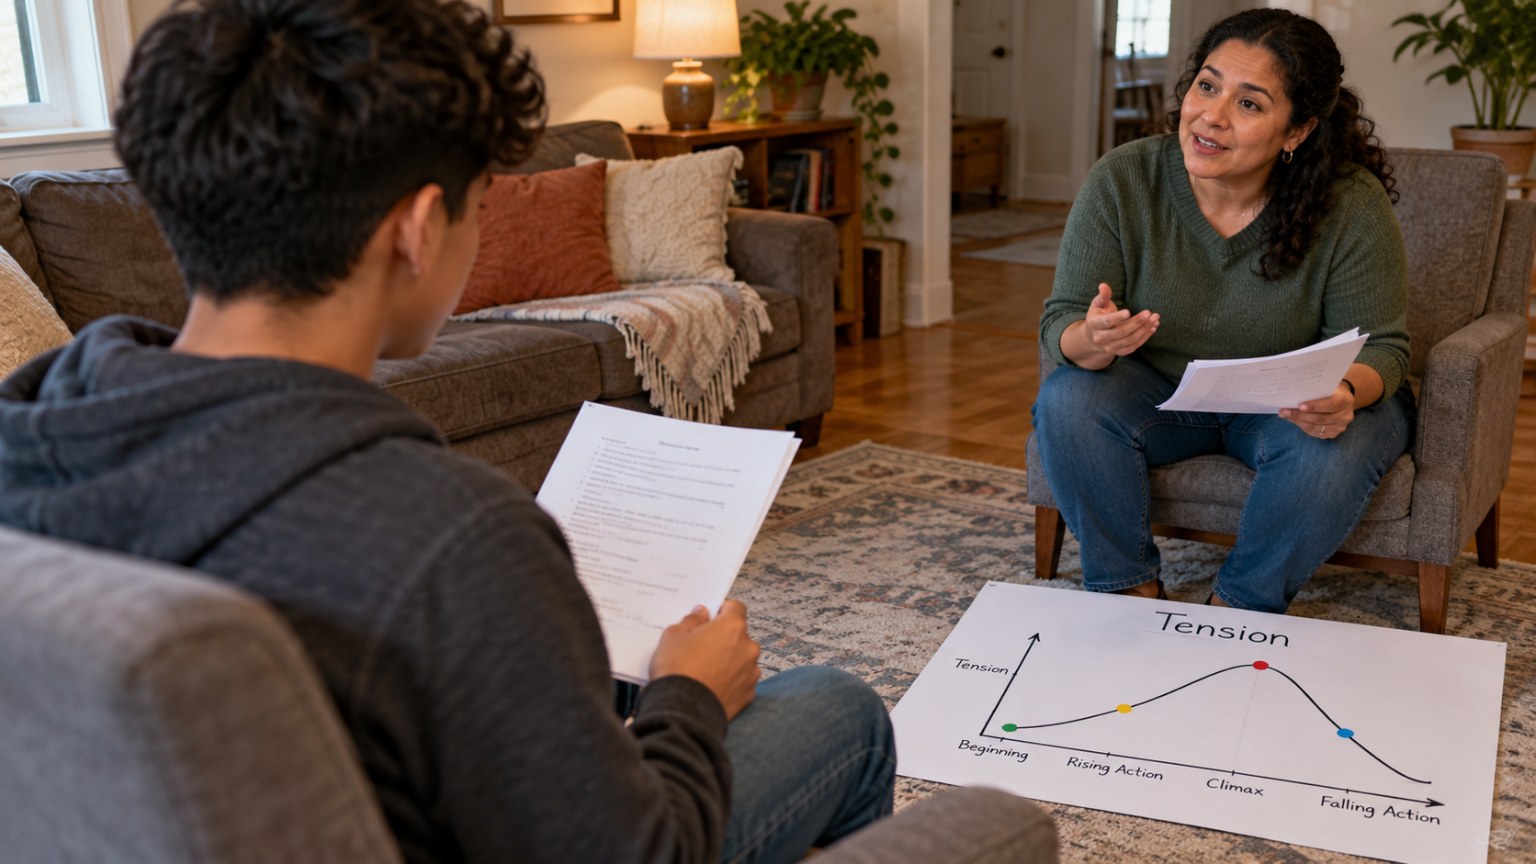
Act the Graph: Perform a Scene That Matches a Tension Curve
Graph a scene's tension, then act it out.
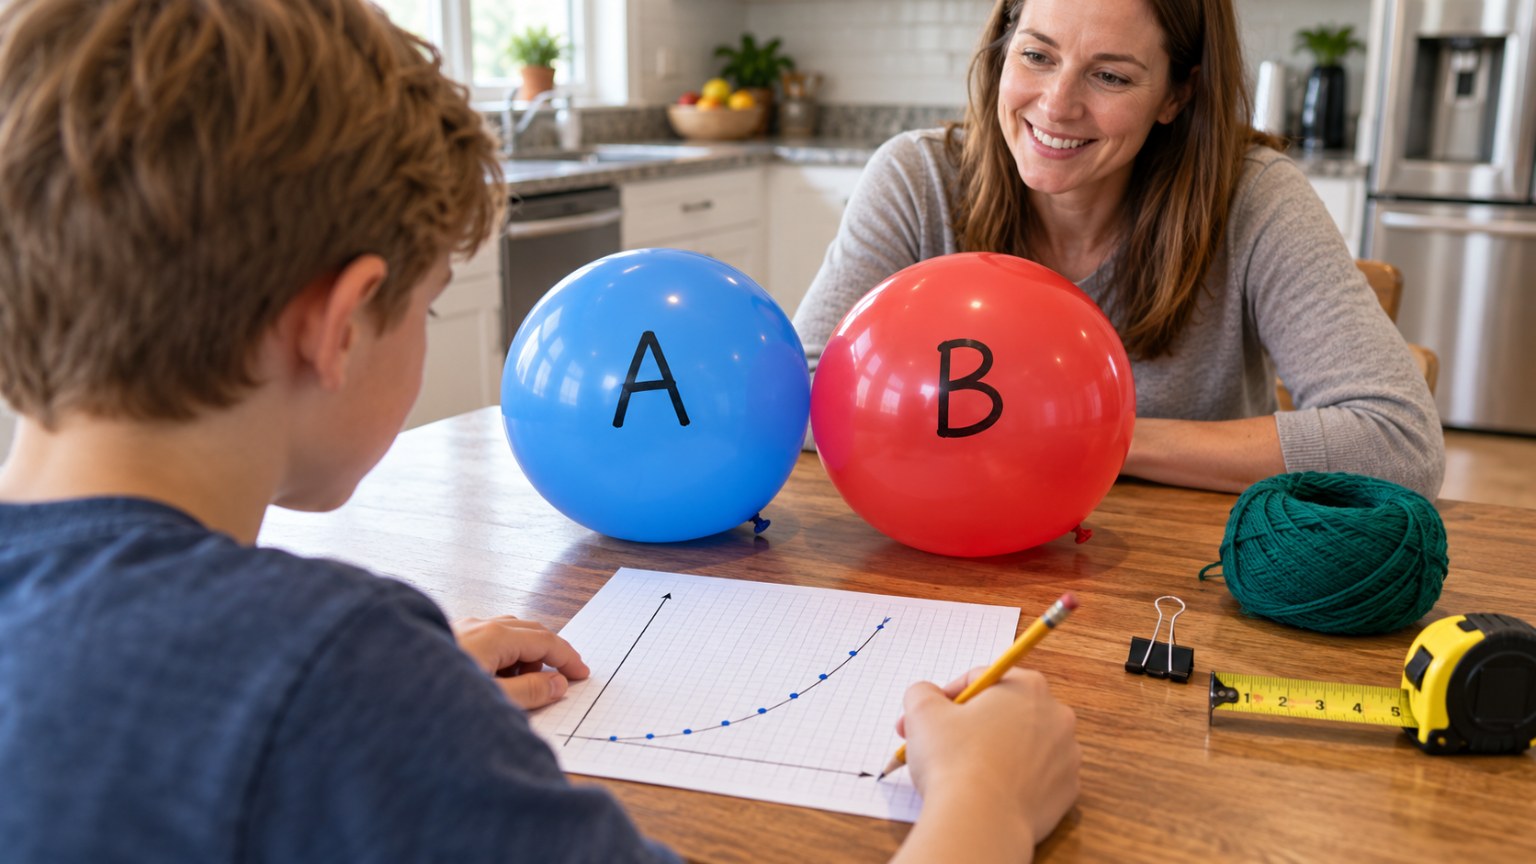
Breath by Breath: A Balloon Circumference Scatter Plot
Measure a balloon breath by breath and graph the curve.
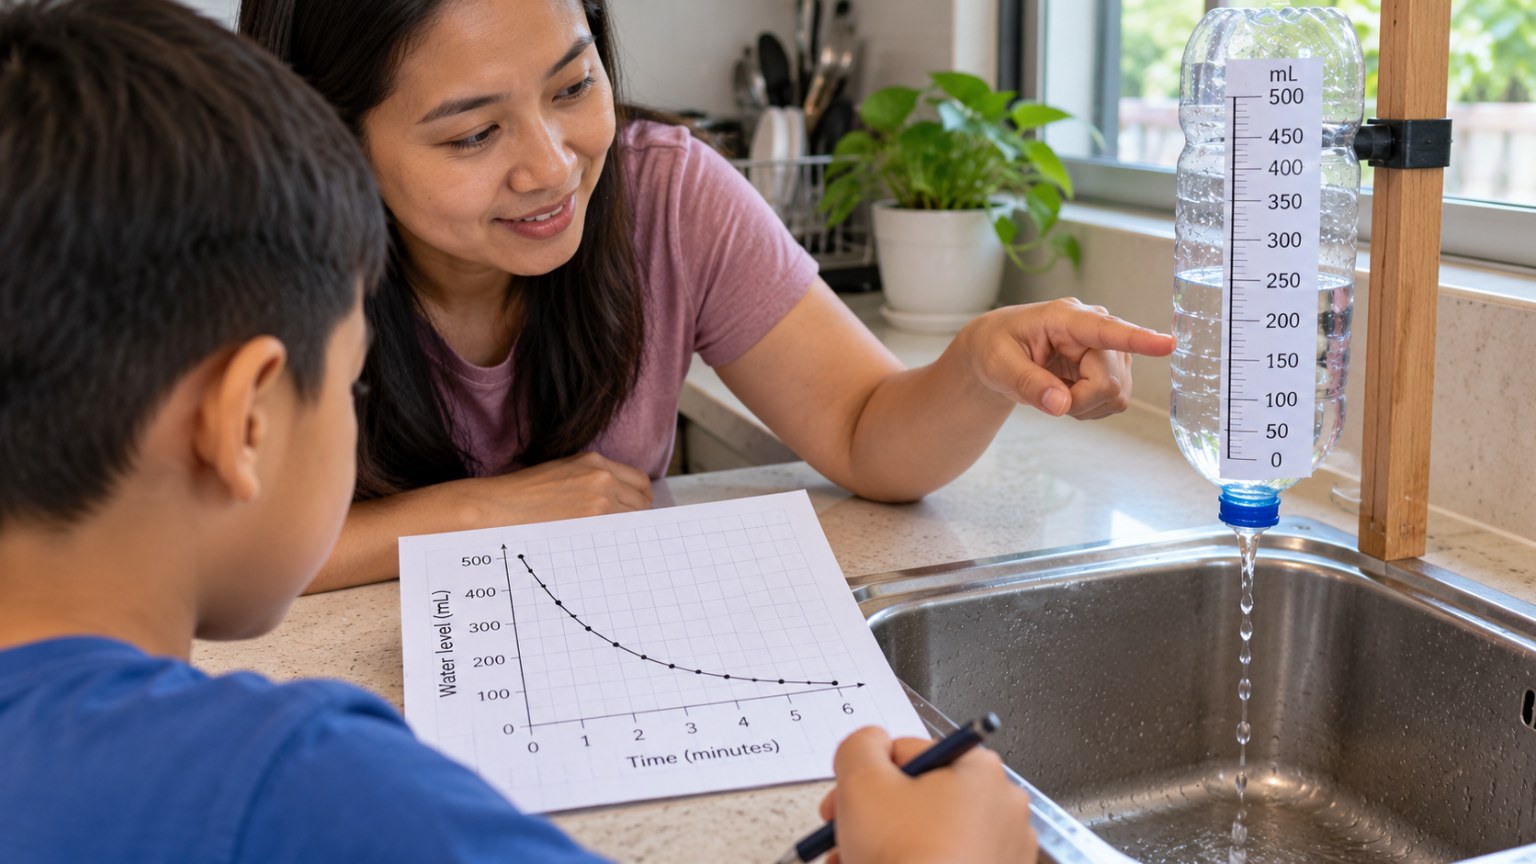
Draining Bottle: Is the Water Level Falling in a Straight Line?
Graph a draining bottle and explain the curve.
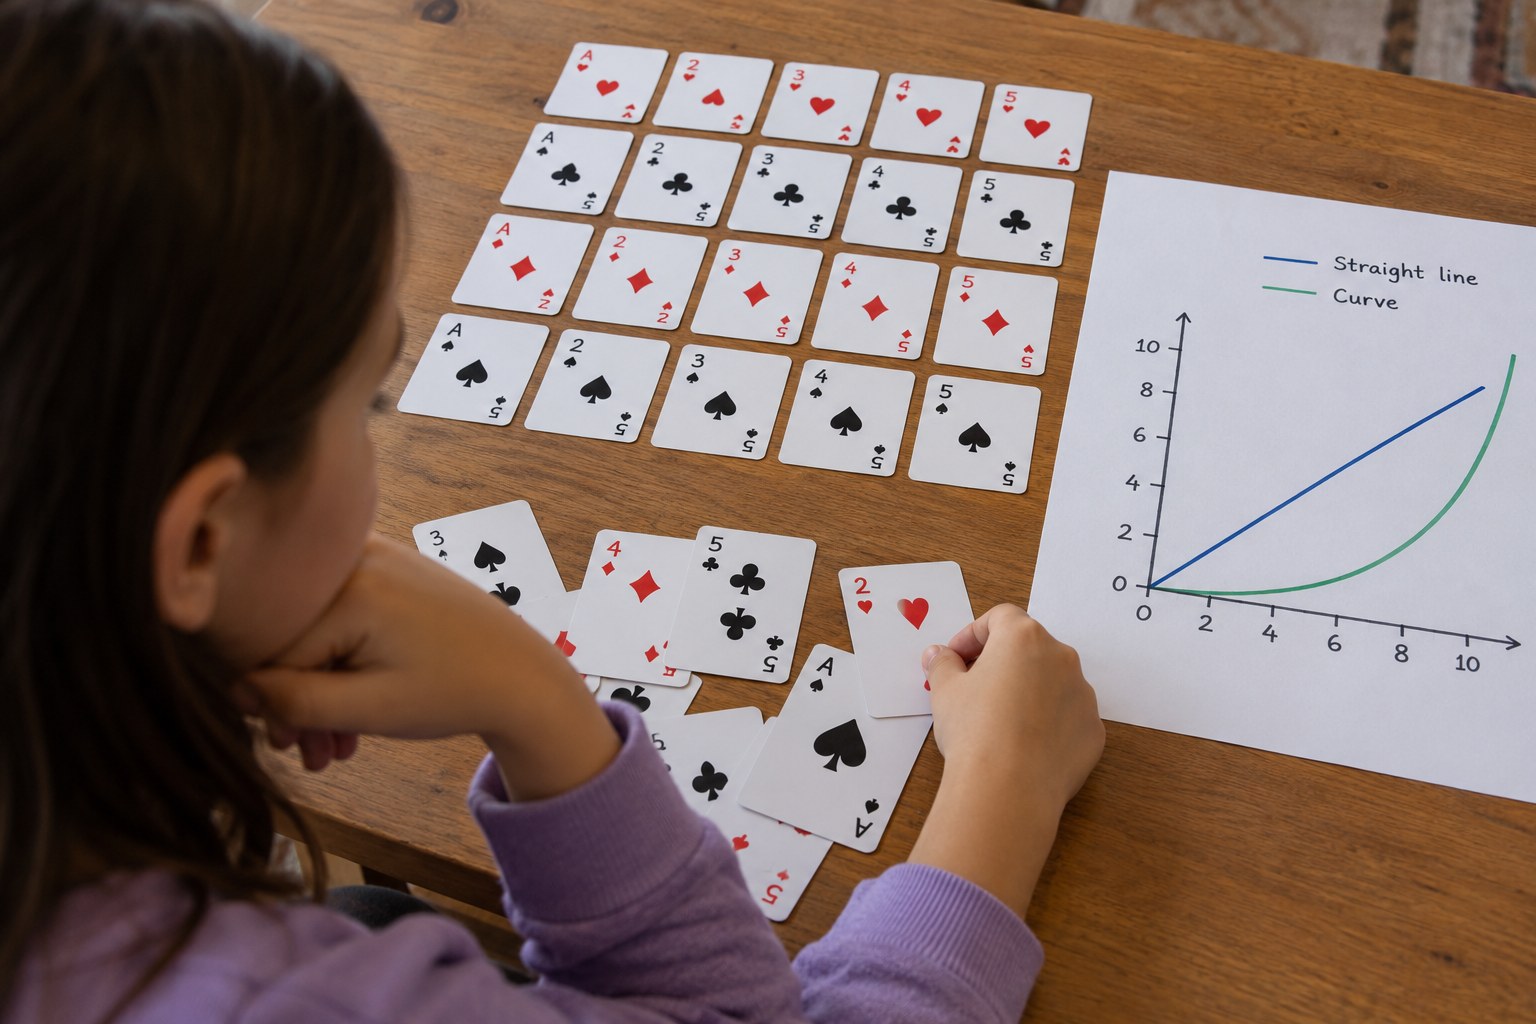
Sorting Robot Algorithm Race: Counting Comparisons
Count a sorting robot's comparisons and graph the growth.
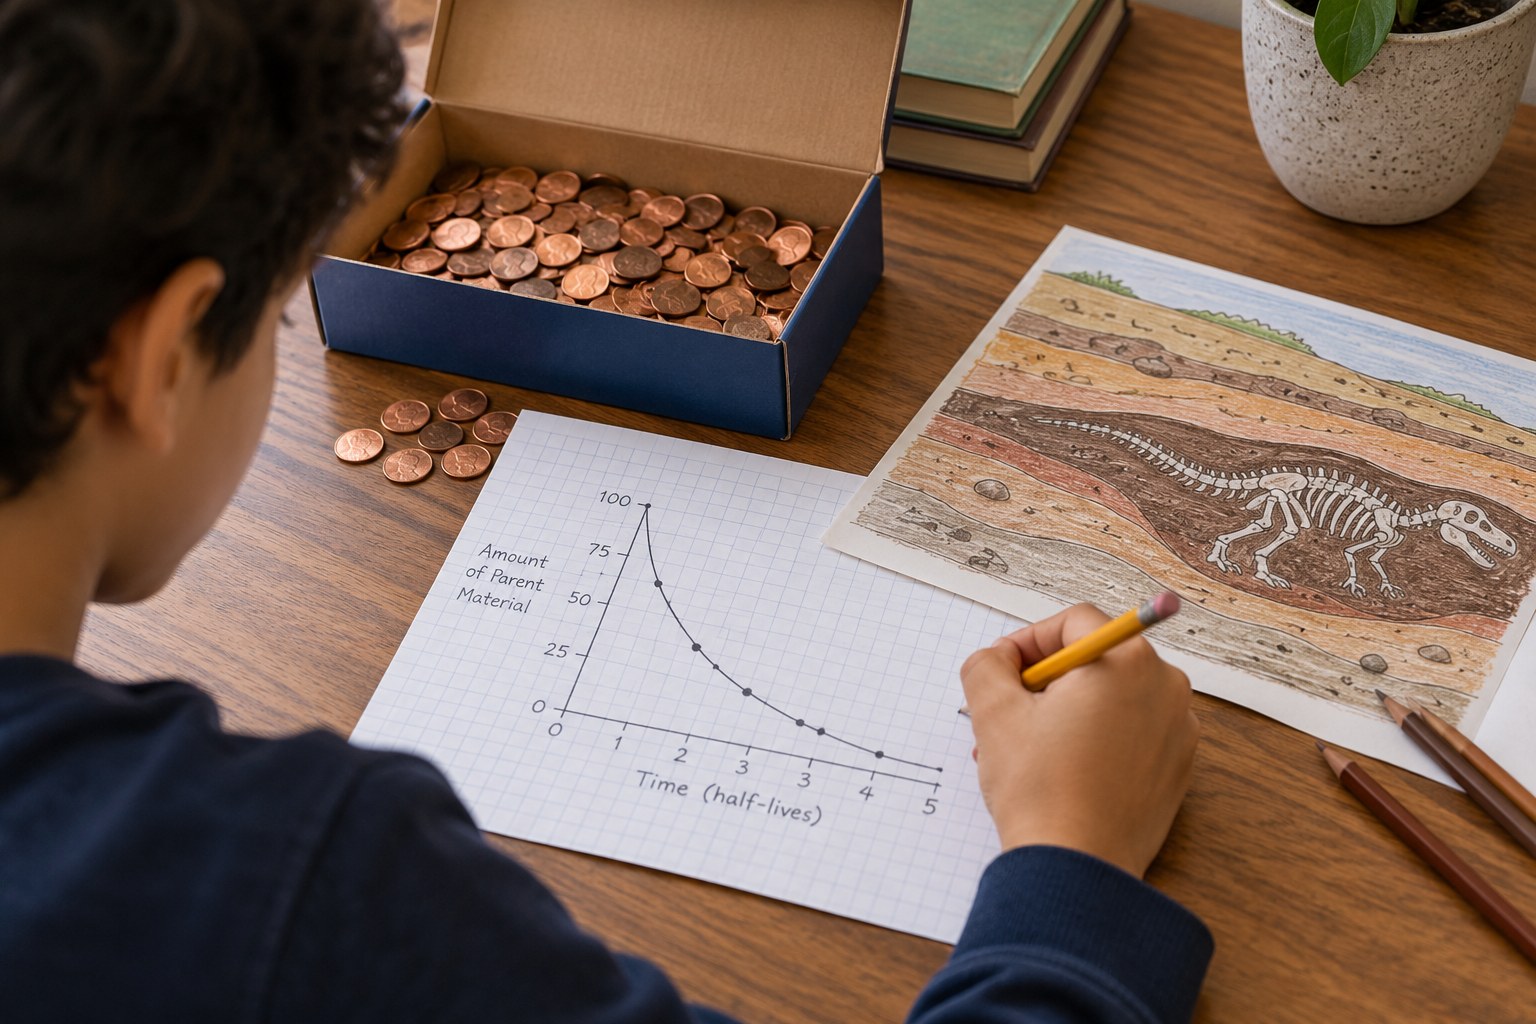
Dating Dinosaur Rocks: A Half-Life Coin Model
Model radioactive decay with coins to see how fossils get their dates.
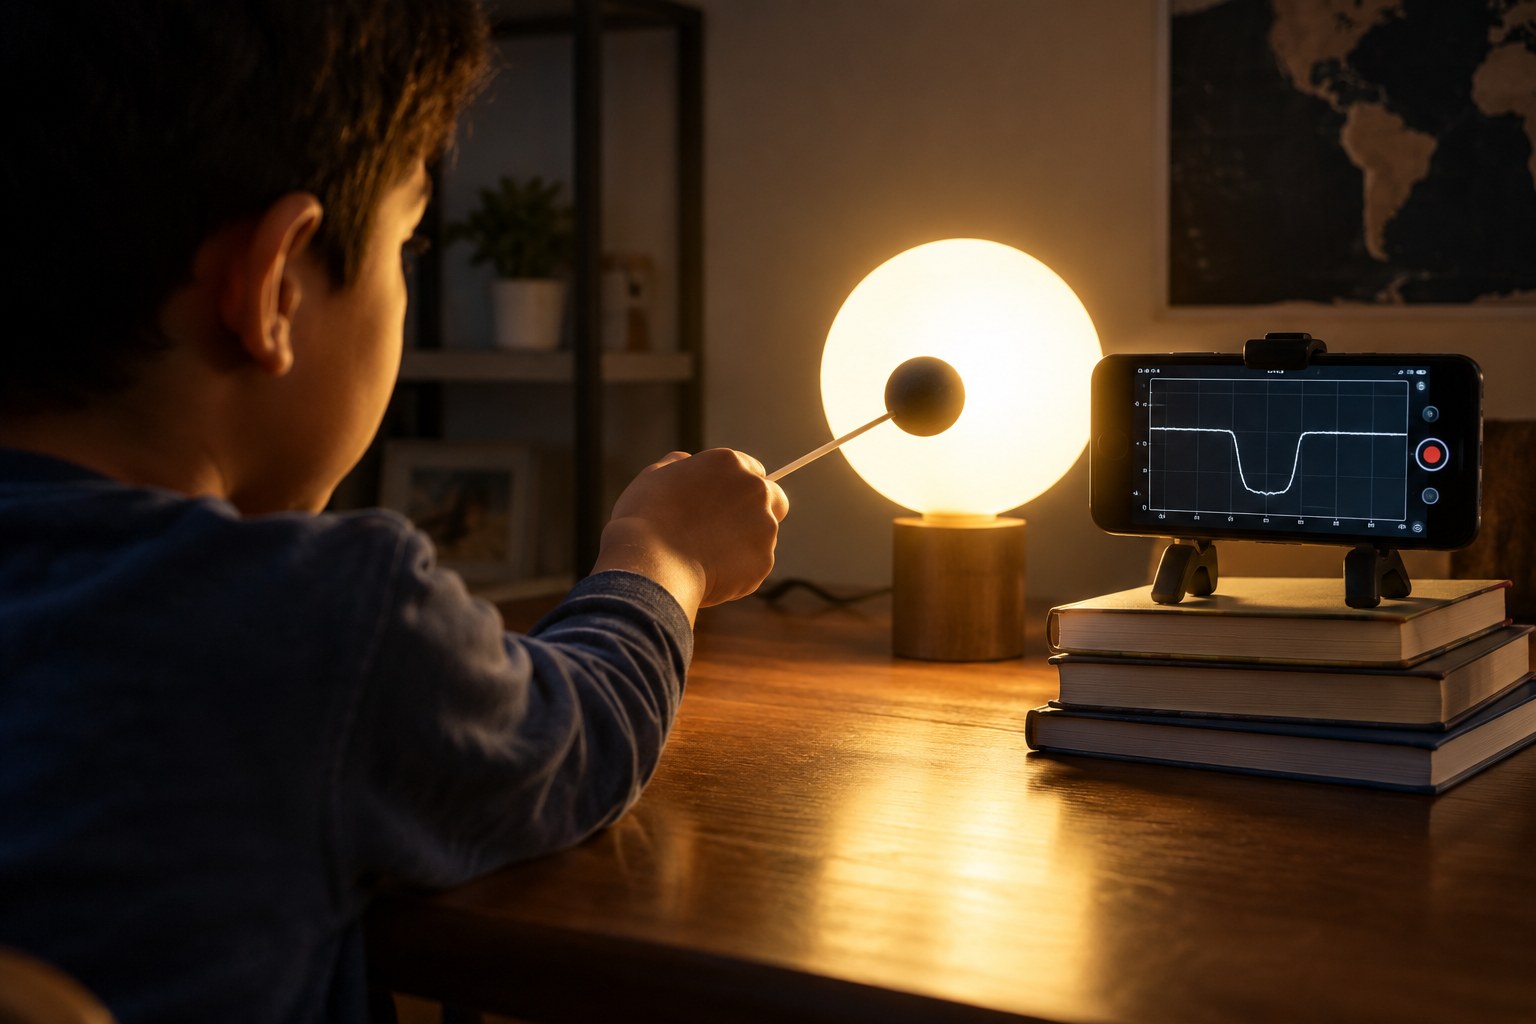
Hunting Exoplanets: Model a Transit and Graph the Light Curve
Find a hidden planet by graphing how a star dims.
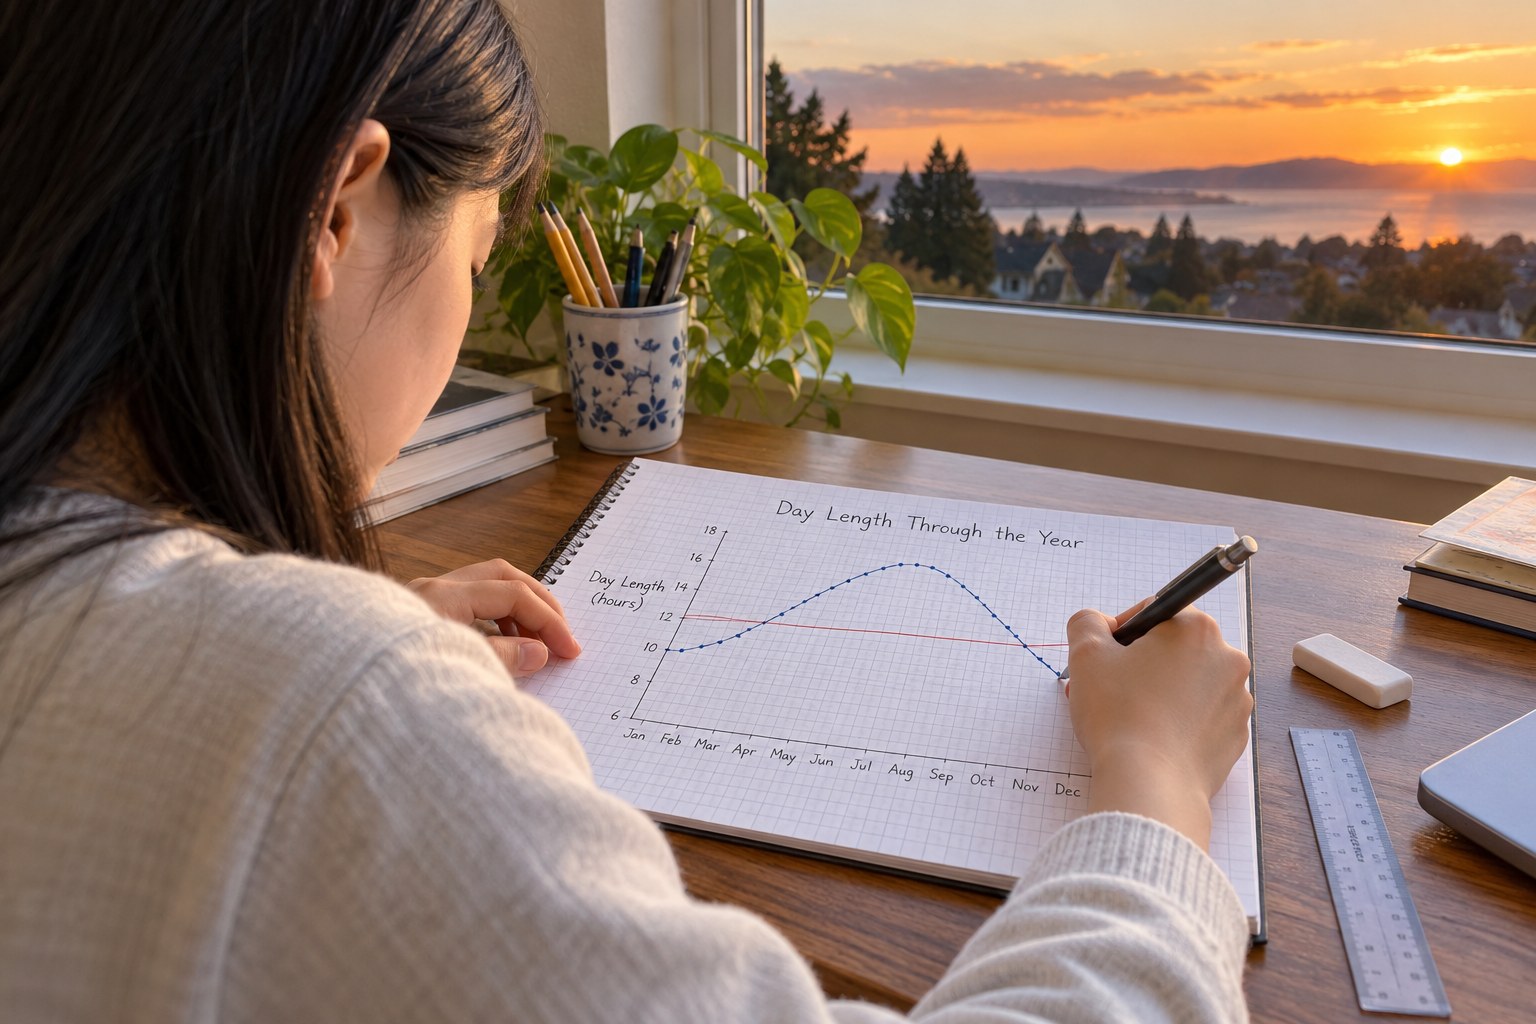
Spring Daylight Gain: Linear Model or Not?
Model spring's growing daylight and find where the line breaks.
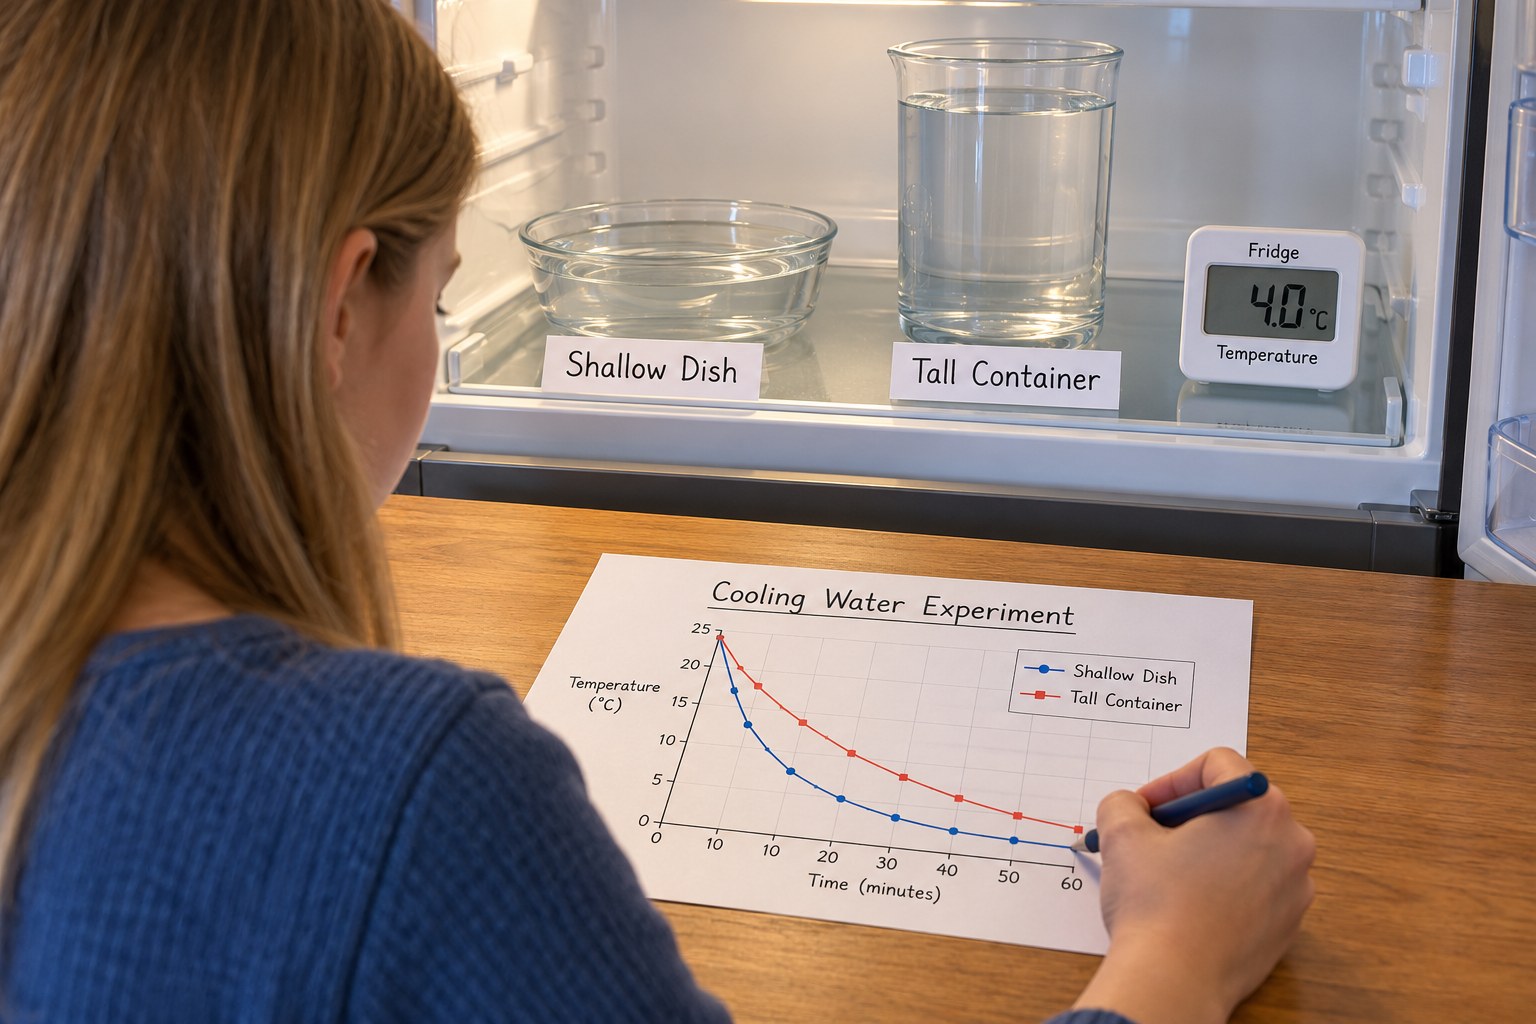
Thanksgiving Leftovers Science: Cooling Curves and the Danger Zone
Graph cooling curves to learn how to store leftovers safely.
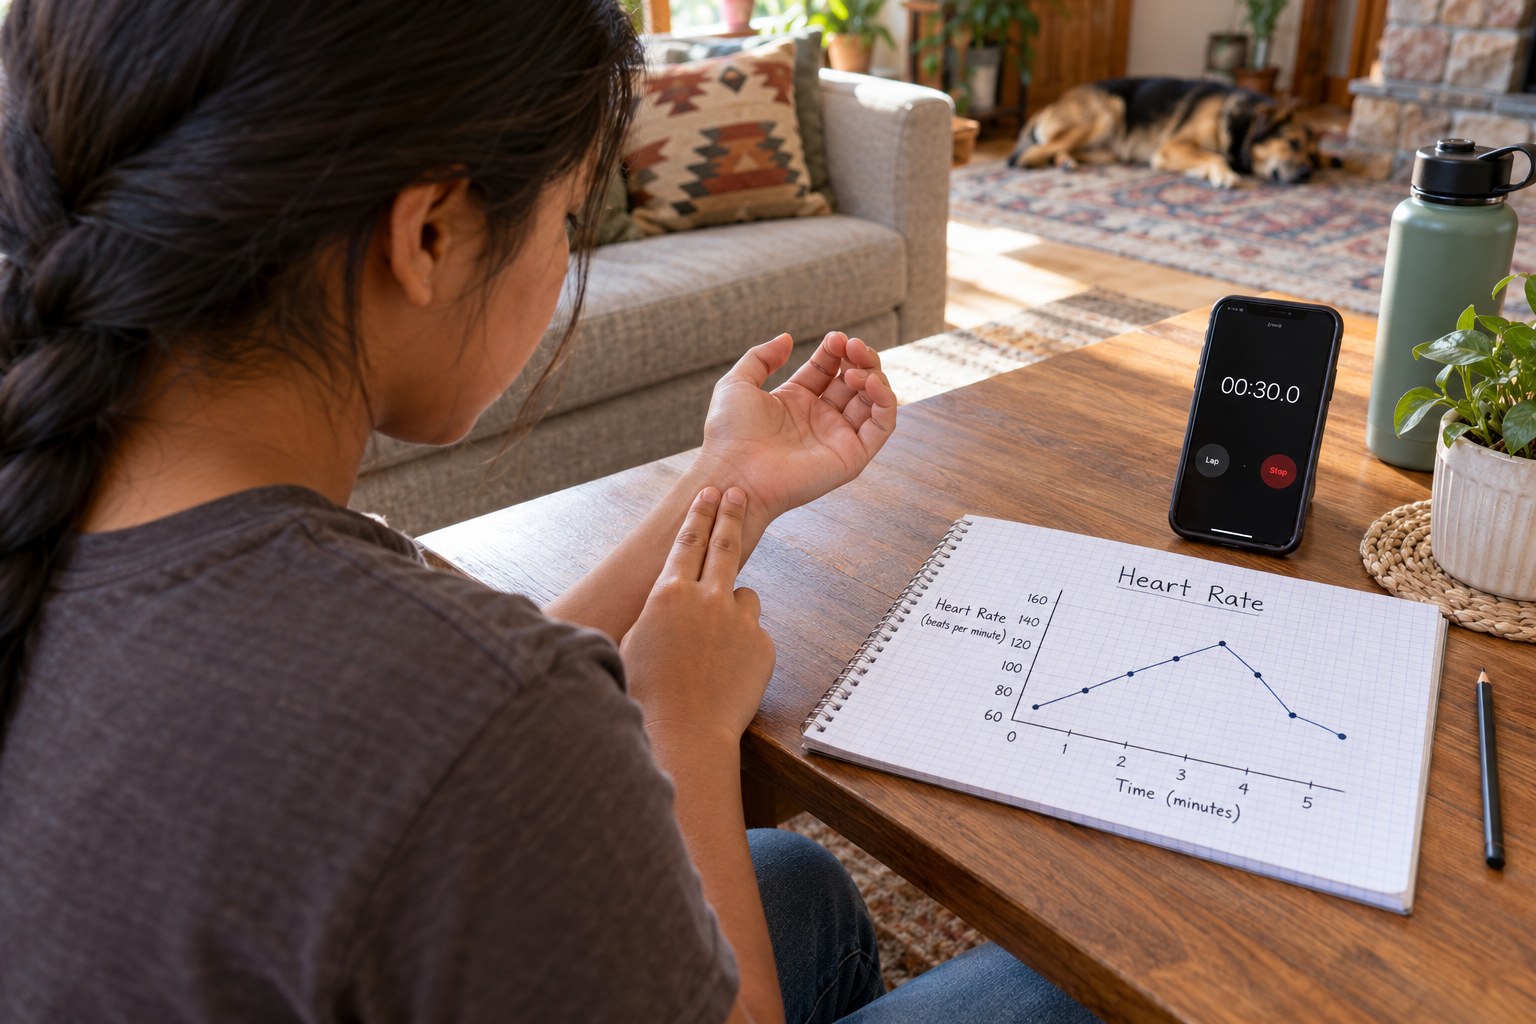
Heart Rate Recovery: Graph How Fast Your Pulse Settles
Graph your heart rate rising and recovering after exercise.

Story Graphs: Sketching a Bike Ride, a Bath and a Phone Battery
Turn everyday stories into quick sketch graphs.
See all grade 8 standards with lesson plans
Make a lesson like this in a minute
Pick a topic, grade, group size and length. Resource Portal AI writes the objectives, materials, steps and pictures.
Sign up FREEFree forever · no credit card needed. Members get all 5,100+ lessons for $14.99/month, with the first 7 days free.