Lesson planValentine Chocolate Melt Test: Data and Variability
Science45 minutesGrades: 6th, 7th
Overview
Time melting chocolate and compare the data with box plots.
Description
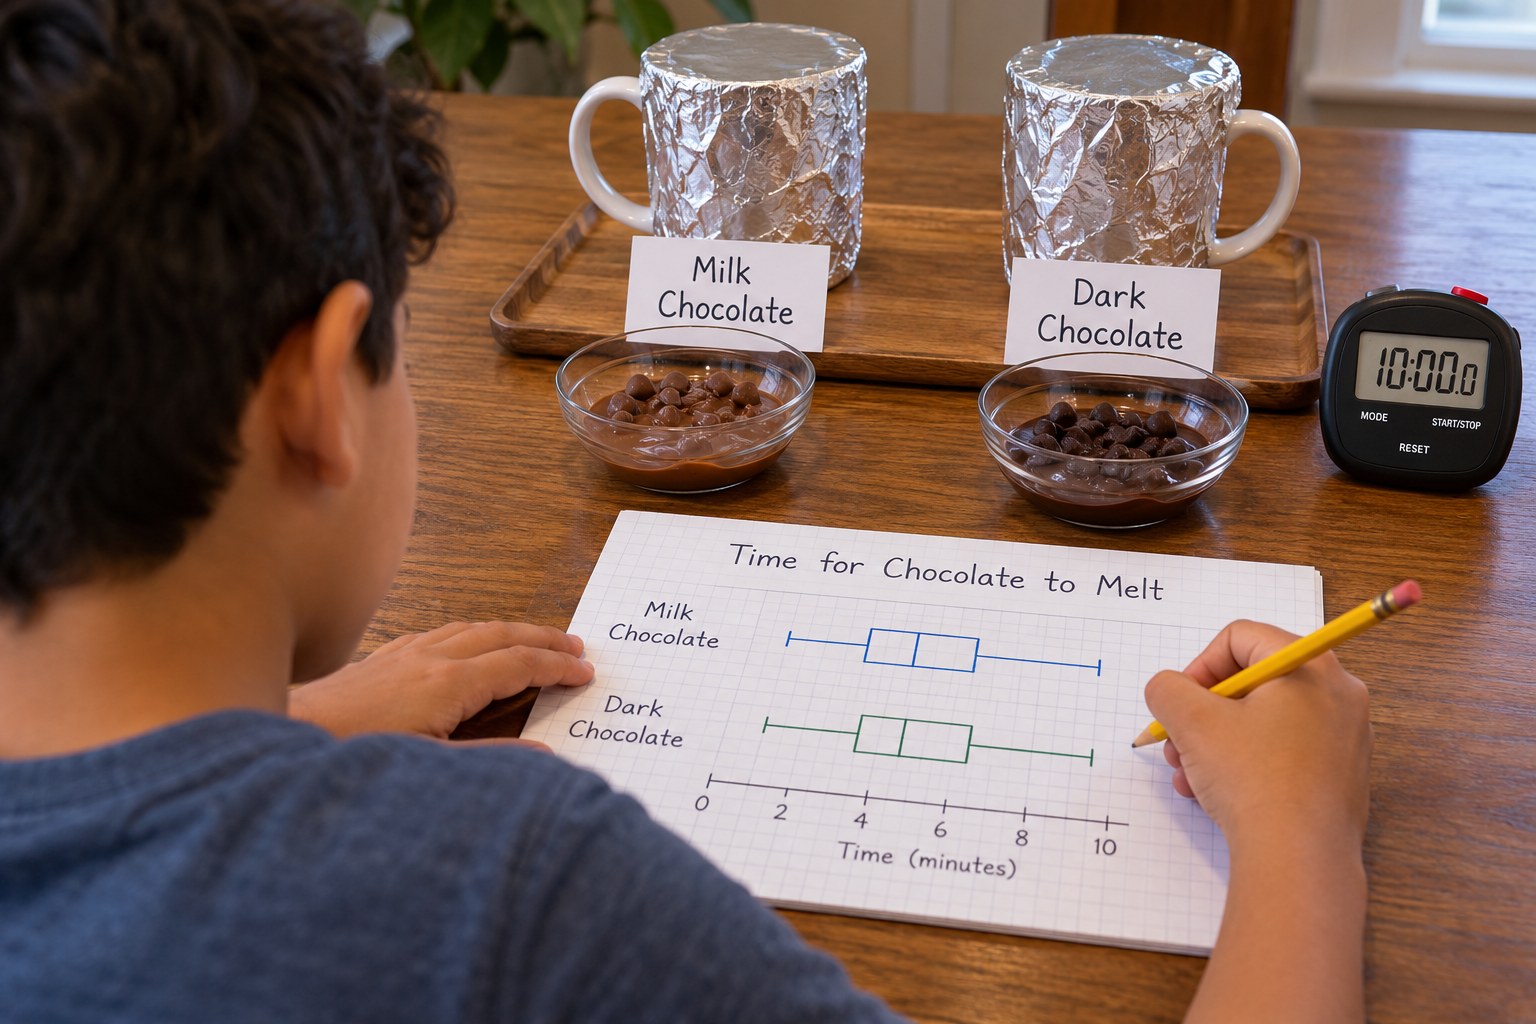
Your teen runs a fair test timing how fast milk and dark chocolate chips melt on a foil-covered mug of hot water, records 10 trials of each, and compares the results with dot plots, box plots, median and interquartile range.
Objective
Your teen will design and run a controlled test, display the data in dot plots and box plots, and compare the groups using the median, interquartile range and any outliers.
Standards
6.SP.4Math · Grade 6 · Statistics & Probability Display numerical data in plots on a number line, including dot plots, histograms, and box plots.
6.SP.5cMath · Grade 6 · Statistics & Probability Giving quantitative measures of center (median and/or mean) and variability (interquartile range and/or mean absolute deviation), as well as describing any overall pattern and any striking deviations from the overall pattern with reference to the context in which the data were gathered.
Materials
| Item | Quantity |
|---|
| Milk chocolate chips | about 12 |
| Dark or semi-sweet chocolate chips | about 12 |
| Mugs | 2 |
| Hot tap water (not boiling) | enough to fill 2 mugs, refilled as needed |
| Aluminum foil squares, about 4 by 4 inches | 4 |
| Timer or phone stopwatch, toothpicks | 1 timer and a few toothpicks |
| Kitchen thermometer (optional), paper and pencil | 1 each |
Vocabulary
Variable
Something that can change in an experiment; a fair test changes only one on purpose.
Median
The middle value when data are listed in order.
Interquartile range (IQR)
The spread of the middle half of the data: upper quartile minus lower quartile.
Outlier
A value far from the rest of the data.
Preparation
- Check for allergies (milk, soy, nuts from shared factory lines) before anyone eats the chips afterward.
- Set up a work area near the sink. Tap water should feel hot but safe to touch; never use boiling water for this test.
Introduction
Say: chocolate companies need to know how chocolate behaves when it gets warm, especially before Valentine's Day shipping. Which do you think melts faster, milk or dark chocolate, and how could we prove it with data?
What should stay the same in every trial to make it a fair test?
Why do 10 trials tell us more than 1 trial?
Steps
1Step 1
Plan a fair test
(6 min) Your teen writes a question, a hypothesis and a list of variables to keep the same, such as water temperature, foil size and chip position. They agree on a clear melting signal, like the chip slumping when gently pushed with a toothpick.
2Step 2
Run the trials
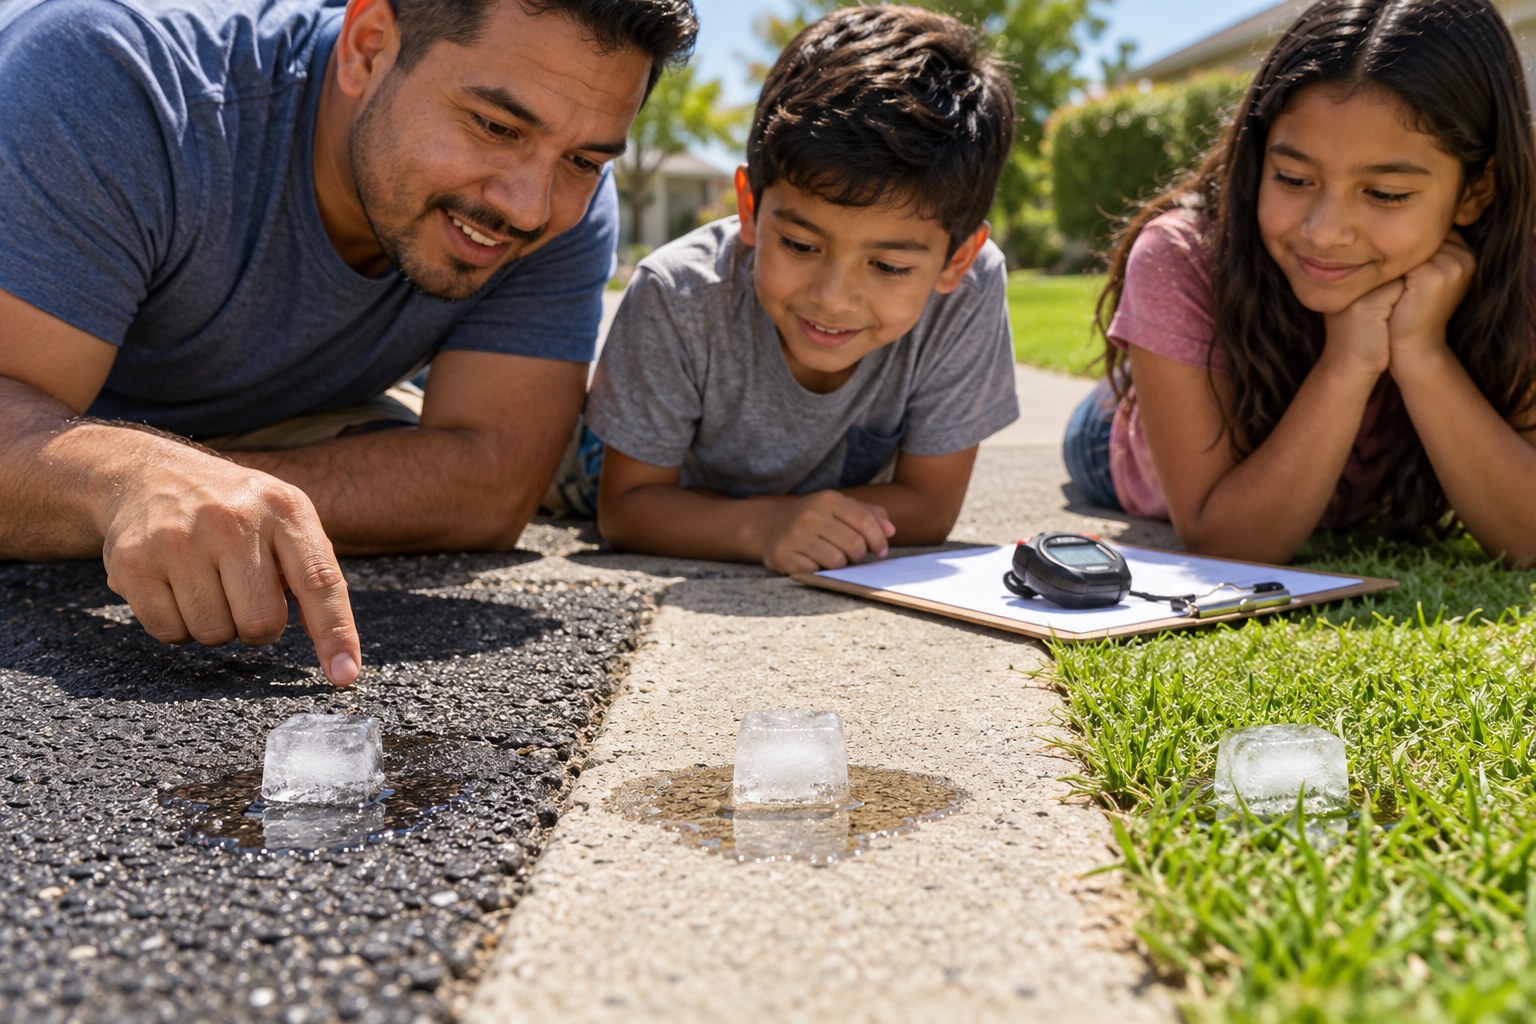
(15 min) Your teen fills both mugs with hot tap water, covers each with a foil square, places one chip on each, and starts the timer. They record seconds until each chip melts, refill with fresh hot water every 3 trials, and complete 10 trials of each type.
3Step 3
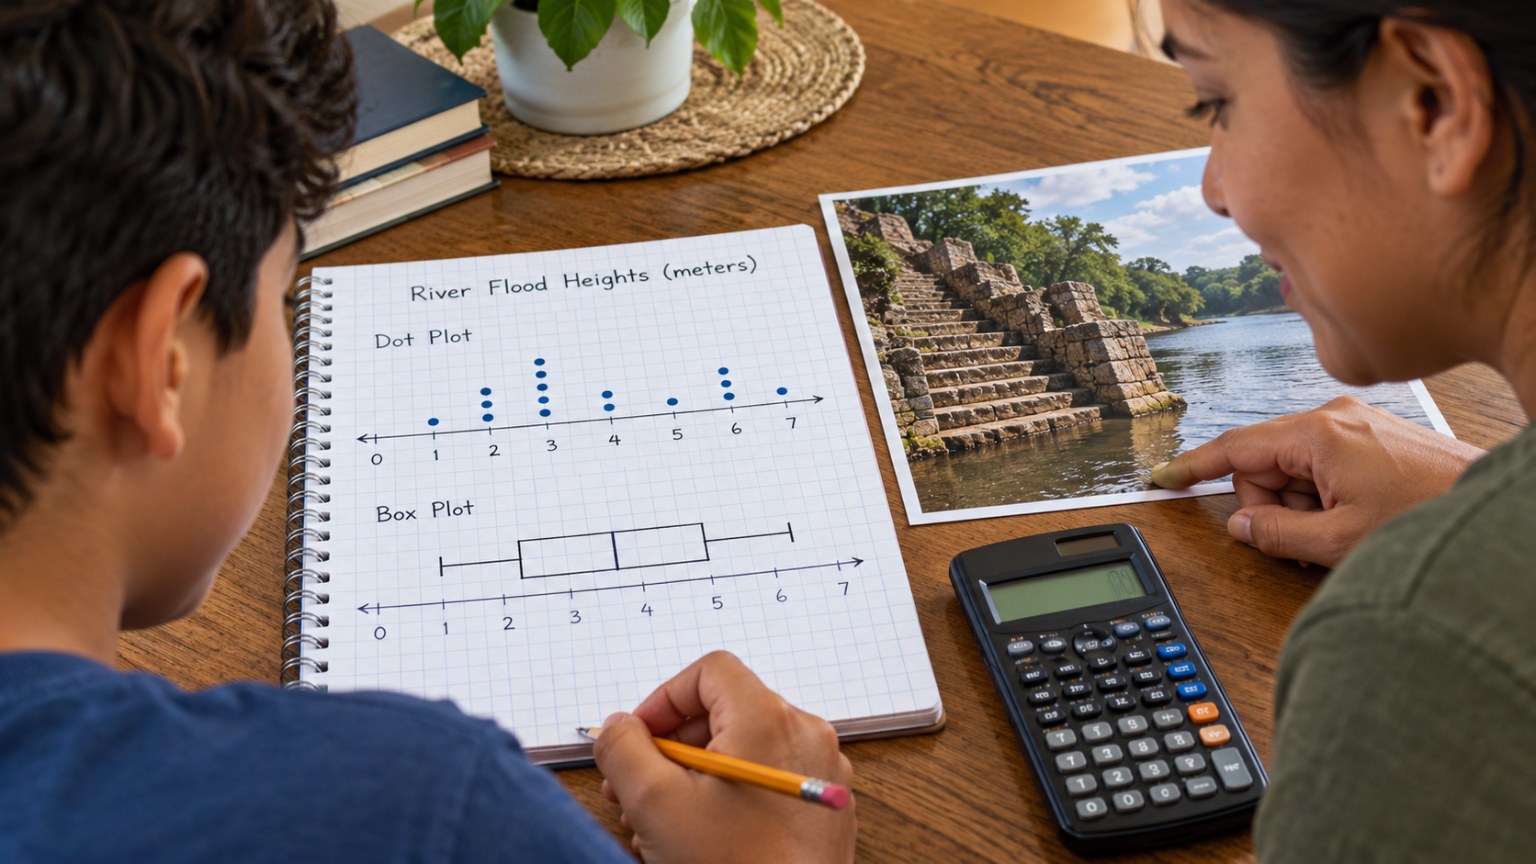
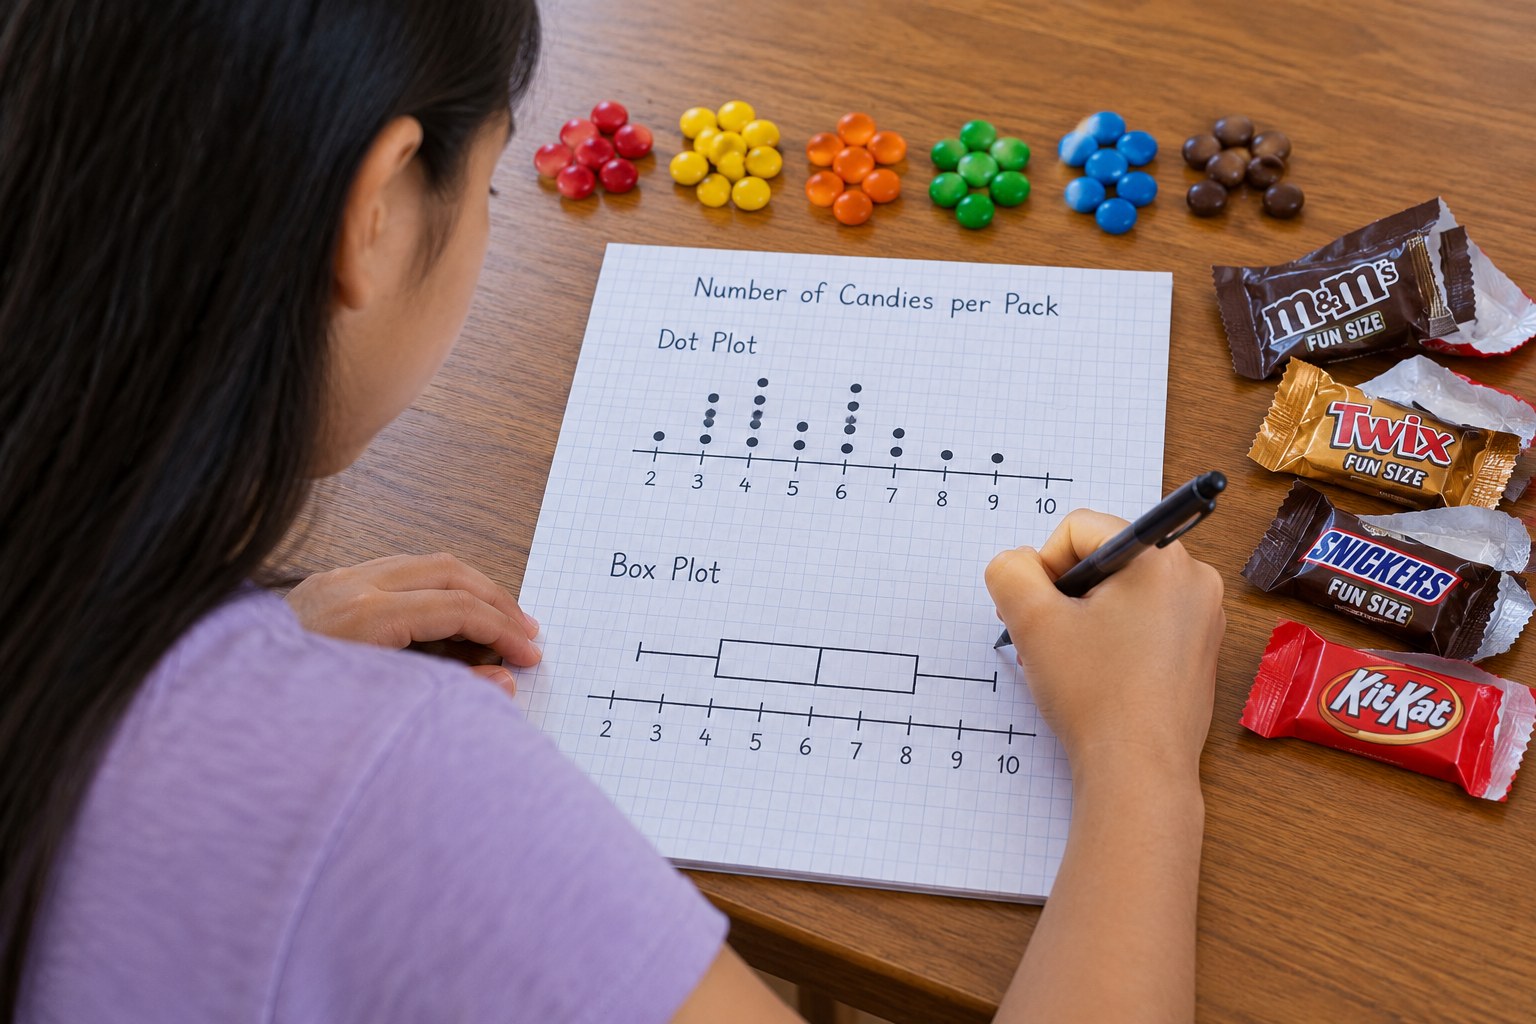
Make dot plots
(8 min) Your teen draws one number line and makes a dot plot for each chocolate type above it. They describe the shape of each plot and circle any value that looks unusual.
4Step 4
Box plots and statistics
(10 min) Your teen orders each data set and finds the minimum, lower quartile, median, upper quartile and maximum. They draw two box plots on the same scale and calculate the IQR for each.
5Step 5
Write a conclusion
(6 min) Your teen writes a 4-sentence conclusion comparing the medians and IQRs and explaining any outlier using what happened during that trial. They name one way to improve the experiment.
Conclusion
Ask: did the data support your hypothesis? Explain to a family member how the box plots made the comparison clearer than looking at a list of numbers.
Make your own lesson plan in minutes
Describe a topic and Resource Portal AI writes the objectives, materials and steps for your group.
Try Resource Portal AI