Hunting Exoplanets: Model a Transit and Graph the Light Curve
Overview
Find a hidden planet by graphing how a star dims.
Description
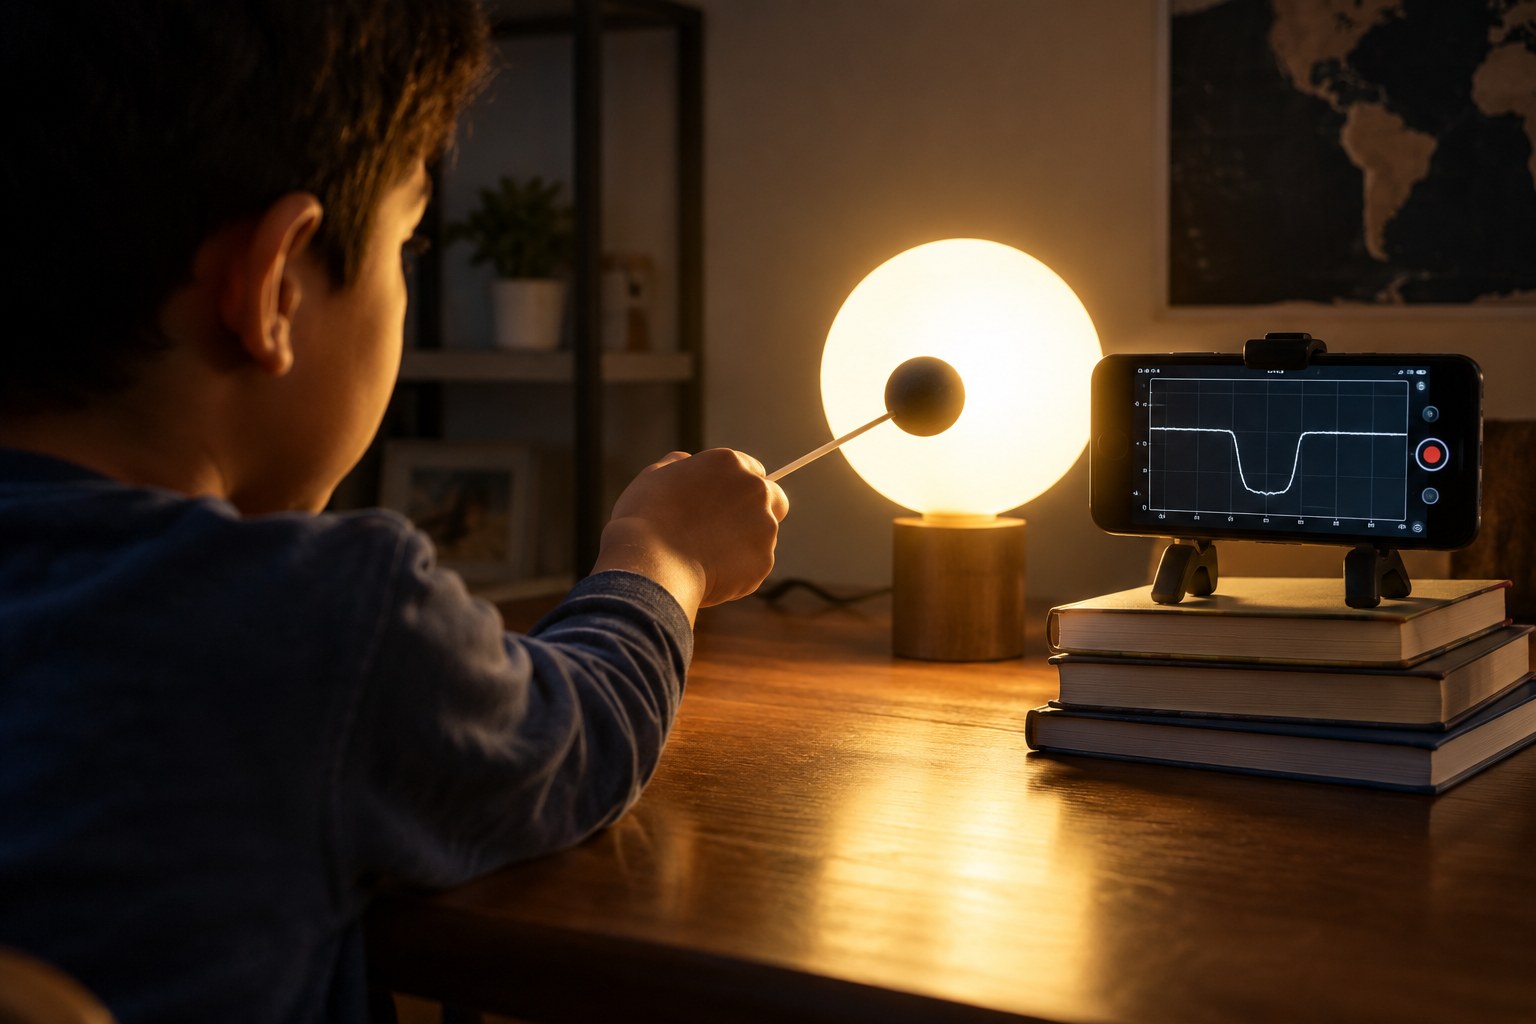
Your teen models how astronomers find planets around other stars: a lamp is the star, a ball on a stick is the planet, and a phone light-meter app measures how the light dims when the planet passes in front. They graph brightness over time and describe how the dip changes with planet size and orbit speed.
Objective
Your teen will collect light data during a model transit, sketch and describe a light curve qualitatively, and use the shape of the graph to infer a planet's relative size and orbital period.
Standards
Materials
| Item | Quantity |
|---|---|
| Lamp with a bare bulb or a bright flashlight standing upright | 1 |
| Balls of 2 sizes (a ping-pong ball and a tennis ball, or 2 clay balls) taped to pencils or skewers | 2 |
| Phone with a free light-meter (lux) app | 1 |
| Phone stand or a stack of books to hold the phone steady | 1 |
| Stopwatch, graph paper and pencil | 1 each |
| Darkened room | 1 |
Vocabulary
Preparation
- Install a free light-meter app on a phone and test that the reading changes when you cover the light. Prop the phone about 3 feet from the lamp with its sensor (usually near the front camera) facing the bulb.
- Make a data table with columns: Time (seconds), Brightness (lux), Notes.
Introduction
Say: stars are so far away and so bright that we usually can't see the planets around them. Yet astronomers have found thousands. Ask: how could you find something you can't see?
What happens to the light in a room when someone walks in front of a lamp?
Would a big planet or a small planet block more light?
Steps
Conclusion
Ask: why do astronomers need to see at least three dips before they trust a planet is real? A repeating dip with the same depth and spacing is the signature of an orbiting planet.
Make your own lesson plan in minutes
Describe a topic and Resource Portal AI writes the objectives, materials and steps for your group.
Try Resource Portal AI