Lesson planForensic Footprint Math: Estimate Height from Foot Length with a Scatter Plot
Math45 minutesGrades: 8th
Overview
Use a line of best fit to estimate height from a footprint.
Description
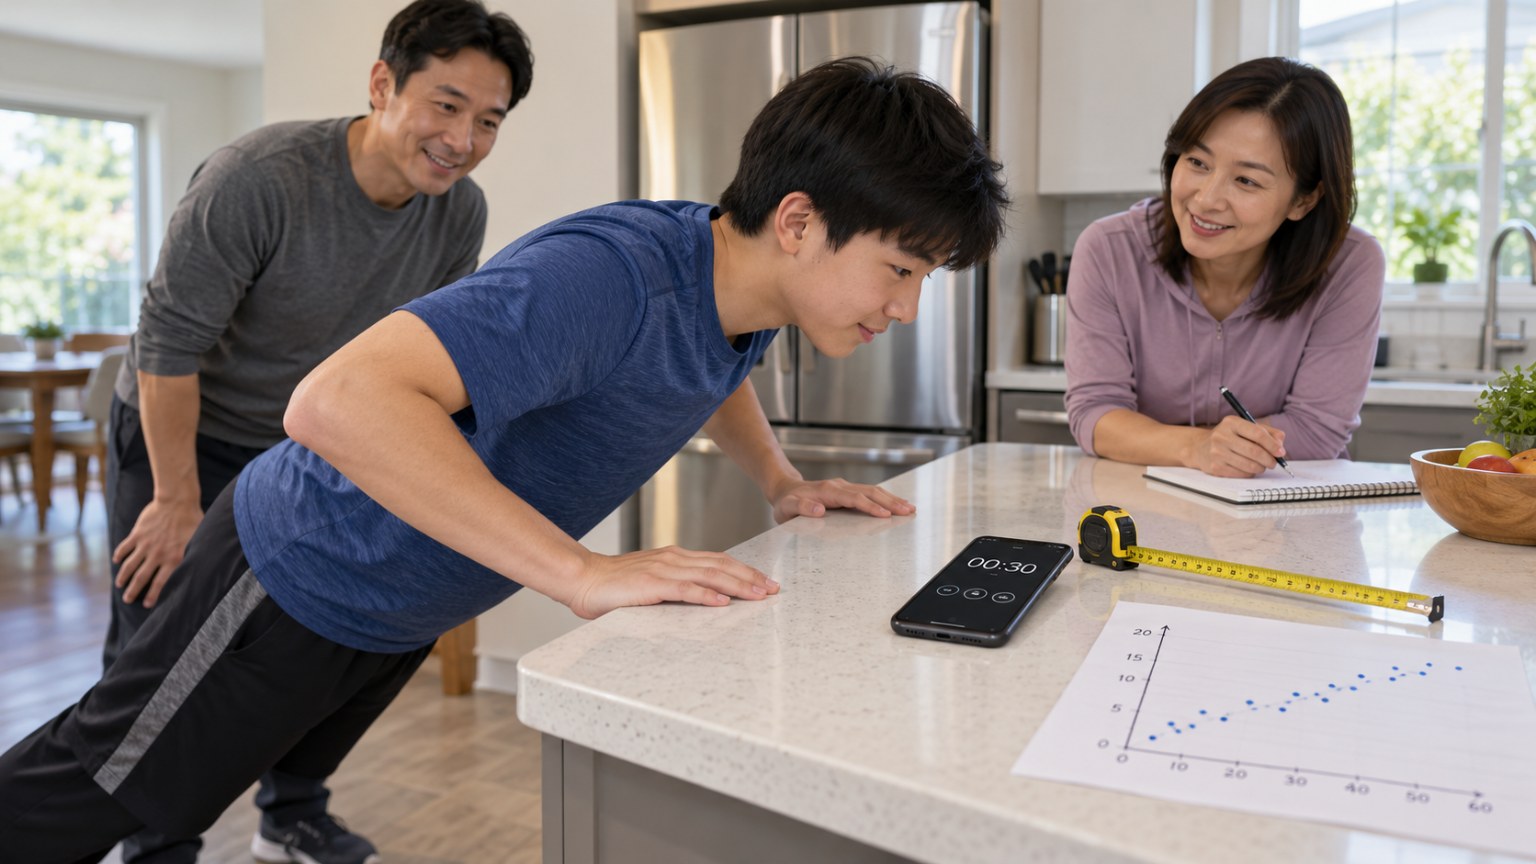
Your teen collects foot-length and height data (from family plus a provided data set), builds a scatter plot, fits a line by eye, writes its equation, and uses the model to estimate the height of whoever left a bare footprint in the backyard sandbox, then discusses how reliable that estimate is.
Objective
Your teen will construct and interpret a scatter plot of foot length versus height, informally fit a straight line, write and interpret its equation, and use it to make and evaluate a prediction.
Standards
8.SP.1Math · Grade 8 · Statistics & Probability Construct and interpret scatter plots for bivariate measurement data to investigate patterns of association between two quantities. Describe patterns such as clustering, outliers, positive or negative association, linear association, and nonlinear association.
8.SP.2Math · Grade 8 · Statistics & Probability Know that straight lines are widely used to model relationships between two quantitative variables. For scatter plots that suggest a linear association, informally fit a straight line, and informally assess the model fit by judging the closeness of the data points to the line.
8.SP.3Math · Grade 8 · Statistics & Probability Use the equation of a linear model to solve problems in the context of bivariate measurement data, interpreting the slope and intercept.
Materials
| Item | Quantity |
|---|
| Tape measure or meter stick in centimeters | 1 |
| Graph paper | 2 sheets |
| Ruler and pencil | 1 each |
| Clear ruler or uncooked spaghetti strand for fitting a line | 1 |
| Calculator | 1 |
| Data set in this lesson | 1 copy |
| Masking tape to mark heights on a wall | 1 roll |
Vocabulary
Scatter plot
A graph of paired data that shows each pair as a point.
Association
A relationship between two variables, such as positive (both rise together).
Line of best fit
A straight line drawn close to as many points as possible to model the trend.
Slope
The rate of change; here, the predicted change in height for each extra centimeter of foot length.
Outlier
A data point far from the overall pattern.
Preparation
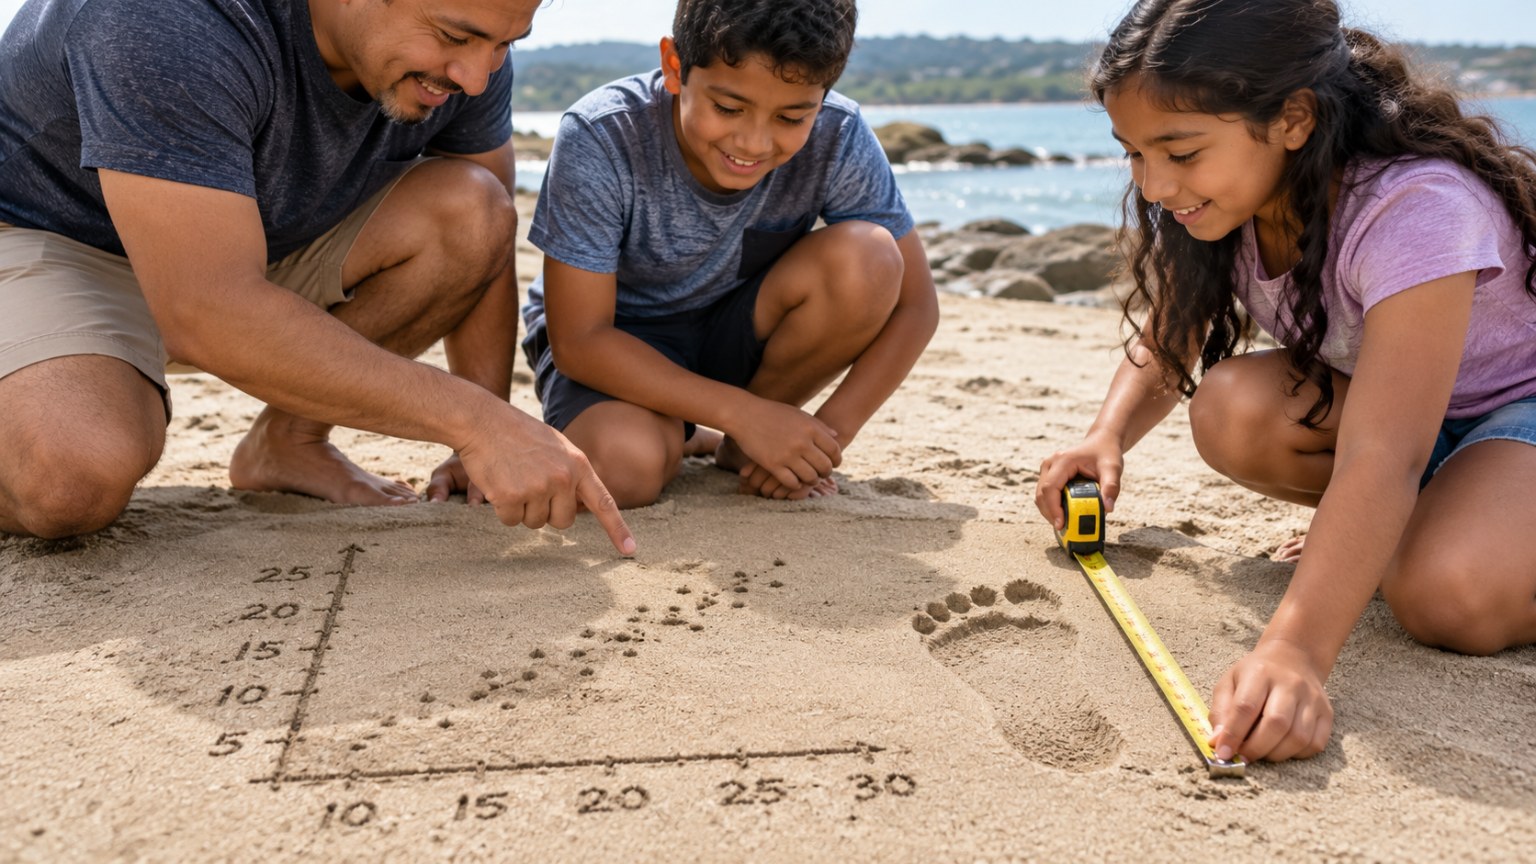
- Make a barefoot print in damp sand, flour on dark paper or a wet print on a paper bag, about 25.5 cm long, and label it MYSTERY PRINT. (Or simply give your teen the measurement 25.5 cm.)
- Copy the data table in this lesson onto paper.
Introduction
Show the mystery print and say: someone walked barefoot through the sandbox and nobody saw who. Forensic anthropologists can estimate a person's height from foot or bone length. Can a graph tell us how tall our mystery walker is?
Do taller people usually have longer feet?
Would one measurement be enough to be sure?
Steps
1Step 1
Collect data
(8 min) Your teen measures the barefoot length (heel to longest toe) and height in centimeters of every available family member and adds them to the 12 data pairs in this lesson. Measure height against a wall with a book flat on the head.
2Step 2
Build the scatter plot
(10 min) Your teen sets foot length on the x-axis (about 18 to 30 cm) and height on the y-axis (about 120 to 200 cm), then plots every point. They describe the pattern: is the association positive, negative or none, and are there any outliers?
3Step 3
Fit a line
(10 min) Your teen lays the spaghetti strand across the points so about as many points fall above as below, then draws the line. They pick two points on the line, calculate the slope and write the equation in the form y = mx + b.
4Step 4
Estimate the mystery height
(8 min) Your teen substitutes 25.5 cm into their equation to estimate the height, then checks it against the graph. They explain the meaning of the slope in words, such as 'each extra centimeter of foot length adds about 6 cm of height'.
5Step 5
Judge the evidence
(7 min) Discuss how far real points sit from the line and give the estimate as a range (for example 165 to 175 cm). Ask: does the intercept make sense in real life, and why should an investigator never rely on this one clue alone?
Conclusion
Ask: how confident are you in the estimate, and what would make it better? Forensic estimates come with ranges because people vary.
Make your own lesson plan in minutes
Describe a topic and Resource Portal AI writes the objectives, materials and steps for your group.
Try Resource Portal AI