
Lesson plans for 8.SP.2
Math · Grade 8 · Statistics & Probability
Know that straight lines are widely used to model relationships between two quantitative variables. For scatter plots that suggest a linear association, informally fit a straight line, and informally assess the model fit by judging the closeness of the data points to the line.
11 ready-to-teach lesson plans aligned to this standard. Each includes objectives, a materials list, vocabulary and step-by-step activities.
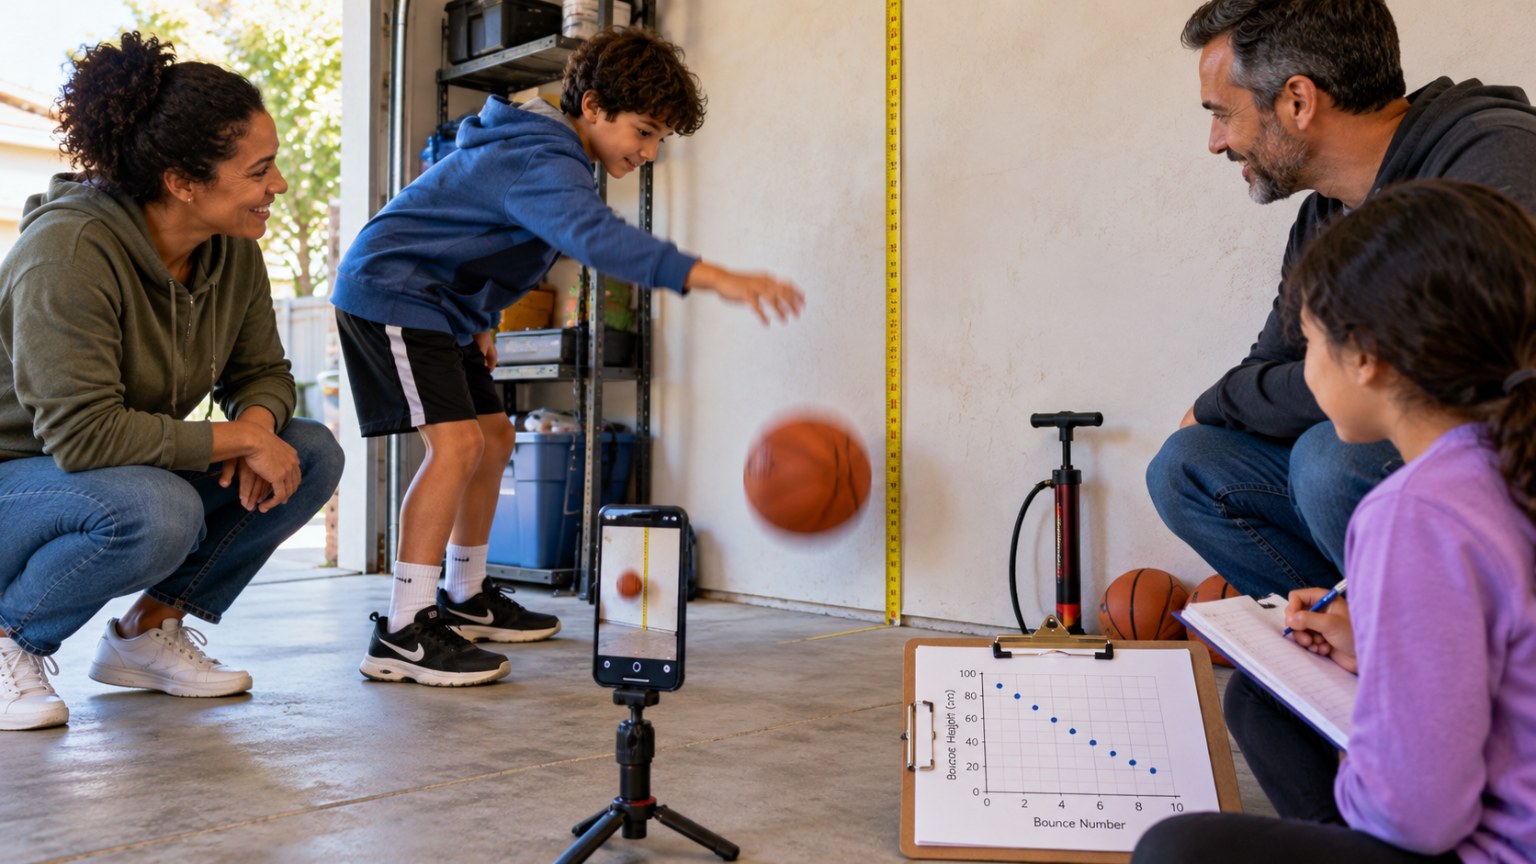
Sports Day Air Pressure Lab: Pump Strokes vs. Bounce Height
Pump, drop, measure and graph how air pressure changes a bounce.
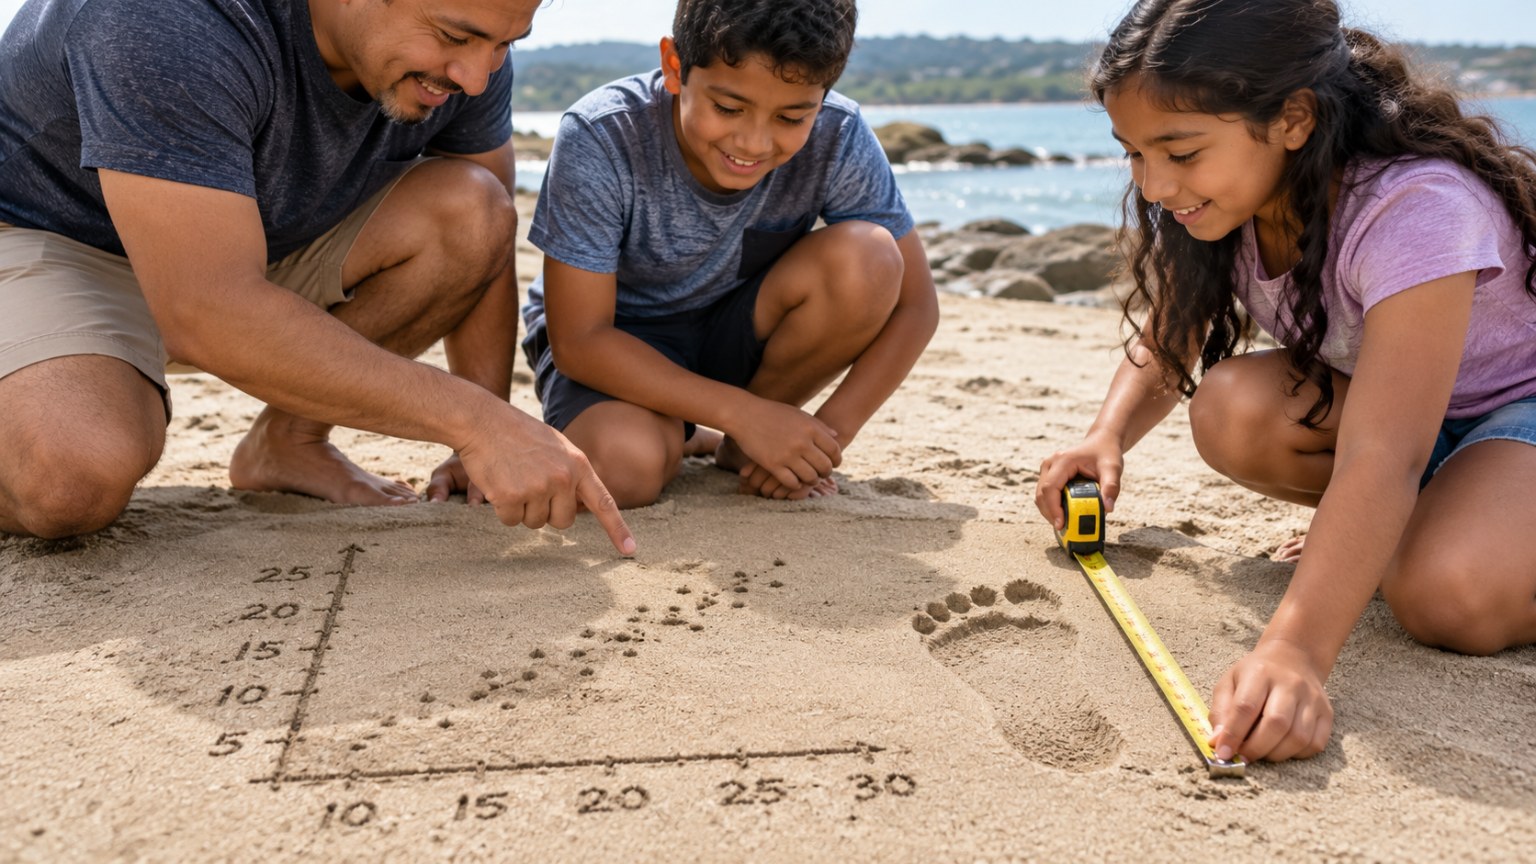
Forensic Footprint Math: Estimate Height from Foot Length with a Scatter Plot
Use a line of best fit to estimate height from a footprint.

Shrinking Arctic Sea Ice: Scatter Plot and Trend Line for Polar Bear Habitat
Model the decline of Arctic sea ice with a trend line.
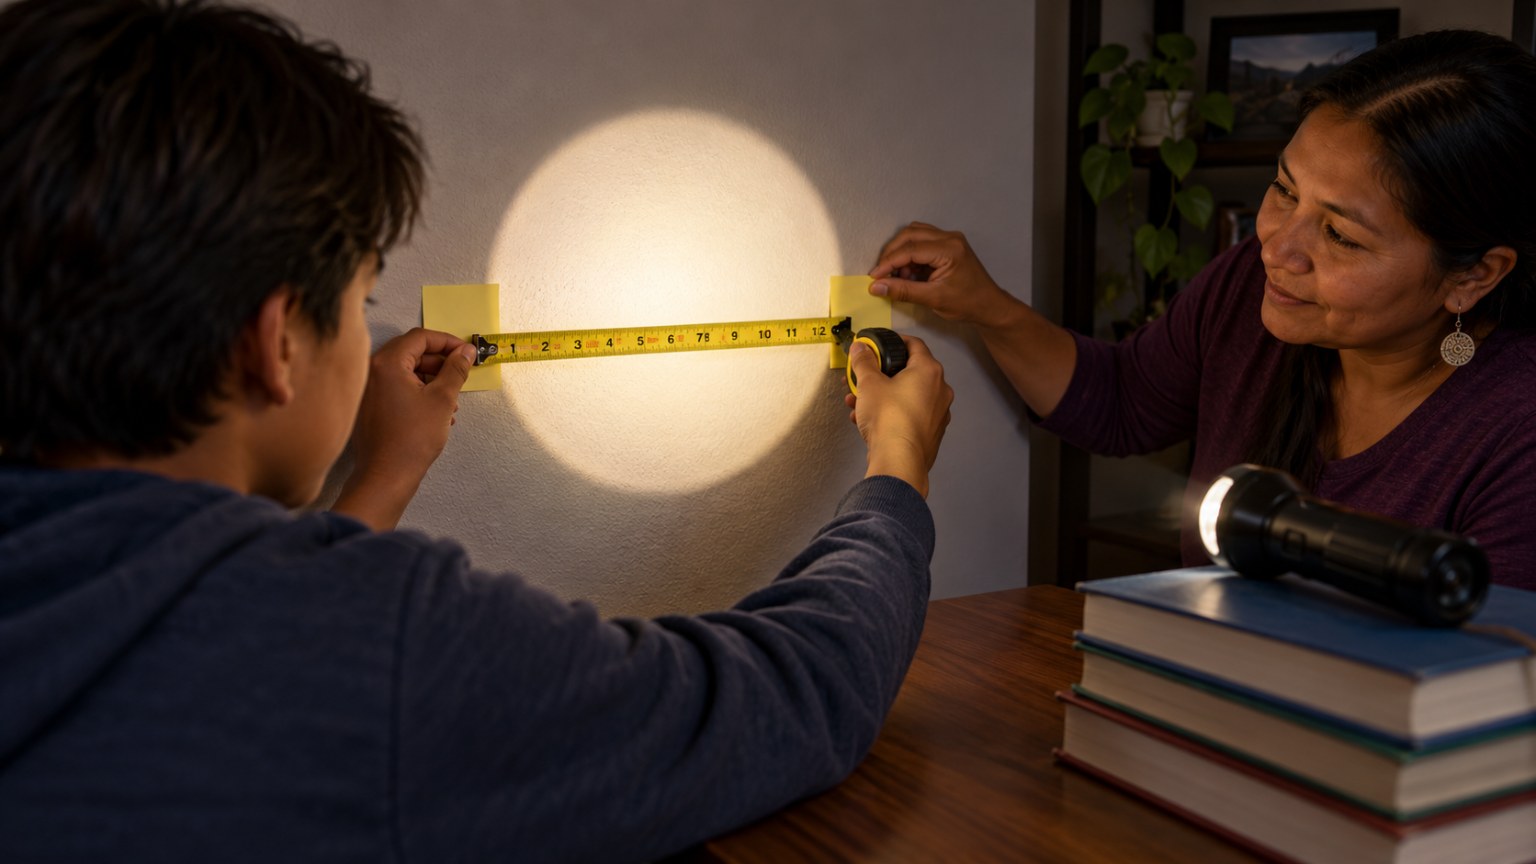
Spotlight Planner: Flashlight Beam Width vs. Distance
Measure a flashlight beam and model it with a line.

Incline Push-Up Ladder: Hand Height vs. Reps Scatter Plot
Push-ups at five heights become a linear model.

Candy Pumpkin Catapult: Scatter Plot Launch Lab
Build a catapult and graph pull-back against launch distance.
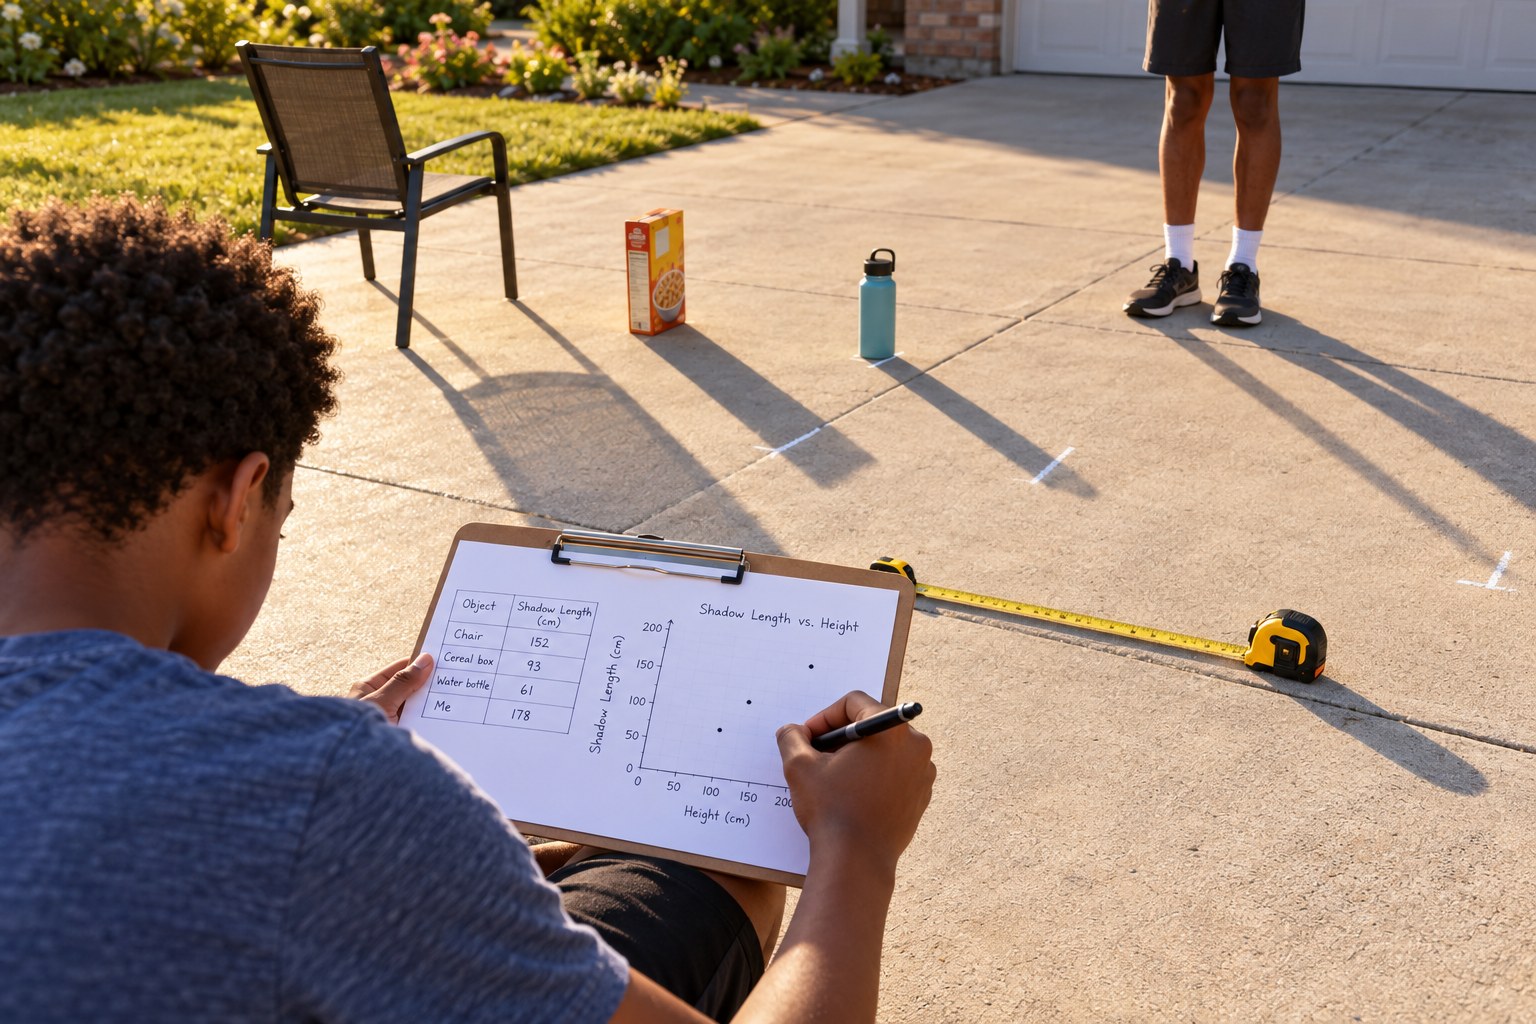
Shadow Survey: Object Height vs. Shadow Length Scatter Plot
Measure 8 shadows fast, plot them and fit a line.
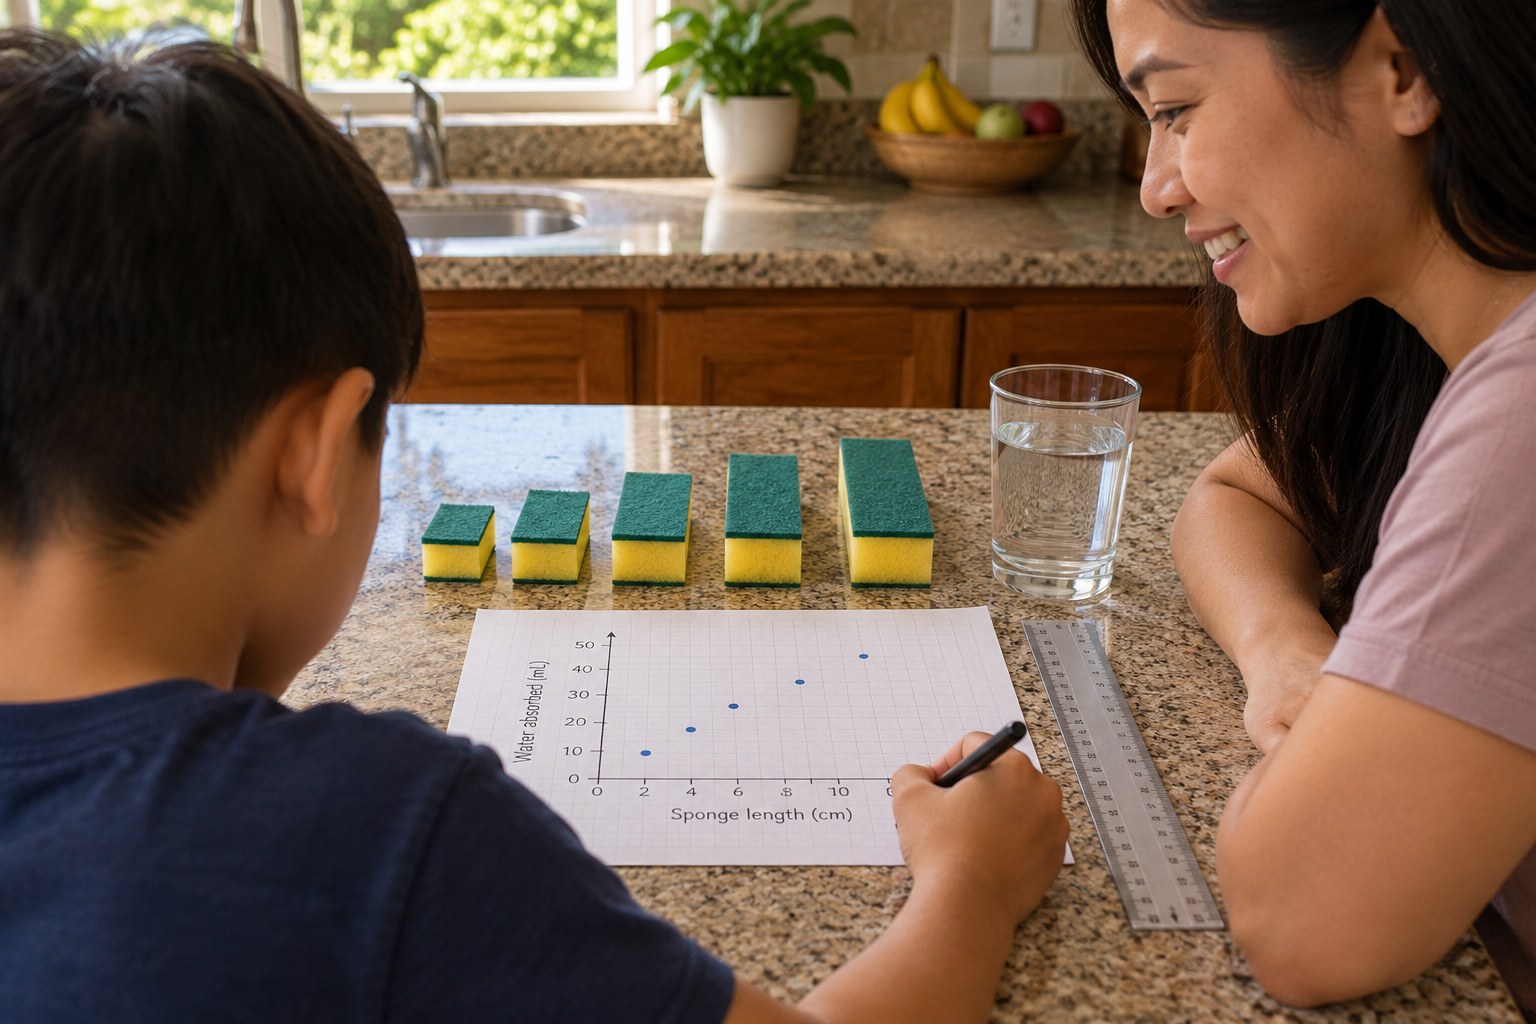
Sponge Soak Lab: Sponge Size vs. Water Held Scatter Plot
Squeeze sponges and plot how much water they hold.
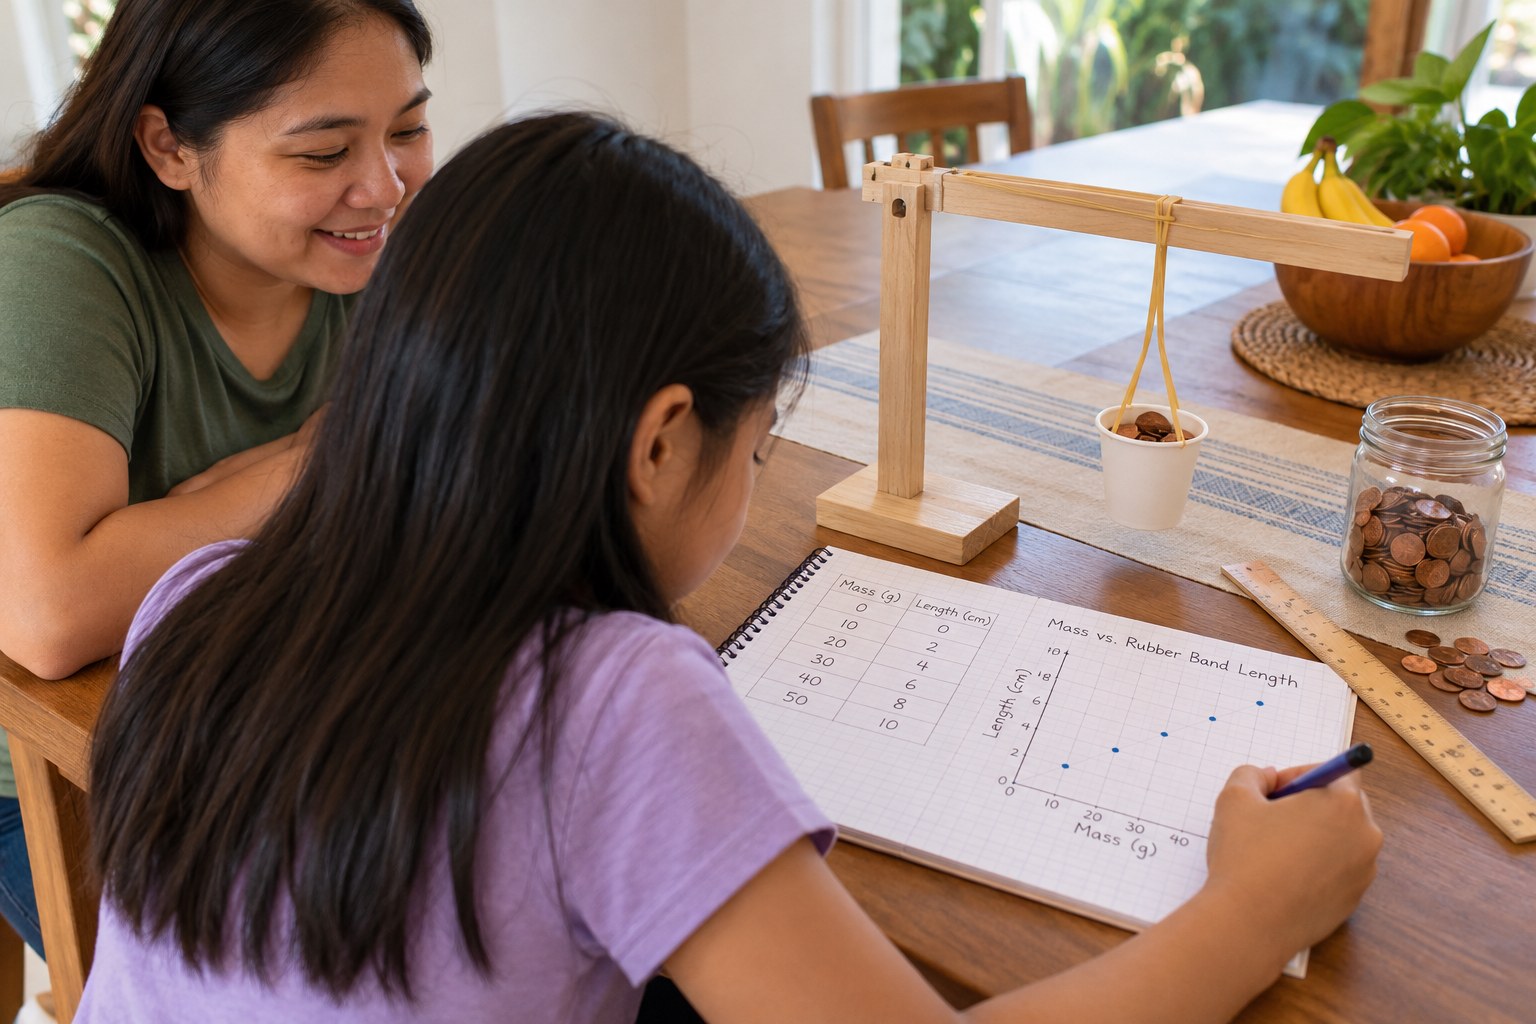
Rubber Band Spring Scale: Calibrate with Pennies, Then Weigh a Mystery Object
Build a penny-calibrated rubber band scale and model it.

Ruler Launcher Lab: Pivot Position vs. Distance Scatter Plot
Launch pom-poms, plot the data and fit a line.
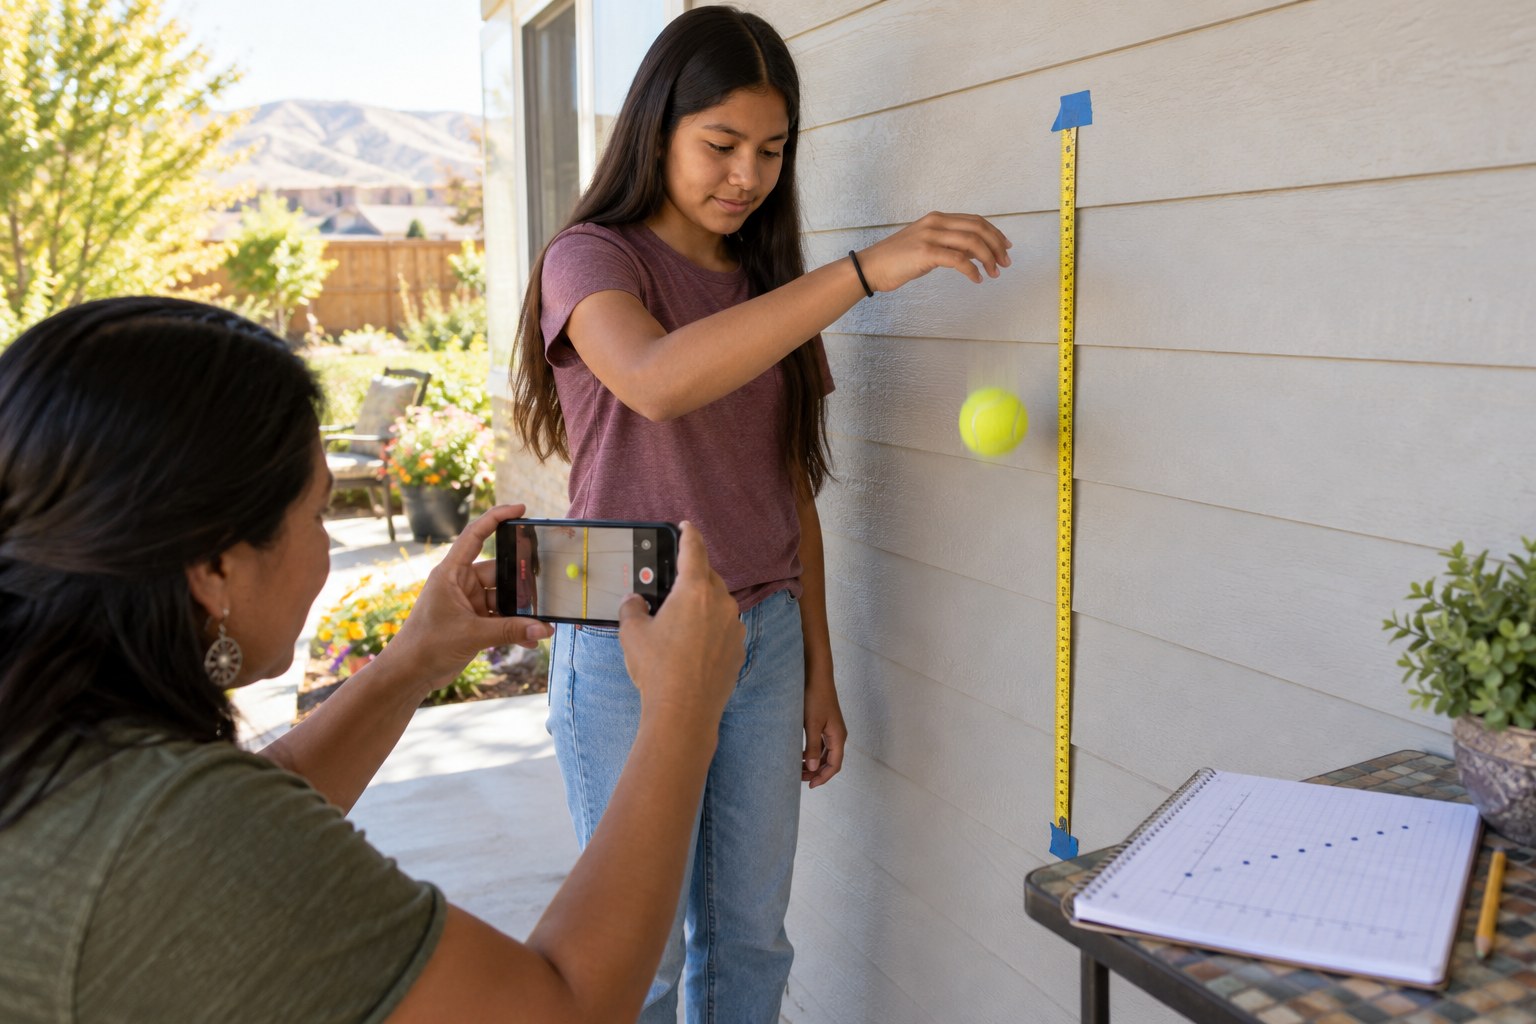
Bounce Back: Drop Height vs. Rebound Height Scatter Plot
Drop, film, plot and model a ball's bounce.
See all grade 8 standards with lesson plans
Make a lesson like this in a minute
Pick a topic, grade, group size and length. Resource Portal AI writes the objectives, materials, steps and pictures.
Sign up FREEFree forever · no credit card needed. Members get all 5,100+ lessons for $14.99/month, with the first 7 days free.