Lesson planDating Dinosaur Rocks: A Half-Life Coin Model
Science45 minutesGrades: 7th, 8th
Overview
Model radioactive decay with coins to see how fossils get their dates.
Description
Your teen models radioactive decay by repeatedly shaking a box of 100 coins and removing the ones that land heads up, graphs the results, describes the curve, and uses it to explain how scientists date volcanic ash layers above and below dinosaur fossils.
Objective
Your teen will collect data from a chance process, compare it with the expected probability, describe the nonlinear decay curve from a graph, and explain how half-life lets geologists date rock layers that bracket fossils.
Standards
7.SP.6Math · Grade 7 · Statistics & Probability Approximate the probability of a chance event by collecting data on the chance process that produces it and observing its long-run relative frequency, and predict the approximate relative frequency given the probability.
8.F.5Math · Grade 8 · Functions Describe qualitatively the functional relationship between two quantities by analyzing a graph (e.g., where the function is increasing or decreasing, linear or nonlinear). Sketch a graph that exhibits the qualitative features of a function that has been described verbally.
Materials
| Item | Quantity |
|---|
| Pennies or other coins (or 100 paper squares marked on one side) | 100 |
| Shoebox or container with a lid | 1 |
| Graph paper or a spreadsheet | 1 |
| Pencil and two colors of pens | 1 each |
| Data table from this lesson | 1 |
Vocabulary
Isotope
A form of an element with a different number of neutrons; some isotopes are unstable and decay.
Parent and daughter isotopes
The unstable starting isotope (parent) and the stable isotope it decays into (daughter).
Half-life
The time it takes for half of the parent atoms in a sample to decay.
Radiometric dating
Finding the age of a rock by measuring the ratio of parent to daughter isotopes.
Preparation
- Count out 100 coins and set up the box.
- Draw the data table: Shake number (0-8), Expected parent atoms, Actual parent atoms (tails remaining), Daughter atoms (removed).
Introduction
Ask: "A T. rex skeleton is about 66-68 million years old. Nobody wrote that date down. How do we know?" Then show the box of coins and say the answer is a lot like flipping coins.
If you flip a coin, what is the probability it lands heads?
If you start with 100 coins and remove the heads each time, how many shakes until none are left?
Steps
1Step 1
Predict
(5 min) Your teen fills in the "Expected" column: 100, 50, 25, 12.5 and so on, halving each time. They predict on paper what the graph will look like: a straight line or a curve.
2Step 2
Run the decay model
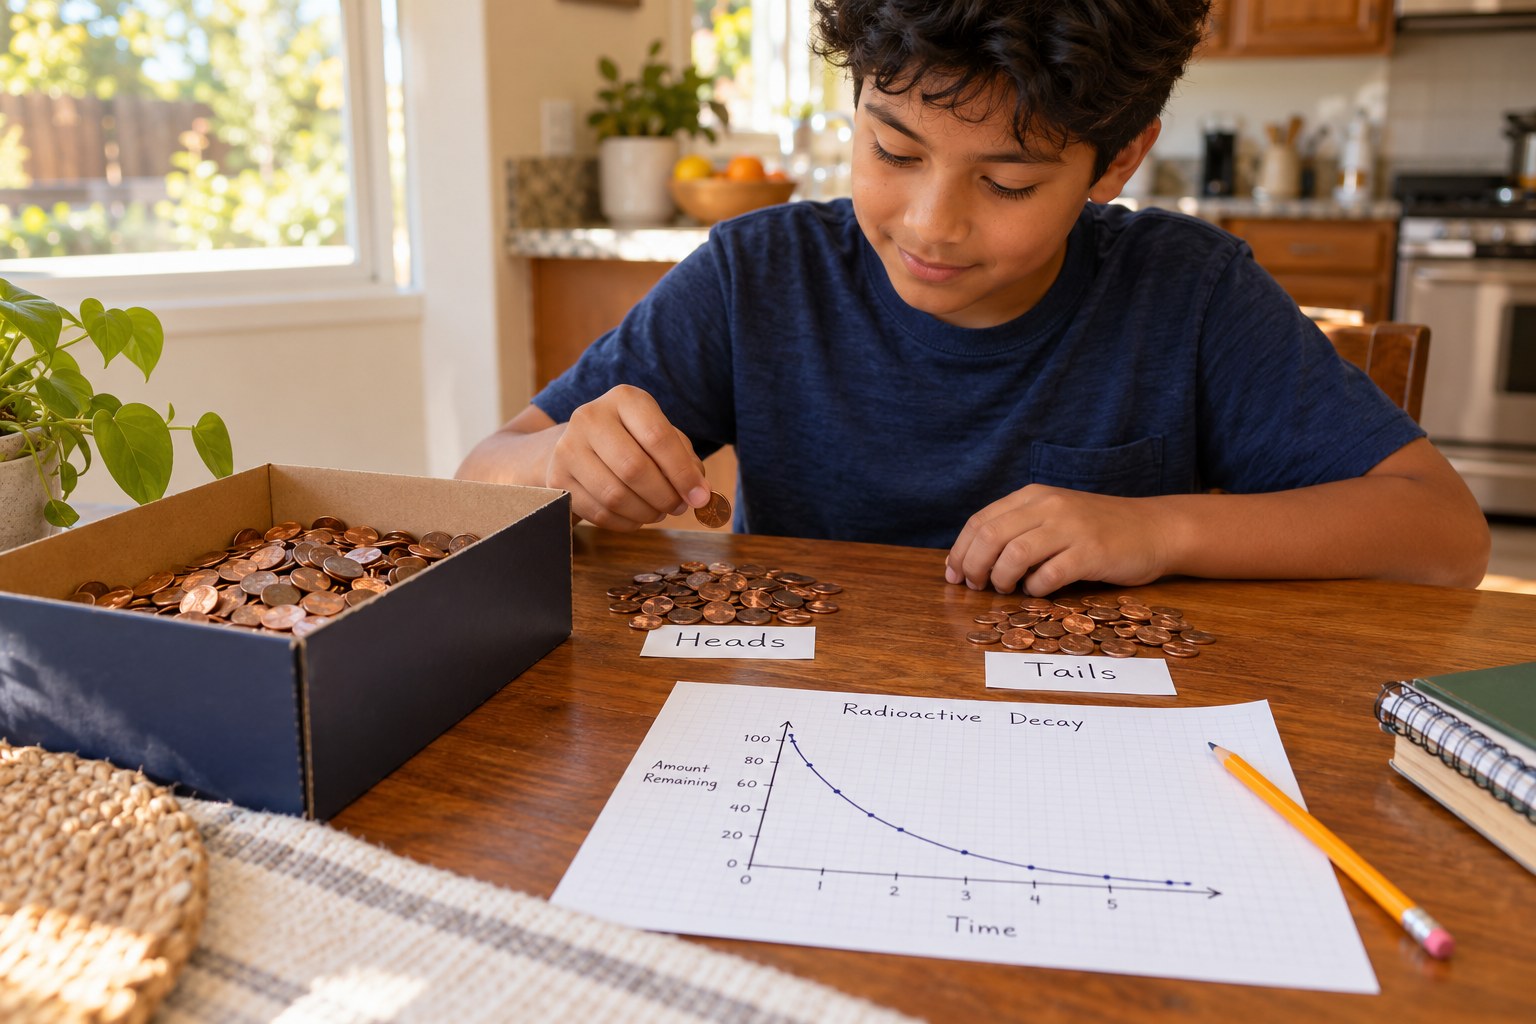
(12 min) Place the 100 coins tails-up in the box, shake it with the lid on, and remove every coin that landed heads up; those atoms have "decayed" into daughter atoms. Count and record what remains, then repeat until no coins are left or 8 shakes are done.
3Step 3
Graph and compare
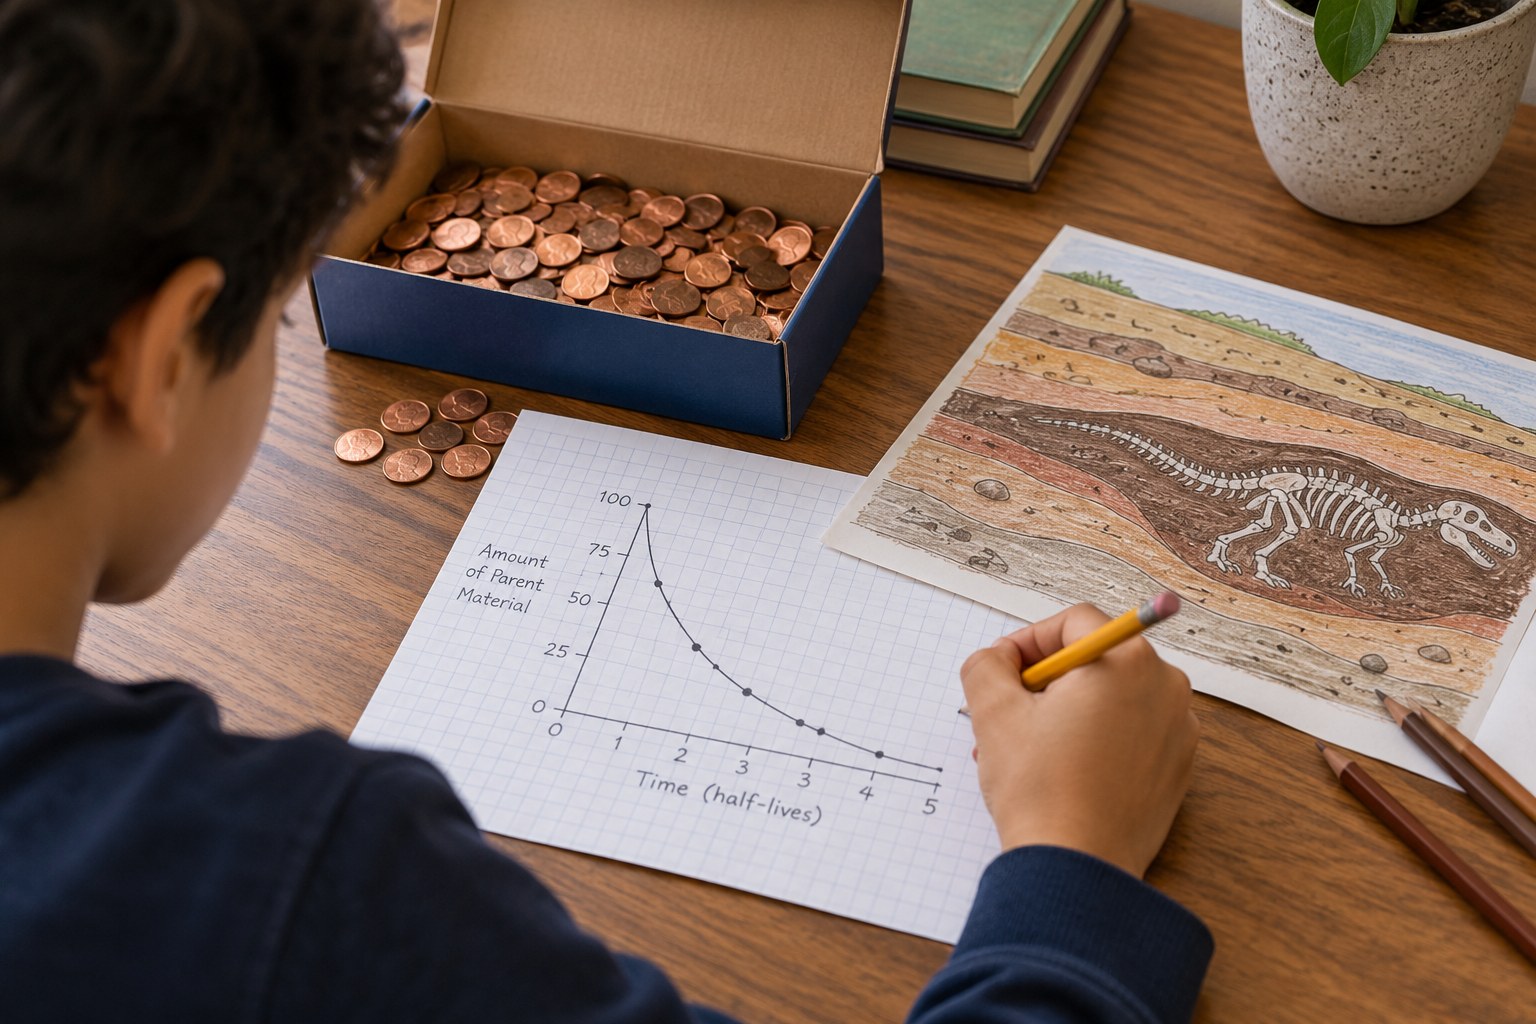
(10 min) Your teen graphs shake number (half-lives) on the x-axis and parent atoms remaining on the y-axis, plotting expected values in one color and actual values in the other. They describe the shape: decreasing quickly at first, then more slowly, never quite reaching zero in the expected curve.
4Step 4
Date a dinosaur
(12 min) Your teen solves the practice problems in this lesson, using the half-life idea to find the ages of volcanic ash layers above and below a fossil. They explain why the fossil's age falls between the two ash-layer ages.
5Step 5
Explain the method
(5 min) Your teen explains to the family why carbon-14 cannot date dinosaurs and which isotopes geologists use instead. Discuss why their coin results did not exactly match the expected numbers and how using more coins would help.
Conclusion
Each coin, like each atom, behaves randomly, but large numbers follow a predictable pattern. That predictability is what lets geologists turn isotope ratios into ages.
Make your own lesson plan in minutes
Describe a topic and Resource Portal AI writes the objectives, materials and steps for your group.
Try Resource Portal AI