Lesson planNew Year's Resolution Survey: Dot Plots, Median and IQR
Math45 minutesGrades: 6th, 7th
Overview
Survey people about New Year's resolutions and analyze the data.
Description
Your teen writes a statistical question about New Year's resolutions, surveys family and friends, plots the results on a dot plot and box plot, and uses median, mean and interquartile range to describe how long resolutions really last.
Objective
Your teen will distinguish statistical from non-statistical questions, collect and display data in dot and box plots, and calculate and interpret median, mean and interquartile range.
Standards
6.SP.1Math · Grade 6 · Statistics & Probability Recognize a statistical question as one that anticipates variability in the data related to the question and accounts for it in the answers.
6.SP.4Math · Grade 6 · Statistics & Probability Display numerical data in plots on a number line, including dot plots, histograms, and box plots.
6.SP.5cMath · Grade 6 · Statistics & Probability Giving quantitative measures of center (median and/or mean) and variability (interquartile range and/or mean absolute deviation), as well as describing any overall pattern and any striking deviations from the overall pattern with reference to the context in which the data were gathered.
Materials
| Item | Quantity |
|---|
| Phone or paper for collecting survey answers | 1 |
| Graph paper or lined paper | 3 sheets |
| Pencil and ruler | 1 each |
| Calculator | 1 |
| At least 10 people to survey (family, friends, neighbors), or the sample data set | 10-20 |
Vocabulary
Statistical question
A question that expects a variety of answers, like 'How long did people's resolutions last?'
Median
The middle value when data are listed in order.
Interquartile range (IQR)
The spread of the middle half of the data: the third quartile minus the first quartile.
Outlier
A value much higher or lower than the rest of the data.
Resolution
A goal or promise some people make at the start of a new year.
Preparation
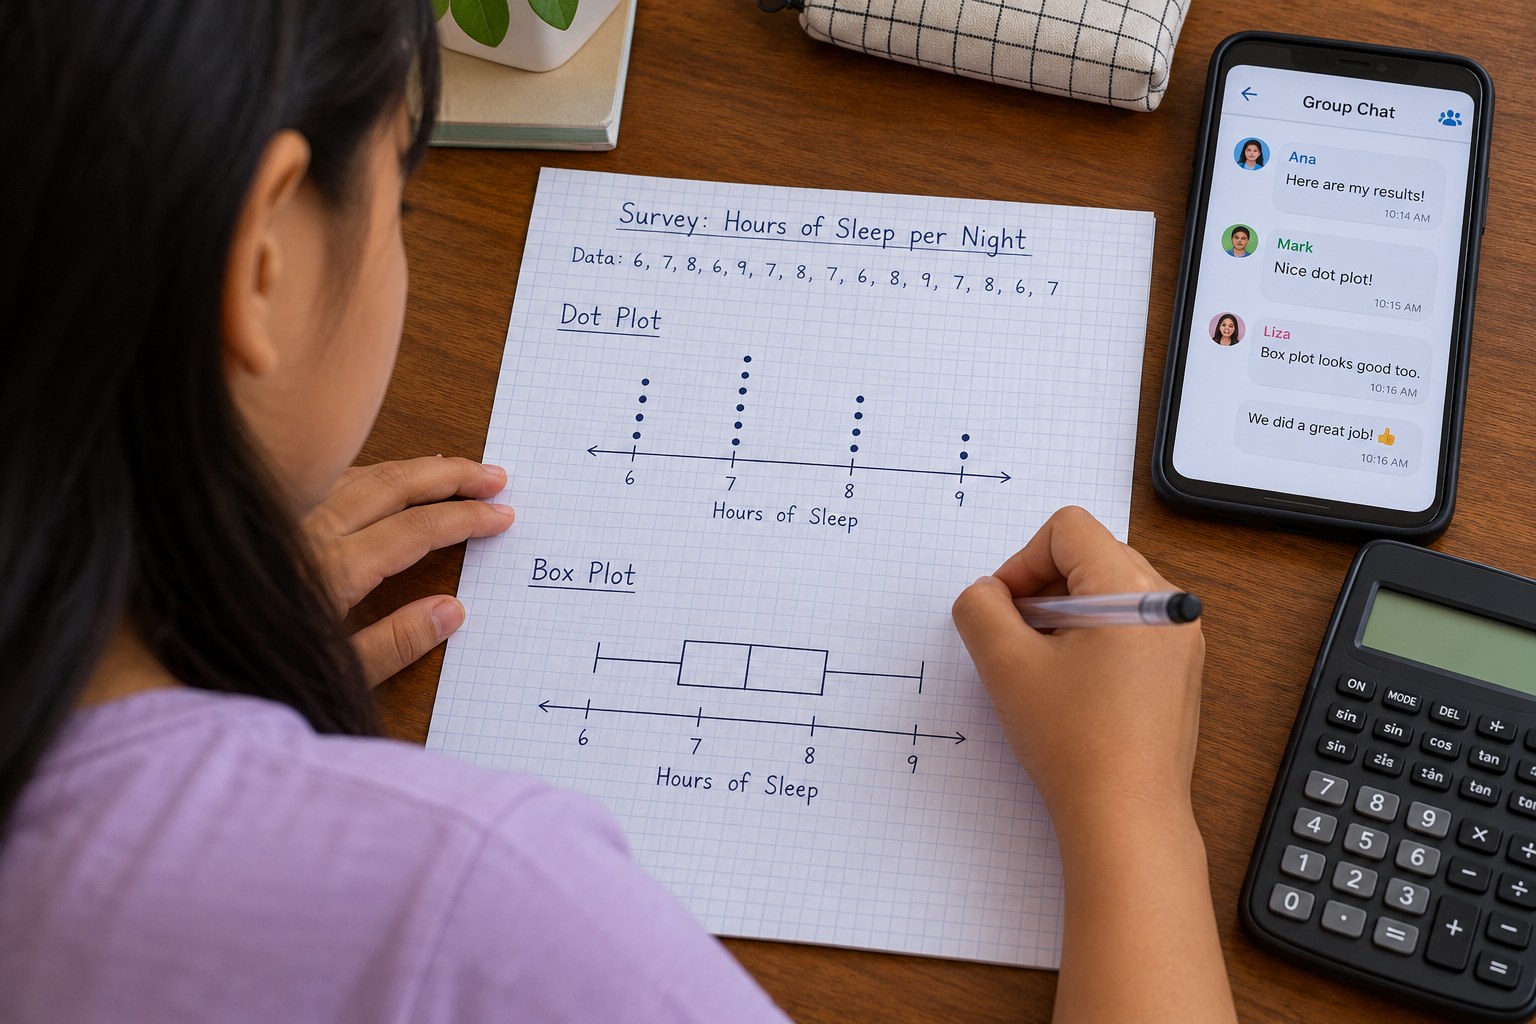
- Decide how your teen will reach survey takers (texts, a family group chat, phone calls, or asking in person) and get permission to message anyone outside the household.
- Read the sample data set and answer key so you can help if fewer than 10 people respond.
Introduction
Ask: 'Do most New Year's resolutions last a week, a month or all year?' Have your teen guess a number of weeks. Explain that instead of guessing, a statistician asks a good question, collects data and lets the numbers answer.
Which is a statistical question: 'How old am I?' or 'How old are the people in my family?' Why?
If one person kept their resolution all year, how might that change the average?
Steps
1Step 1
Write the question
(6 min) Your teen sorts the practice questions in the 'Question sort' section into statistical and not statistical. Then they write their own survey question with a number answer, such as 'How many weeks did your last New Year's resolution last?' Check that the question will get a variety of number answers.
2Step 2
Collect the data
(8 min) Your teen sends the question to at least 10 people or asks them in person, recording each answer in a list. Anyone who has never made a resolution can be skipped and counted separately; if responses are slow, use the sample data set.
3Step 3
Make a dot plot and box plot
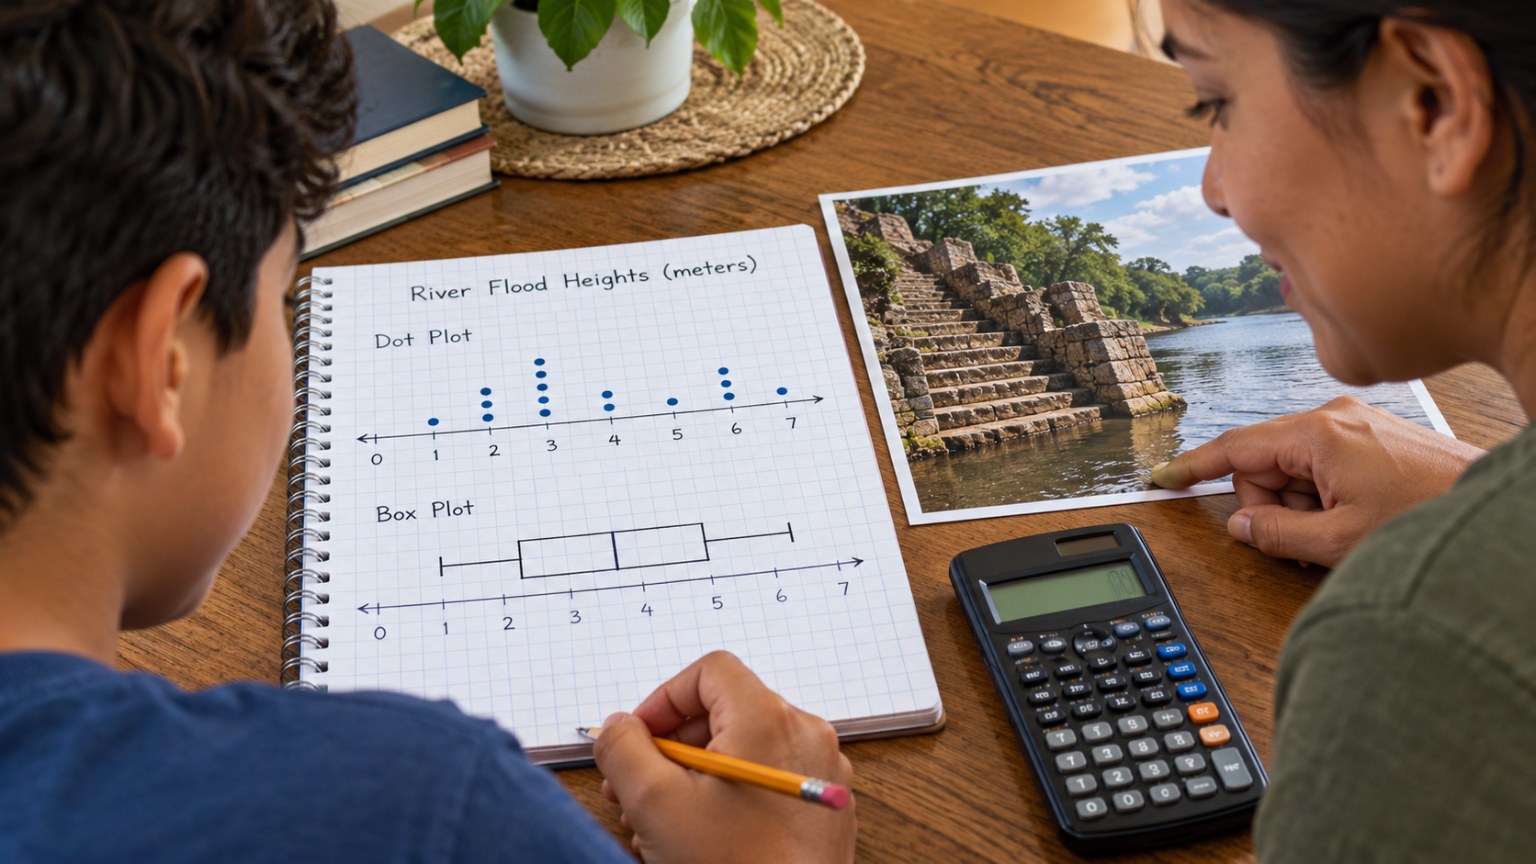
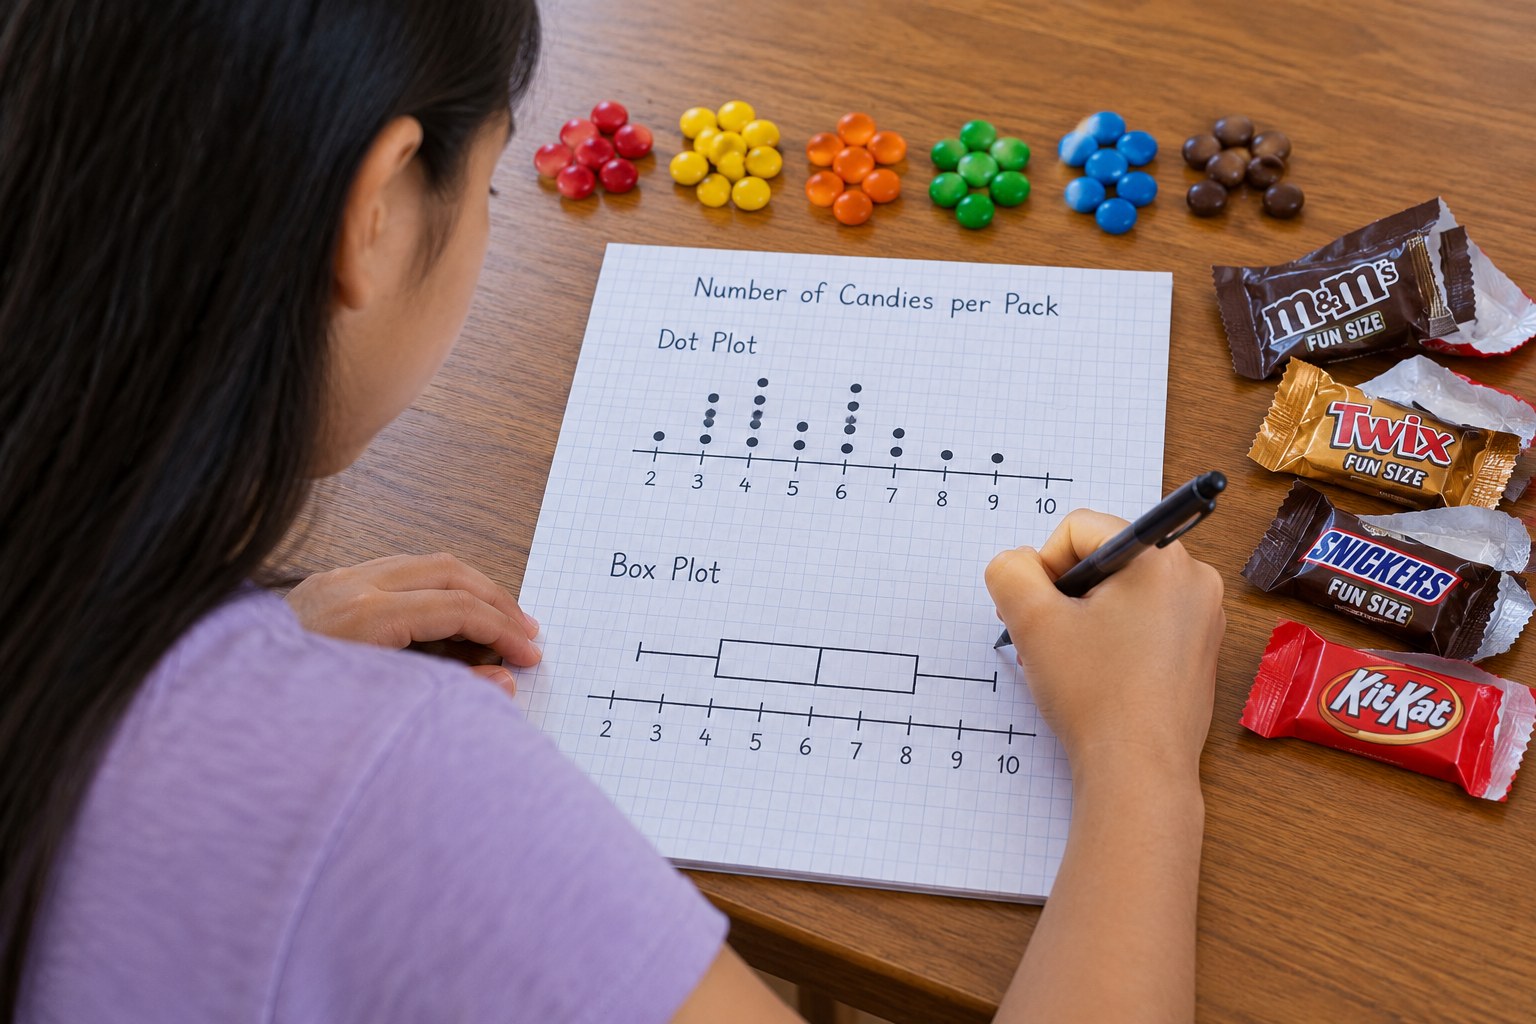
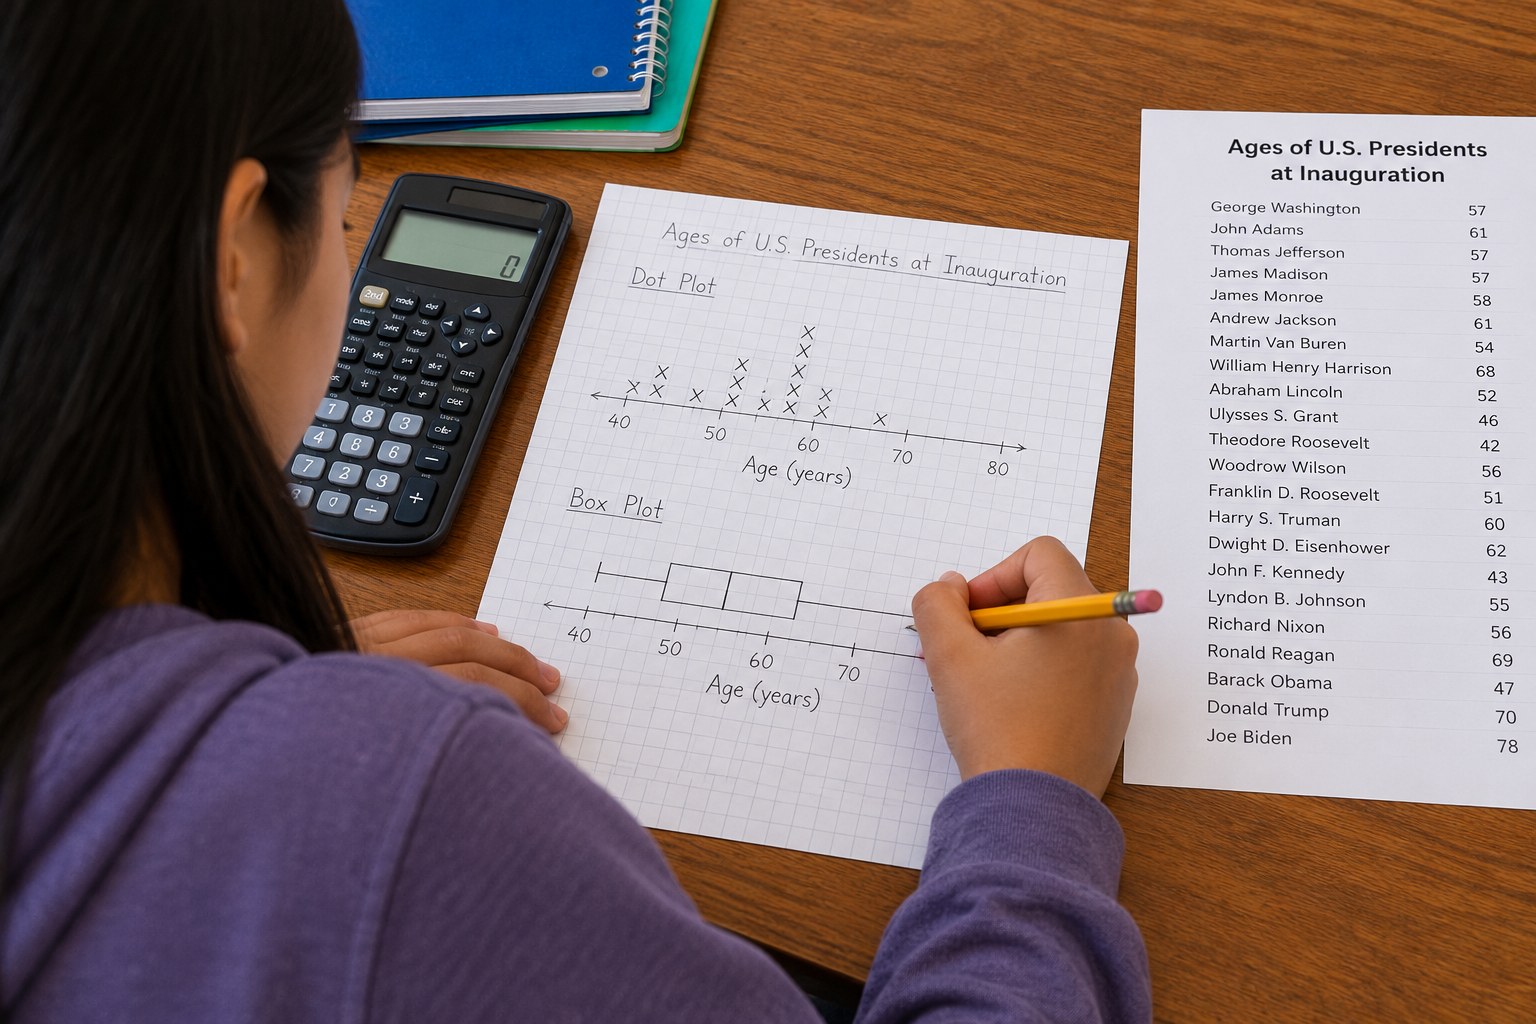
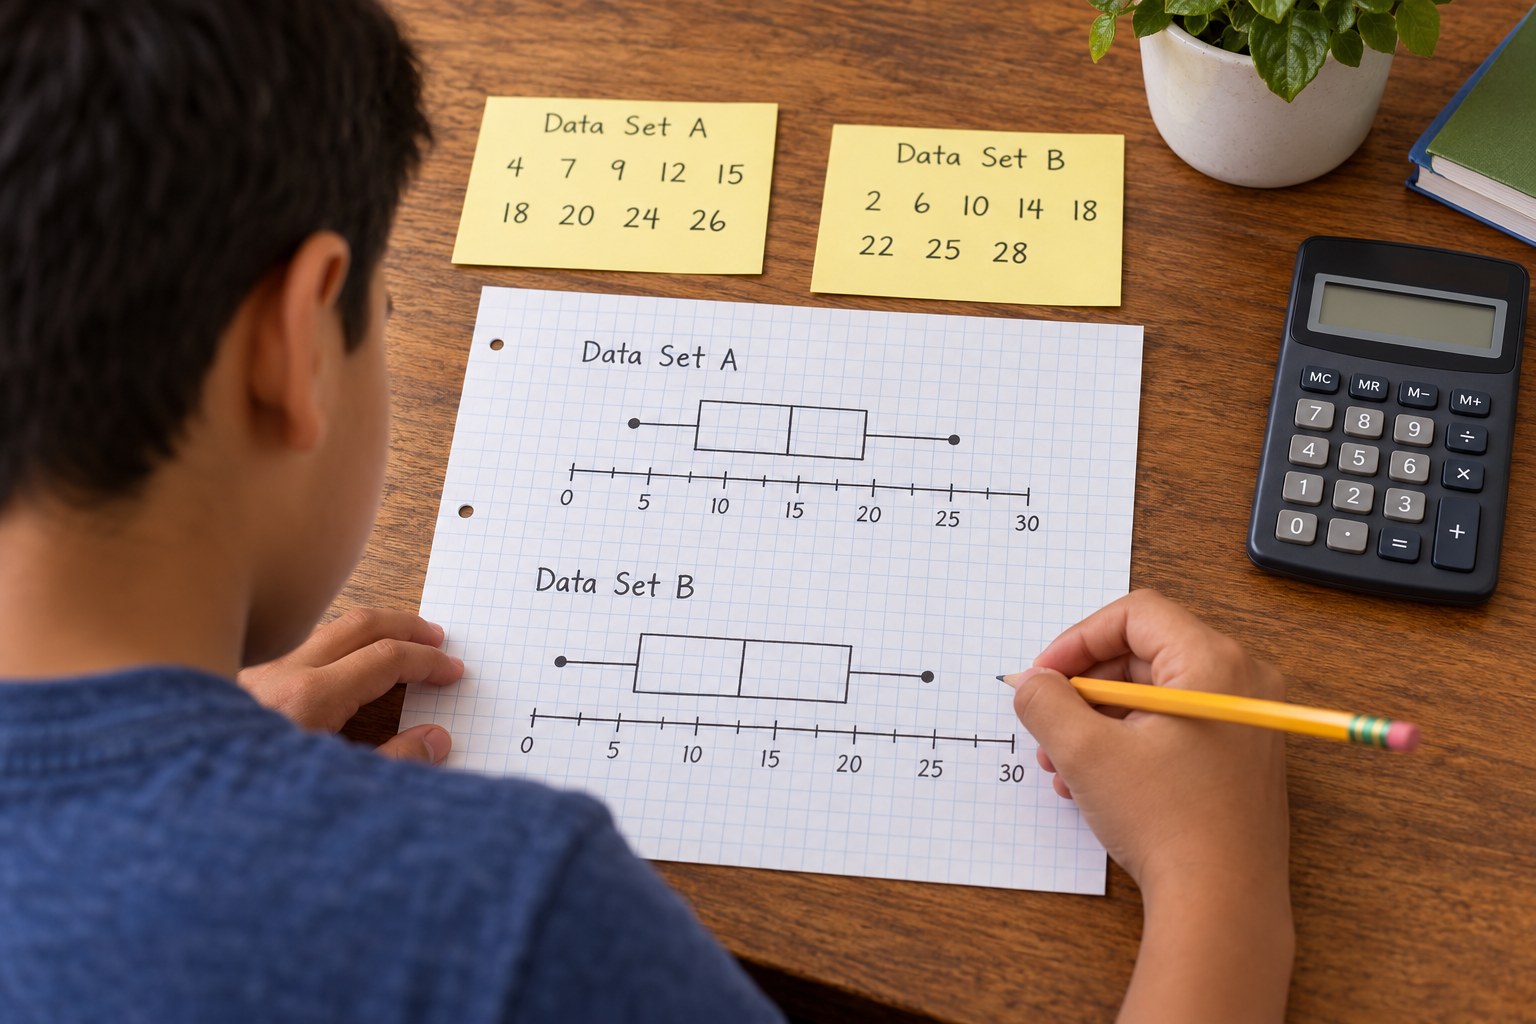
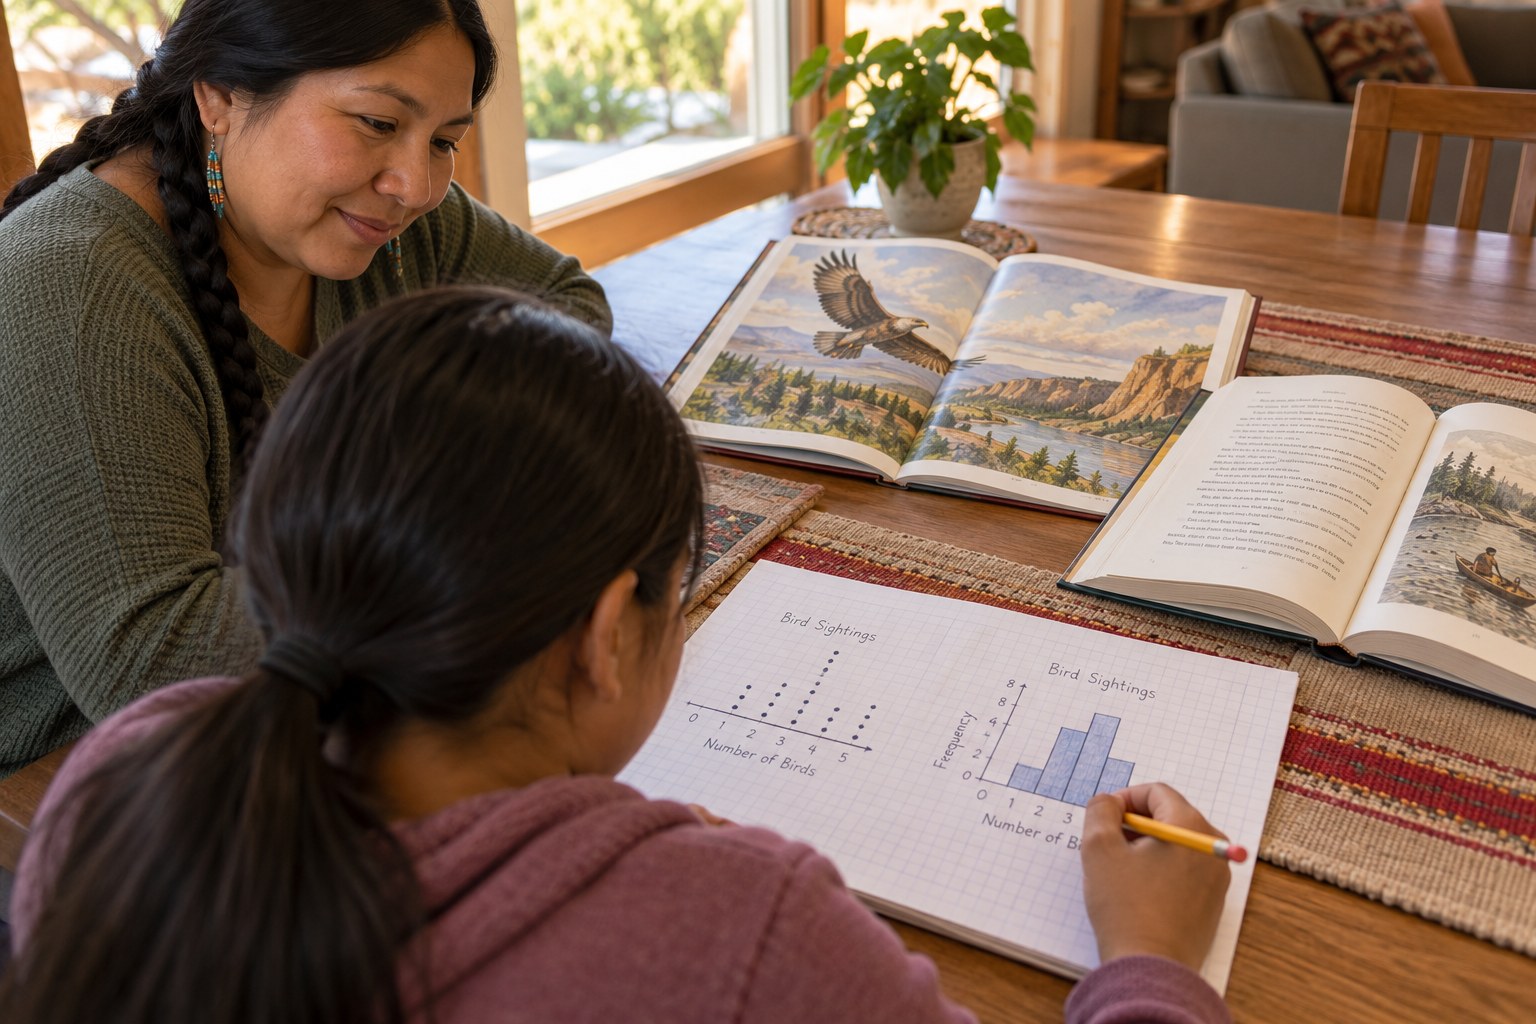
(10 min) Your teen orders the data from least to greatest and draws a number line, stacking one dot per answer. Below it, they draw a box plot using the minimum, first quartile, median, third quartile and maximum.
4Step 4
Calculate center and spread
(12 min) Your teen finds the median, the mean, the first and third quartiles, and the IQR. Compare the median and mean, and ask which better describes a typical resolution if there are outliers.
5Step 5
Write a data story
(7 min) Your teen writes 3 or 4 sentences describing the results using the median, the IQR and any outliers, for example, that half of the resolutions lasted 4 weeks or less. They end with one question the data cannot answer.
Conclusion
Ask: was your guess close to the median? Share the results, without names, with the people you surveyed.
Make your own lesson plan in minutes
Describe a topic and Resource Portal AI writes the objectives, materials and steps for your group.
Try Resource Portal AI