Thanksgiving Leftovers Science: Cooling Curves and the Danger Zone
Overview
Graph cooling curves to learn how to store leftovers safely.
Description
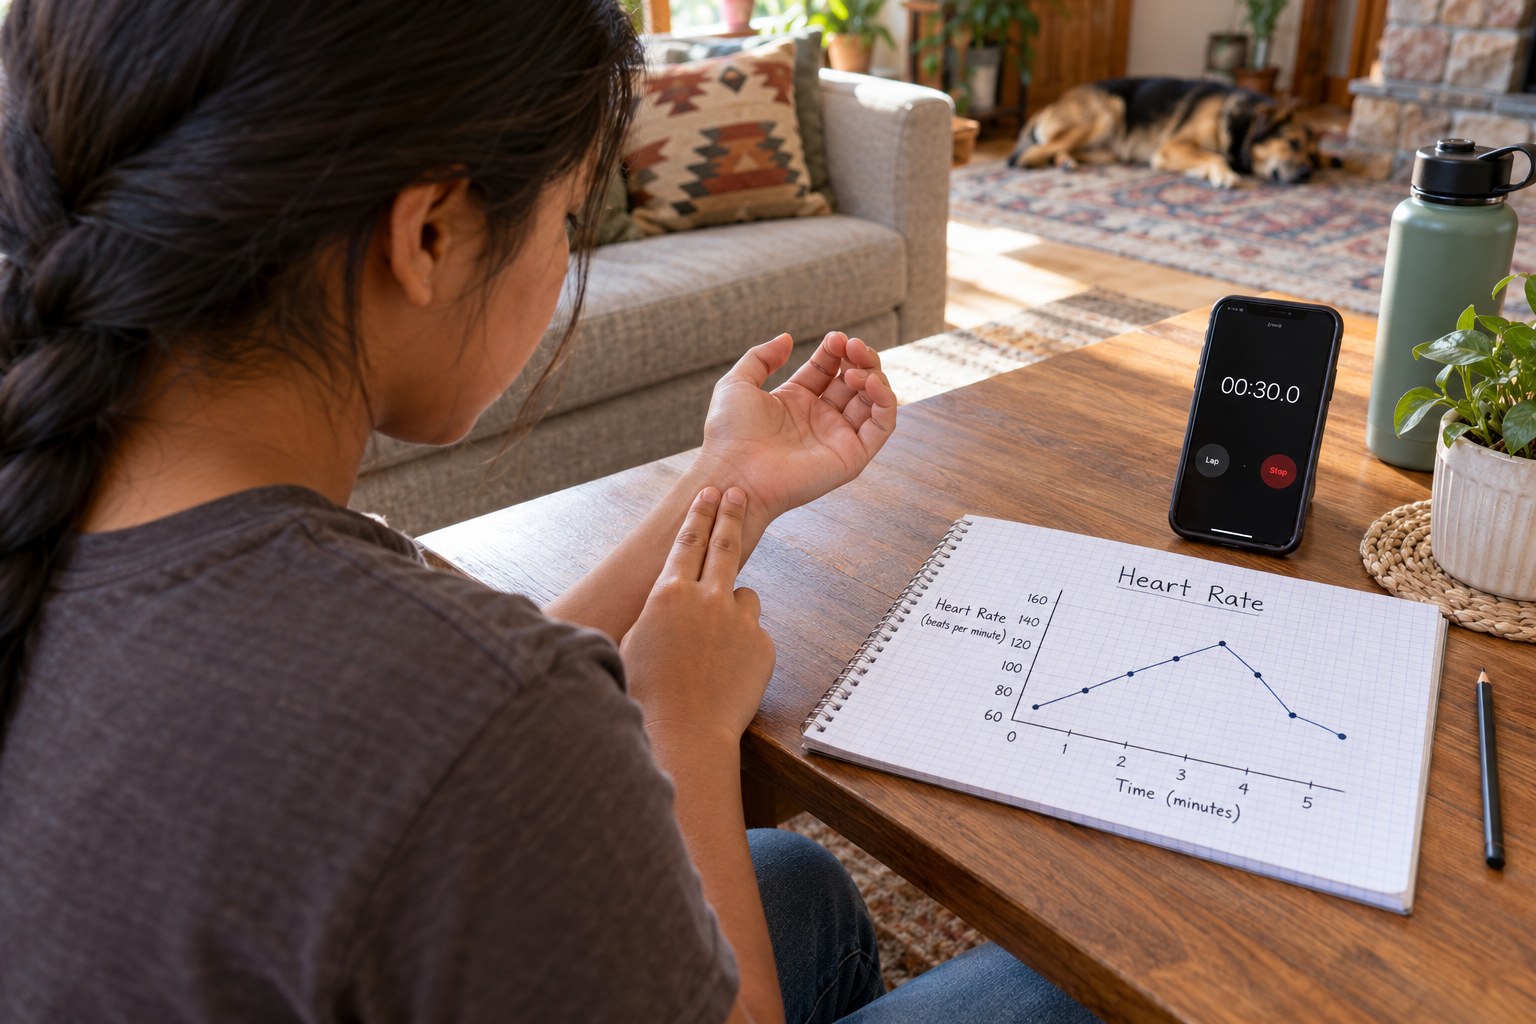
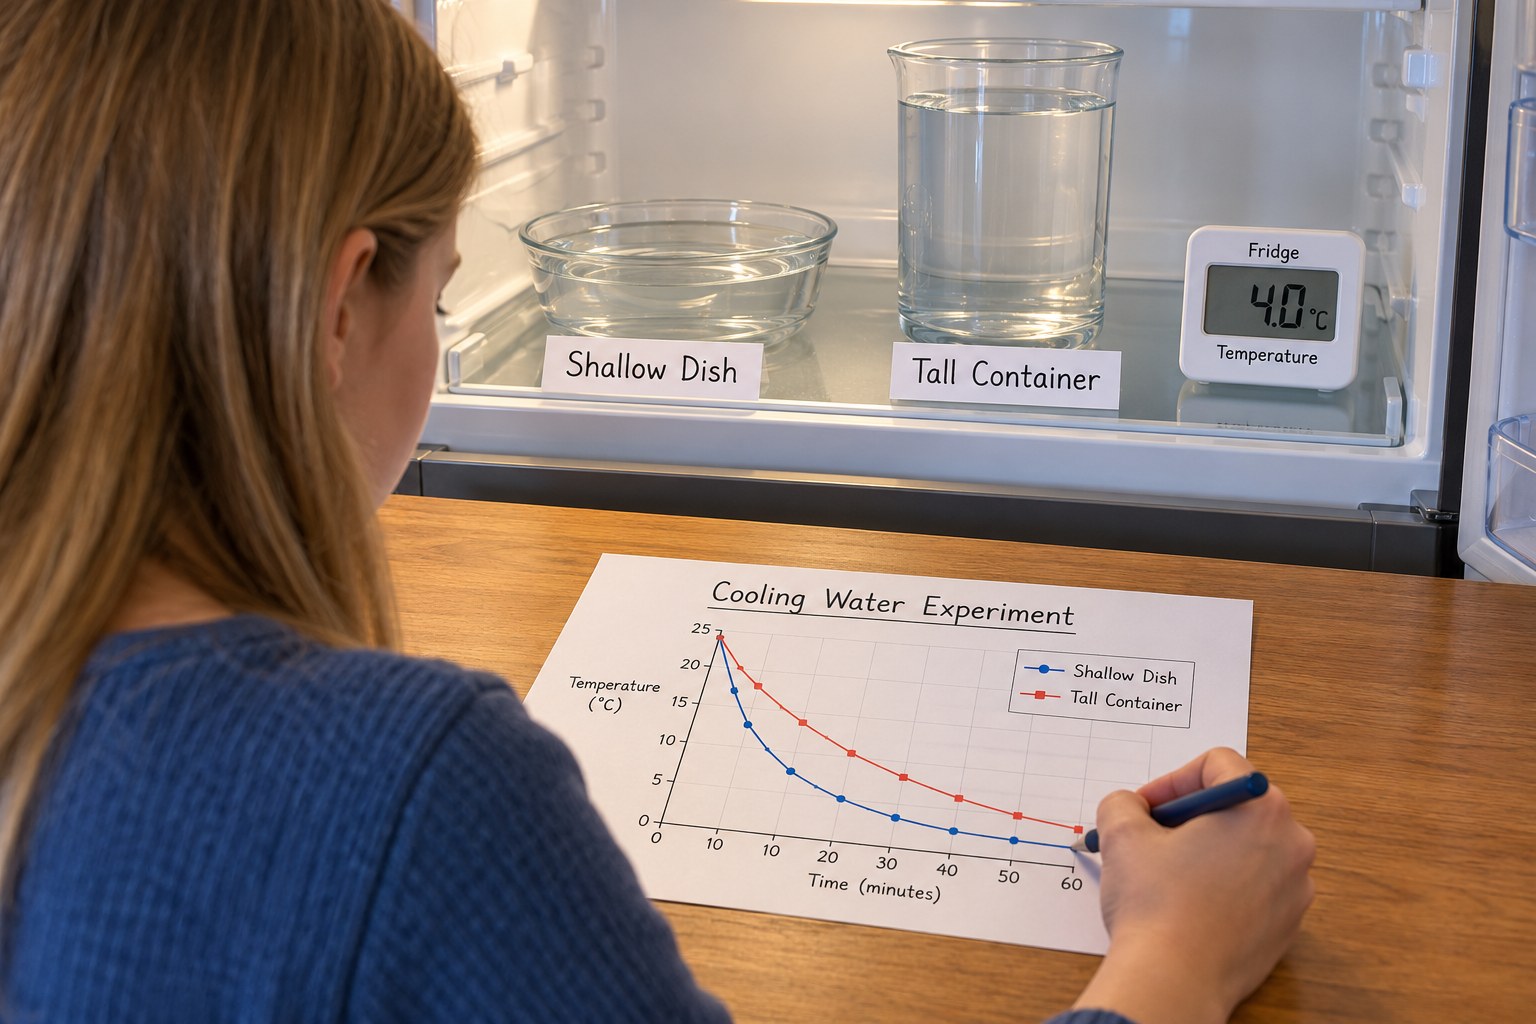
Your teen learns the food safety 'danger zone' and the 2-hour rule for holiday leftovers, then runs an experiment cooling the same amount of hot water in a deep container and a shallow container in the fridge, graphs temperature over time and explains why shallow containers keep leftovers safer.
Objective
Your teen will collect temperature-over-time data, graph two cooling curves, describe where each function decreases quickly or slowly and whether it is linear, and apply the results to safe leftover storage.
Standards
Materials
| Item | Quantity |
|---|---|
| Instant-read kitchen thermometer (2 if possible) | 1-2 |
| Deep container, such as a tall plastic food container or large mug | 1 |
| Shallow container, such as a pie plate or wide food storage dish | 1 |
| Hot tap water (not boiling) | 4 cups |
| Liquid measuring cup | 1 |
| Timer, graph paper and pencil | 1 each |
Vocabulary
Preparation
- Make space on one fridge shelf for both containers side by side.
- Run the hot tap until it is as hot as it gets (usually 110 to 130 degrees F). An adult can pour if the water is very hot; do not use boiling water.
Introduction
Ask: 'After a big Thanksgiving meal, the leftovers sit on the table while everyone talks for hours. Is that a problem? And does it matter what container we use?'
Why do we keep food in the fridge at all?
Will a deep pot of gravy or a shallow dish of gravy cool faster? Why?
Steps
Conclusion
Ask your teen to write a 3-sentence rule for the family's Thanksgiving leftovers using their data. The shallow container cools faster because more surface area lets heat escape, so leftovers should be divided into shallow containers and refrigerated within 2 hours.
Make your own lesson plan in minutes
Describe a topic and Resource Portal AI writes the objectives, materials and steps for your group.
Try Resource Portal AI