Lesson planNilometer Data: Ancient Egypt's Flood Statistics
Math45 minutesGrades: 6th, 7th
Overview
Analyze Nile flood heights the way Egypt's officials did.
Description
Your teen learns how Egyptians measured the Nile's yearly flood with Nilometers, then analyzes a practice data set of 12 flood peaks with a dot plot, box plot, mean, median, interquartile range and mean absolute deviation, and judges what the numbers meant for farmers and taxes.
Objective
Your teen will display flood-height data in a dot plot and box plot, calculate the mean, median, IQR and MAD, and interpret them in the context of harvests and taxes in ancient Egypt.
Standards
6.SP.4Math · Grade 6 · Statistics & Probability Display numerical data in plots on a number line, including dot plots, histograms, and box plots.
6.SP.5cMath · Grade 6 · Statistics & Probability Giving quantitative measures of center (median and/or mean) and variability (interquartile range and/or mean absolute deviation), as well as describing any overall pattern and any striking deviations from the overall pattern with reference to the context in which the data were gathered.
Materials
| Item | Quantity |
|---|
| Practice flood data and Pliny's flood scale (see Additional Sections) | 1 copy per teen |
| Graph paper or lined paper | 2 sheets per teen |
| Pencil, ruler and calculator | 1 each per teen |
| Sticky notes or small paper squares (optional, for a hands-on dot plot) | 12 |
Vocabulary
Nilometer
A structure with measuring marks, often stairs or a well beside the river, used to measure the Nile's water level.
Cubit
An Egyptian unit of length, based on the forearm; the royal cubit was about 52 centimeters.
Interquartile range (IQR)
The spread of the middle half of the data: the upper quartile minus the lower quartile.
Mean absolute deviation (MAD)
The average distance of the data values from the mean.
Inundation
The yearly flooding of the Nile valley, called Akhet by Egyptians.
Preparation
- Copy the data table and Pliny's scale. Make it clear to your teen that the 12 values are a practice data set in the realistic range of recorded floods, not real records from specific years.
- Draw a number line from 11 to 19 cubits on graph paper, marked in whole cubits.
Introduction
Ask: if your family's food for the whole year depended on how high a river rose in one season, how would you want to track it? Egyptian officials did exactly that, and used the numbers to predict the harvest and set taxes.
Is the average flood the most useful number, or does the spread matter too?
What would one very low year do to a farming community?
Steps
1Step 1
How a Nilometer worked
(6 min) Read the About section and the Nilometer notes together. Your teen explains in one sentence why a reading in summer helped officials plan the whole year.
2Step 2
Dot plot
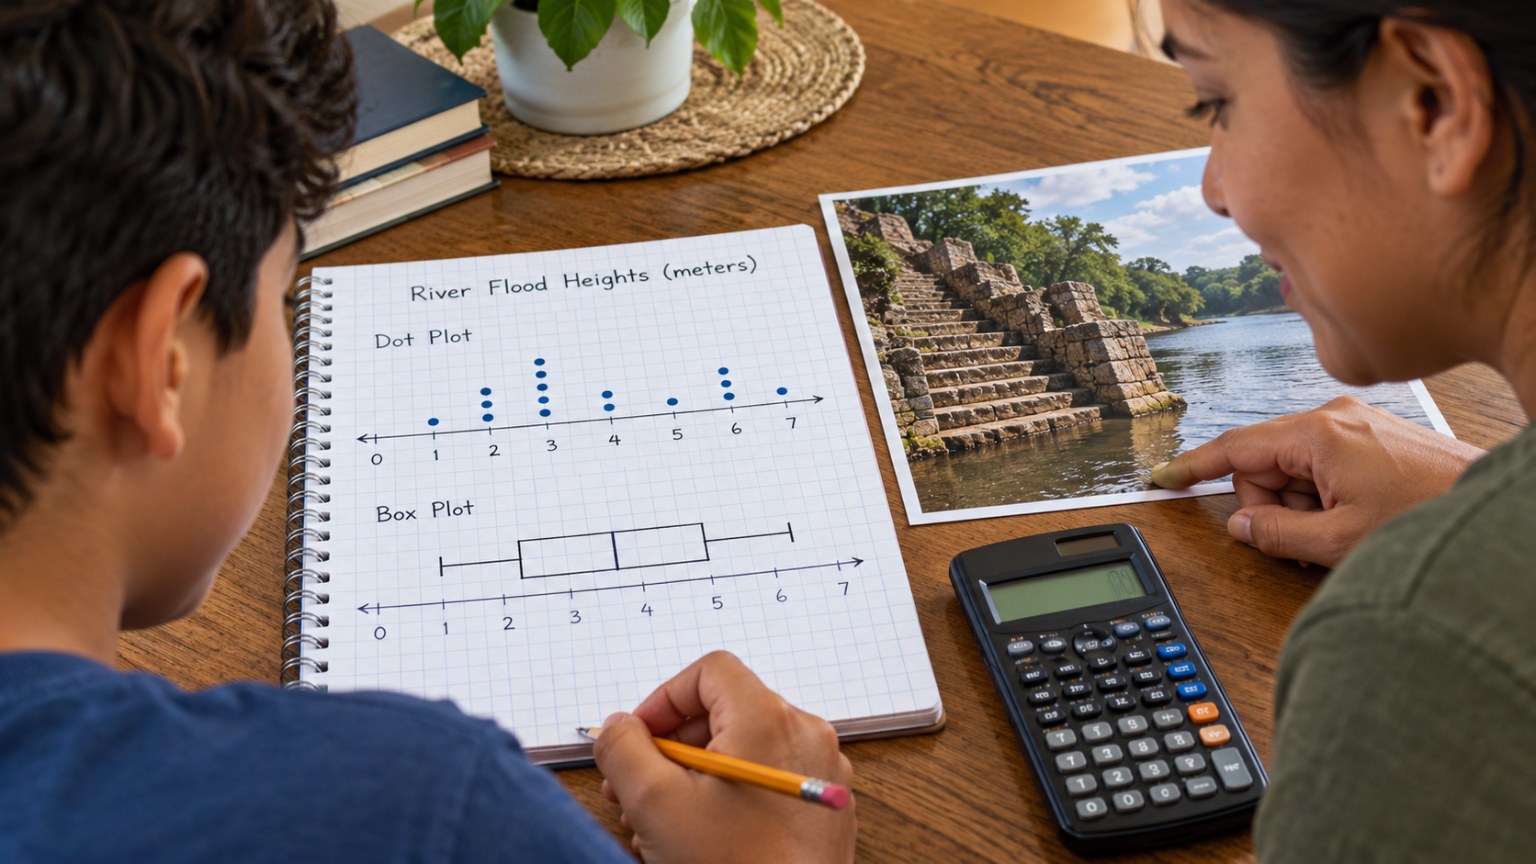
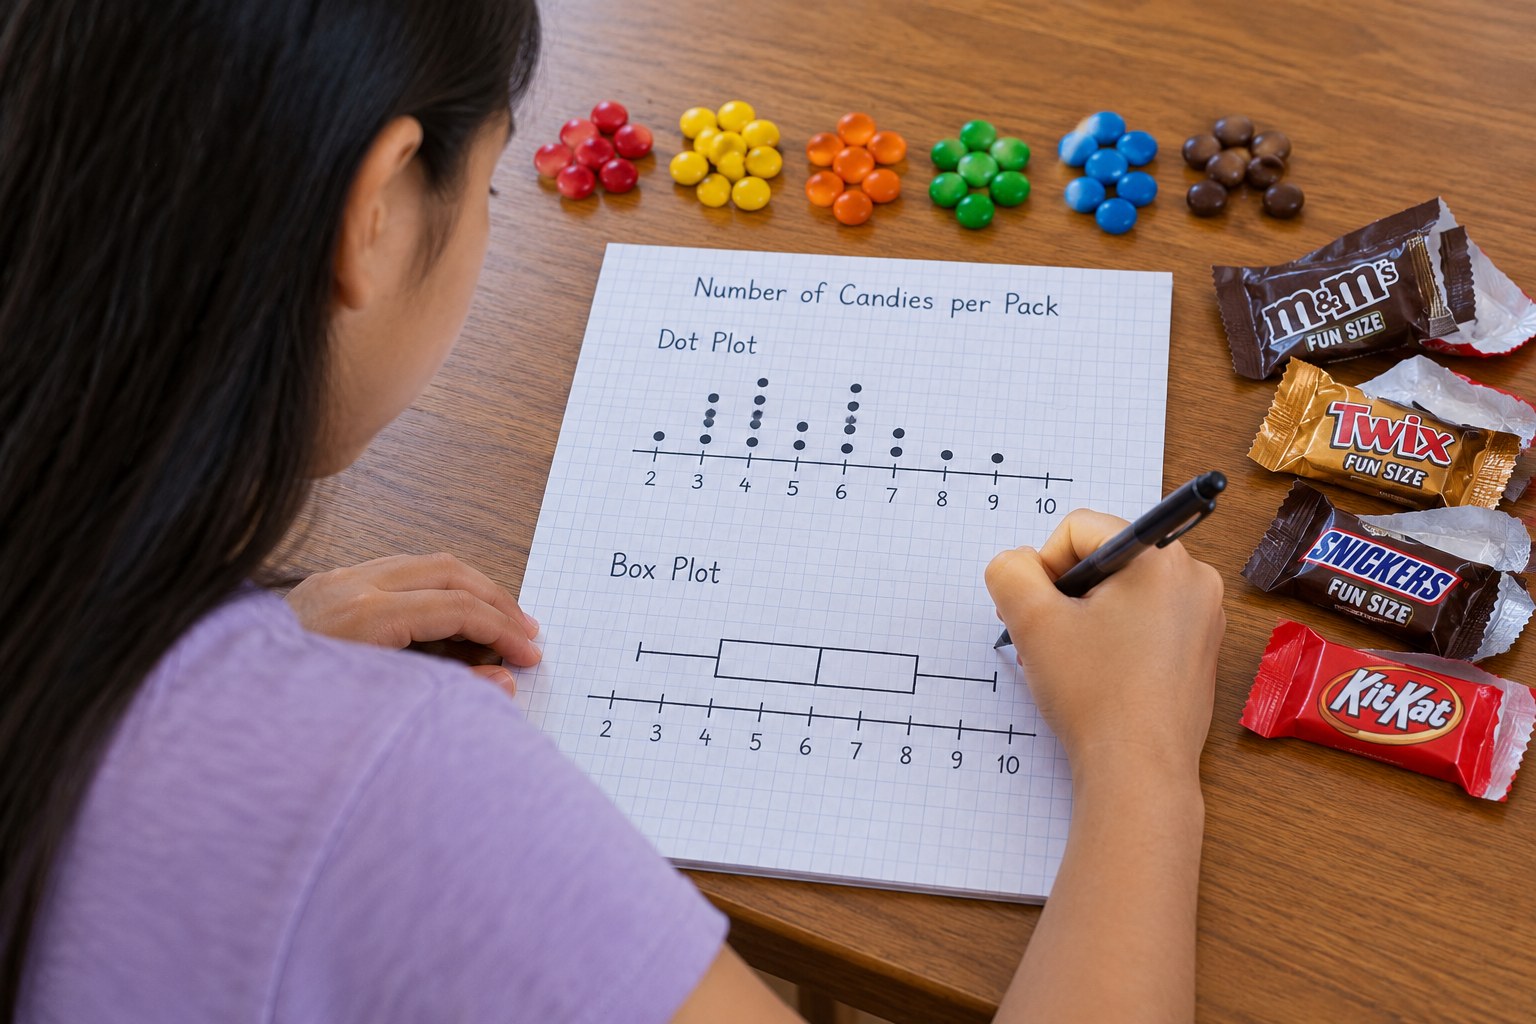
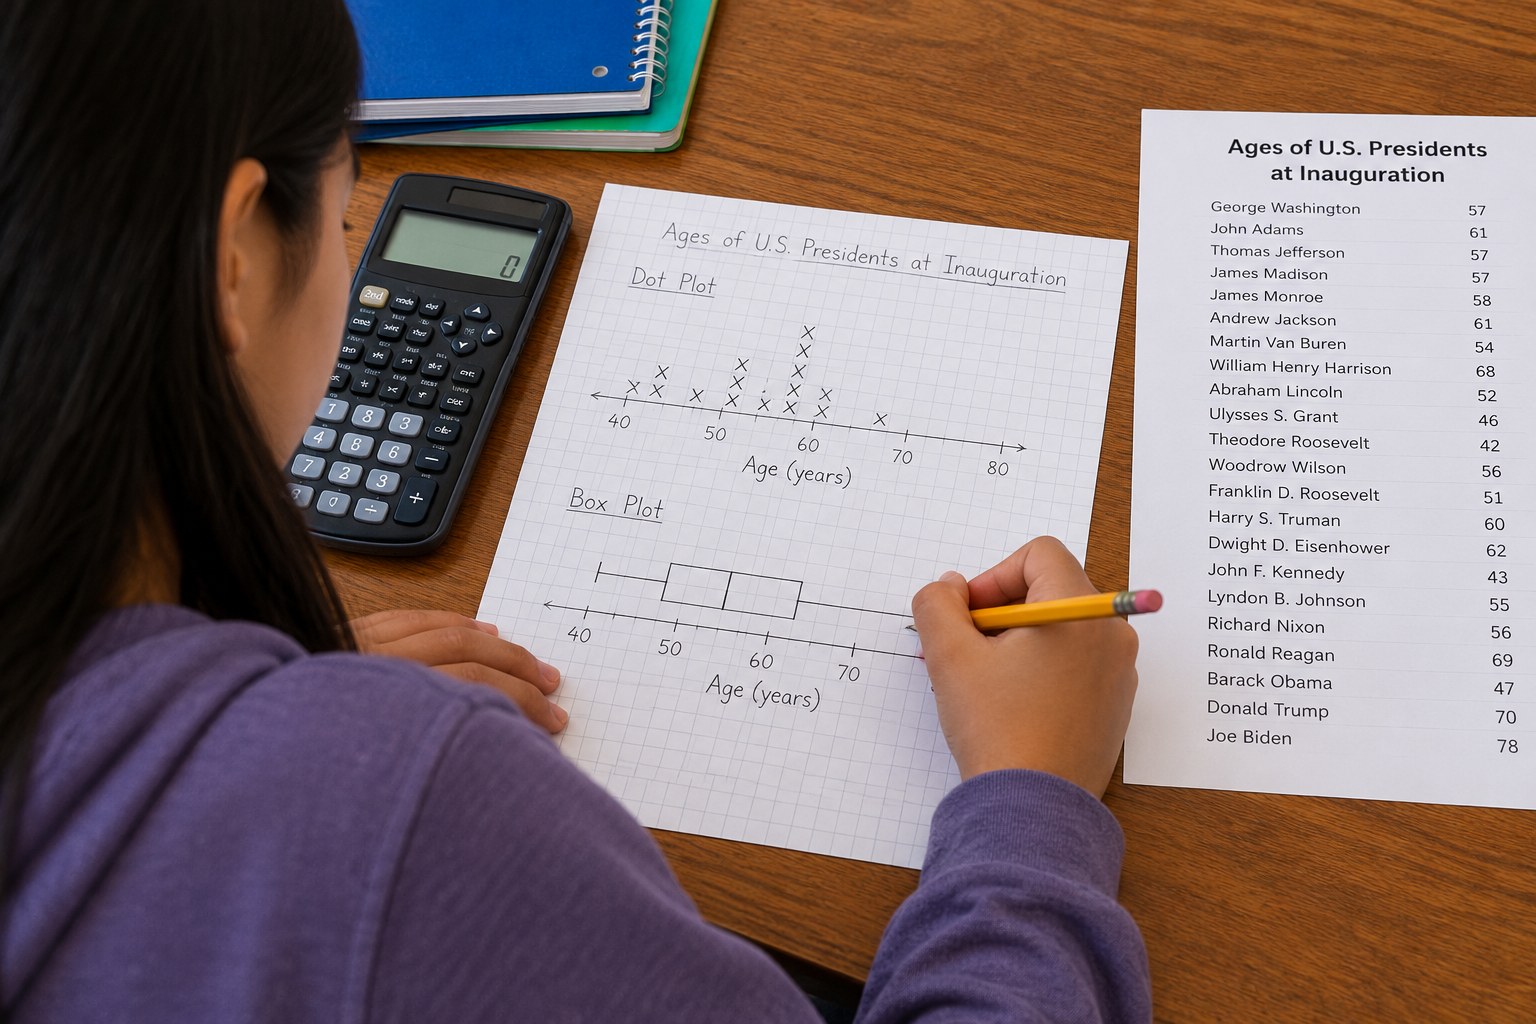
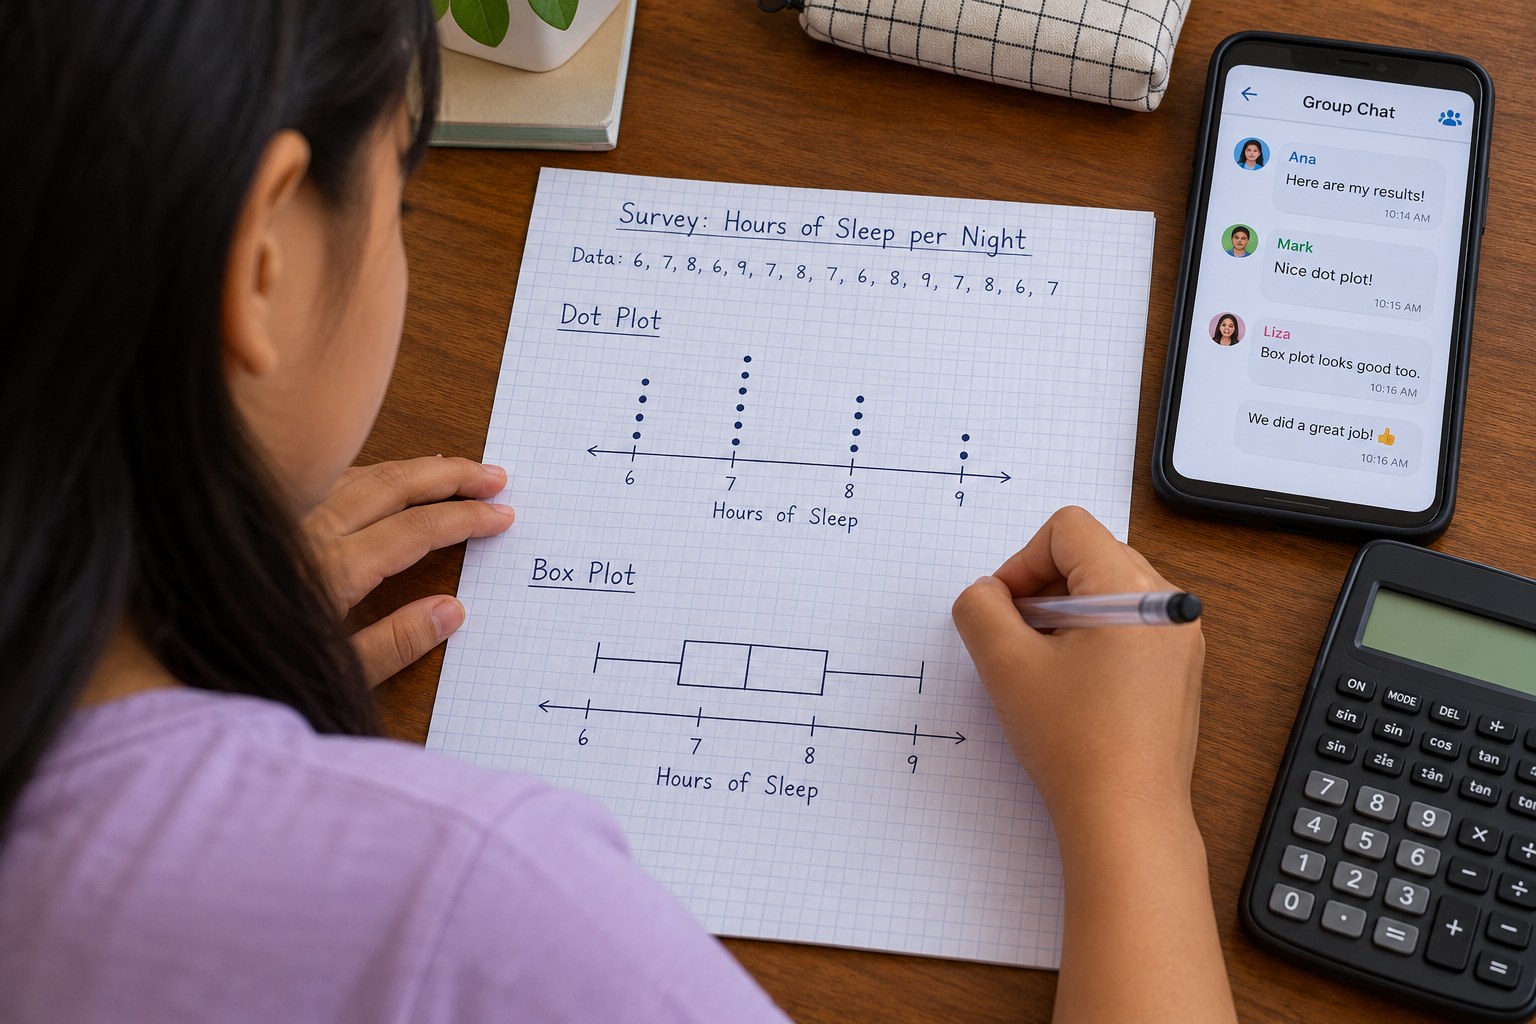
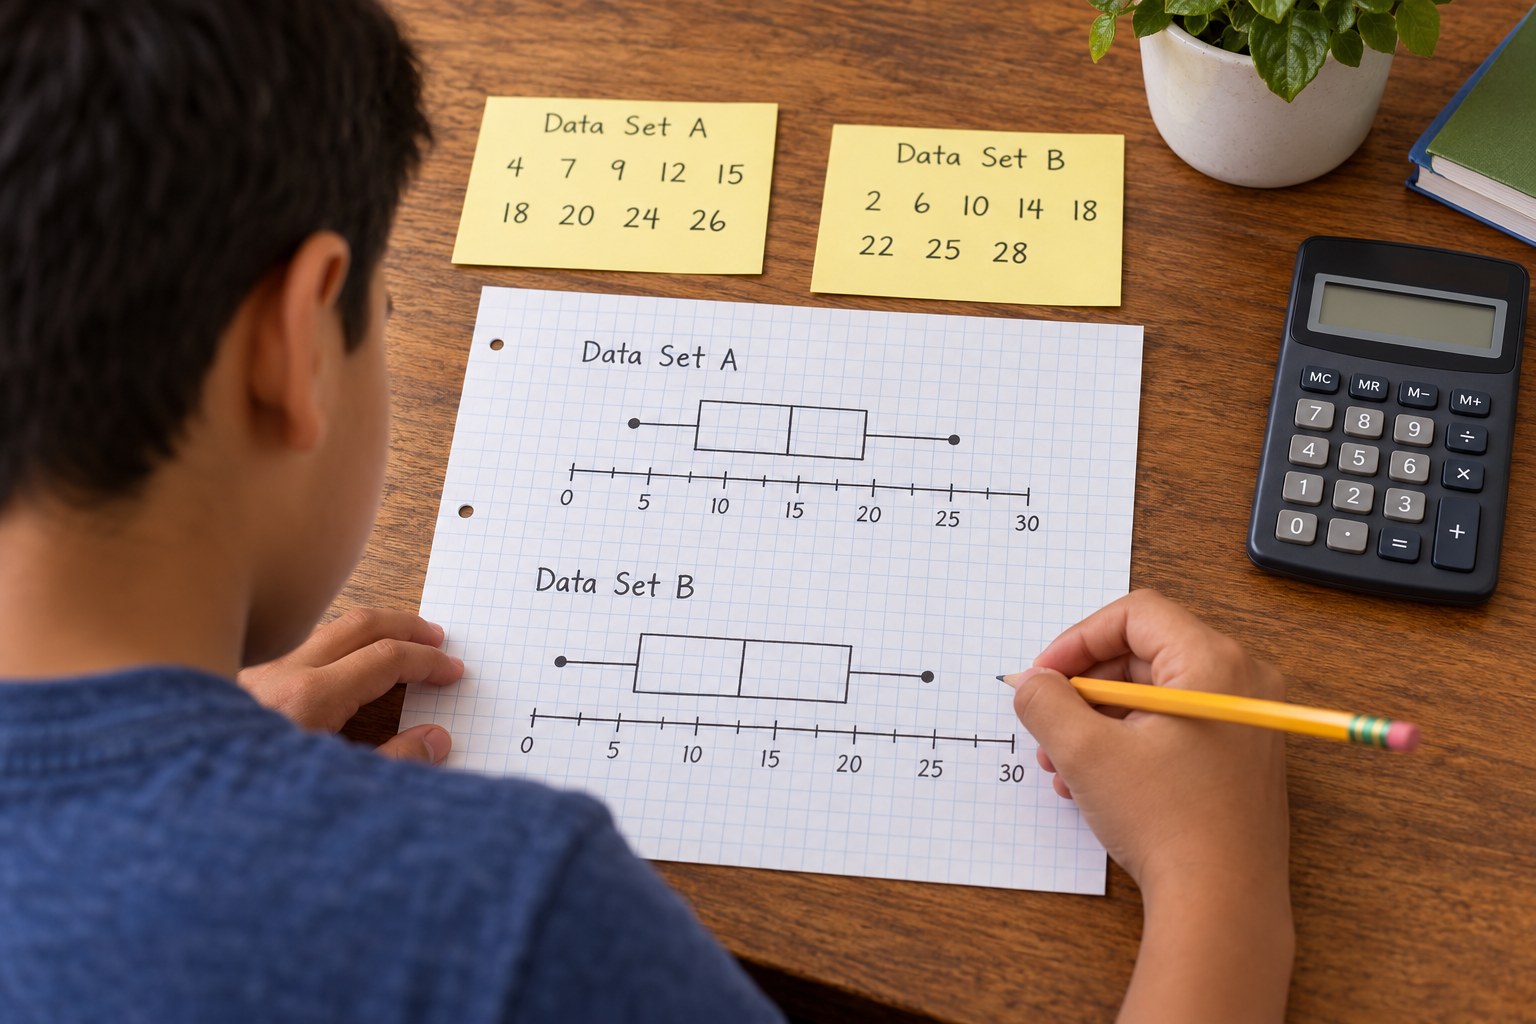
(7 min) Your teen plots the 12 flood peaks as a dot plot on the number line, stacking dots or sticky notes for repeated values. They describe the shape: where the data cluster and whether any values sit apart.
3Step 3
Center
(8 min) Your teen calculates the mean and median, showing work. They decide which better describes a 'typical' flood and why, noting how the low value of 12 pulls the mean.
4Step 4
Spread
(12 min) Your teen finds the quartiles and IQR, draws a box plot above the dot plot, and calculates the MAD by finding each value's distance from the mean. They write one sentence explaining what each spread measure says about how dependable the flood was.
5Step 5
Interpret for Egypt
(12 min) Using Pliny's scale, your teen counts how many years were 'abundance' (16 or more), 'security' (15), or 'hardship' (13 or less) and gives percents. They write a short report to a pharaoh's official: what the data say, which year would worry them most, and why storing grain in good years made sense.
Conclusion
Ask your teen: if officials only looked at the mean, what would they miss? Connect the answer to why measuring variability matters today for rainfall, river levels and food supplies.
Make your own lesson plan in minutes
Describe a topic and Resource Portal AI writes the objectives, materials and steps for your group.
Try Resource Portal AI