Lesson planSports Day Air Pressure Lab: Pump Strokes vs. Bounce Height
Science45 minutesGrades: 7th, 8th
Overview
Pump, drop, measure and graph how air pressure changes a bounce.
Description
Your teen lets some air out of a playground ball or basketball, then adds air two pump strokes at a time, drop-testing the ball from the same height after each step, and builds a scatter plot to describe how inflation affects bounce and why sports-day referees check ball pressure.
Objective
Your teen will collect bivariate data on pump strokes and bounce height, build a scatter plot, describe the pattern of association, fit an informal trend line and explain the physics of the bounce.
Standards
8.SP.1Math · Grade 8 · Statistics & Probability Construct and interpret scatter plots for bivariate measurement data to investigate patterns of association between two quantities. Describe patterns such as clustering, outliers, positive or negative association, linear association, and nonlinear association.
8.SP.2Math · Grade 8 · Statistics & Probability Know that straight lines are widely used to model relationships between two quantitative variables. For scatter plots that suggest a linear association, informally fit a straight line, and informally assess the model fit by judging the closeness of the data points to the line.
Materials
| Item | Quantity |
|---|
| Playground ball or basketball | 1 |
| Ball pump with an inflation needle | 1 |
| Tape measure and painter's tape | 1 each |
| Phone with slow-motion video (helpful) or a second person as a spotter | 1 |
| Graph paper, ruler and pencil | 1 each |
| Hard, flat floor next to a wall or garage door | 1 |
Vocabulary
Air pressure
The push of air molecules on the inside walls of the ball.
Bivariate data
Data with two variables measured for each trial, like strokes and bounce height.
Association
A pattern showing how one variable changes as the other changes.
Nonlinear
A pattern that curves instead of following a straight line.
Energy loss
Energy that turns into sound and heat instead of bounce.
Preparation
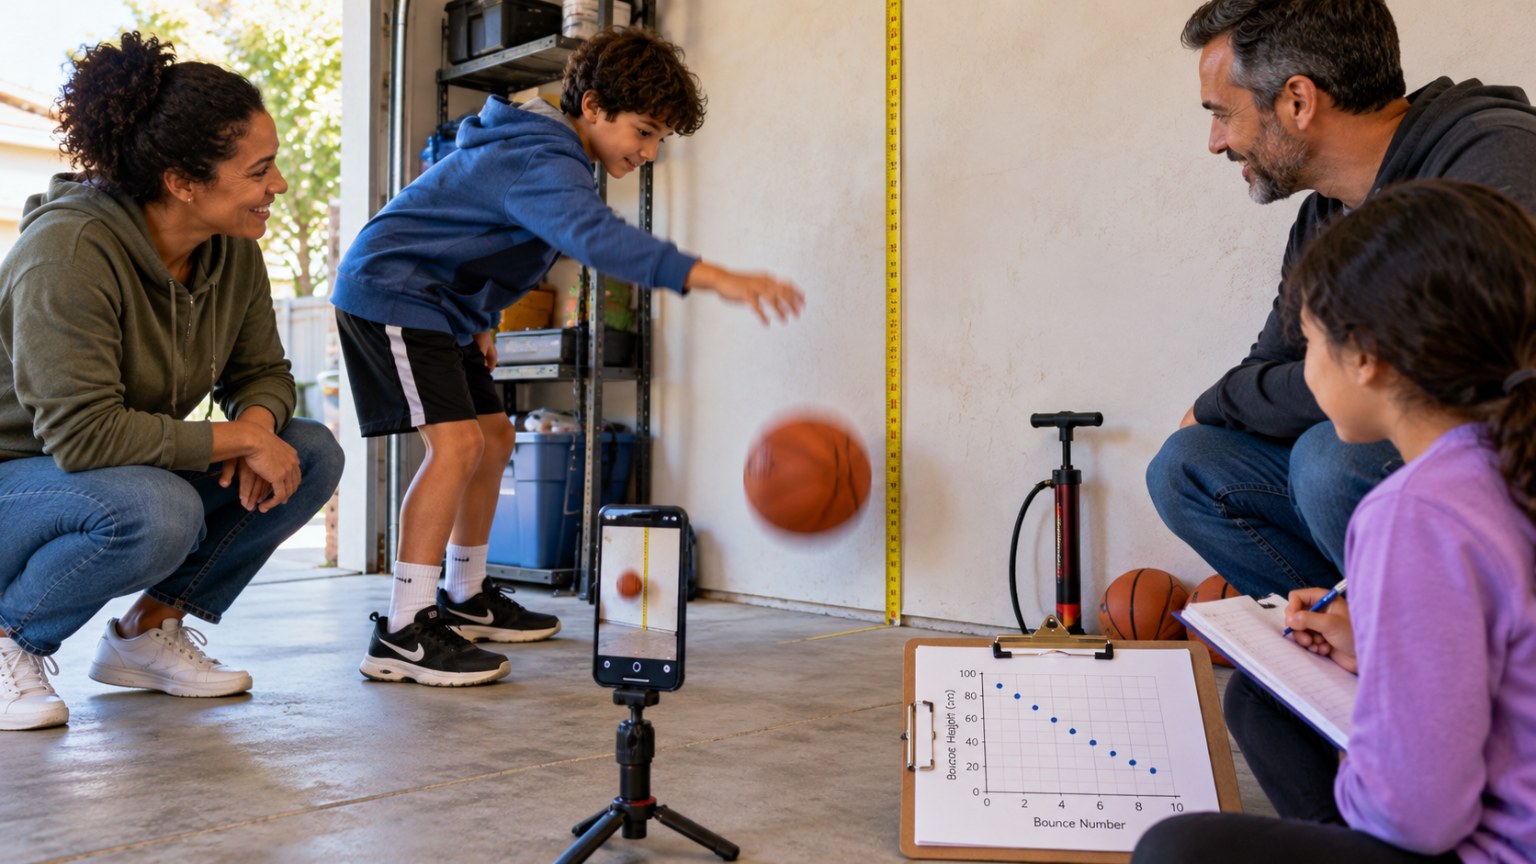
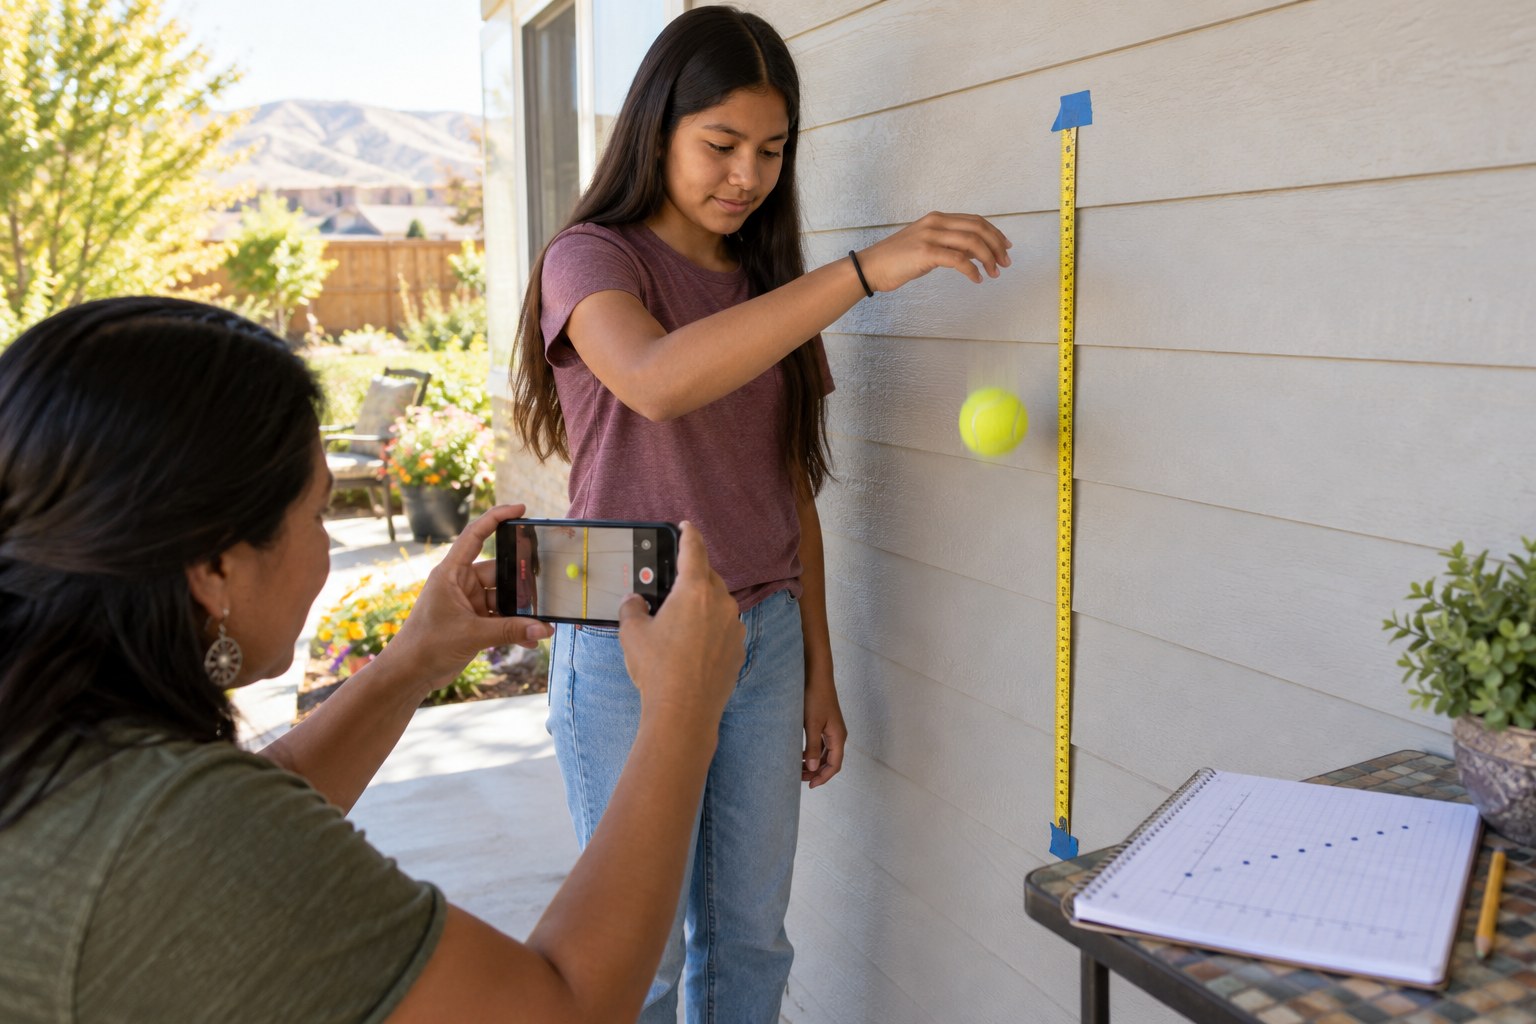
- Tape a tape measure vertically to the wall from the floor to 150 cm. Put a strip of tape at 150 cm as the drop line.
- Check the recommended pressure printed near the ball's valve, and never pump past it. Wet the needle before inserting it so it does not damage the valve.
Introduction
Squeeze the ball and say: 'At sports day, someone always says this ball is flat. Today we find out exactly how much air matters, with data.'
What do you predict the graph of pump strokes vs. bounce height will look like?
Will each extra pump stroke always add the same amount of bounce?
Steps
1Step 1
Set the starting point
(6 min) Your teen inserts the needle and lets air out until the ball is soft but still round. They write a hypothesis and a data table with columns for pump strokes, Try 1, Try 2 and Average bounce (cm).
2Step 2
Drop test
(16 min) Your teen holds the bottom of the ball at the 150 cm line and lets go without pushing while a spotter or slow-motion video records the height the bottom of the ball reaches on the first bounce. They do 2 drops, add 2 full pump strokes, and repeat until 12 strokes or the recommended pressure, whichever comes first.
3Step 3
Plot the data
(9 min) Your teen graphs pump strokes on the x-axis and average bounce height on the y-axis as a scatter plot. They describe the association: positive or negative, strong or weak, linear or nonlinear.
4Step 4
Fit and judge a line
(7 min) Your teen lays a ruler to draw a trend line through the middle of the points and judges how well it fits. Ask: where are the points farthest from the line, and does a curve fit better?
5Step 5
Explain the physics
(6 min) Your teen reads 'The science' section and writes a 3-sentence explanation of the pattern using the words pressure, deform and energy. They decide what bounce height they would accept as 'game ready' for sports day.
Conclusion
Ask: why do official leagues set inflation rules for balls? How could a sports day volunteer check balls quickly without a pressure gauge?
Make your own lesson plan in minutes
Describe a topic and Resource Portal AI writes the objectives, materials and steps for your group.
Try Resource Portal AI