Lesson planFun-Size Bag Statistics: How Many Pieces Really Come in a Halloween Pack?
Math40 minutesGrades: 6th
Overview
Count, plot and describe the pieces in fun-size packs.
Description
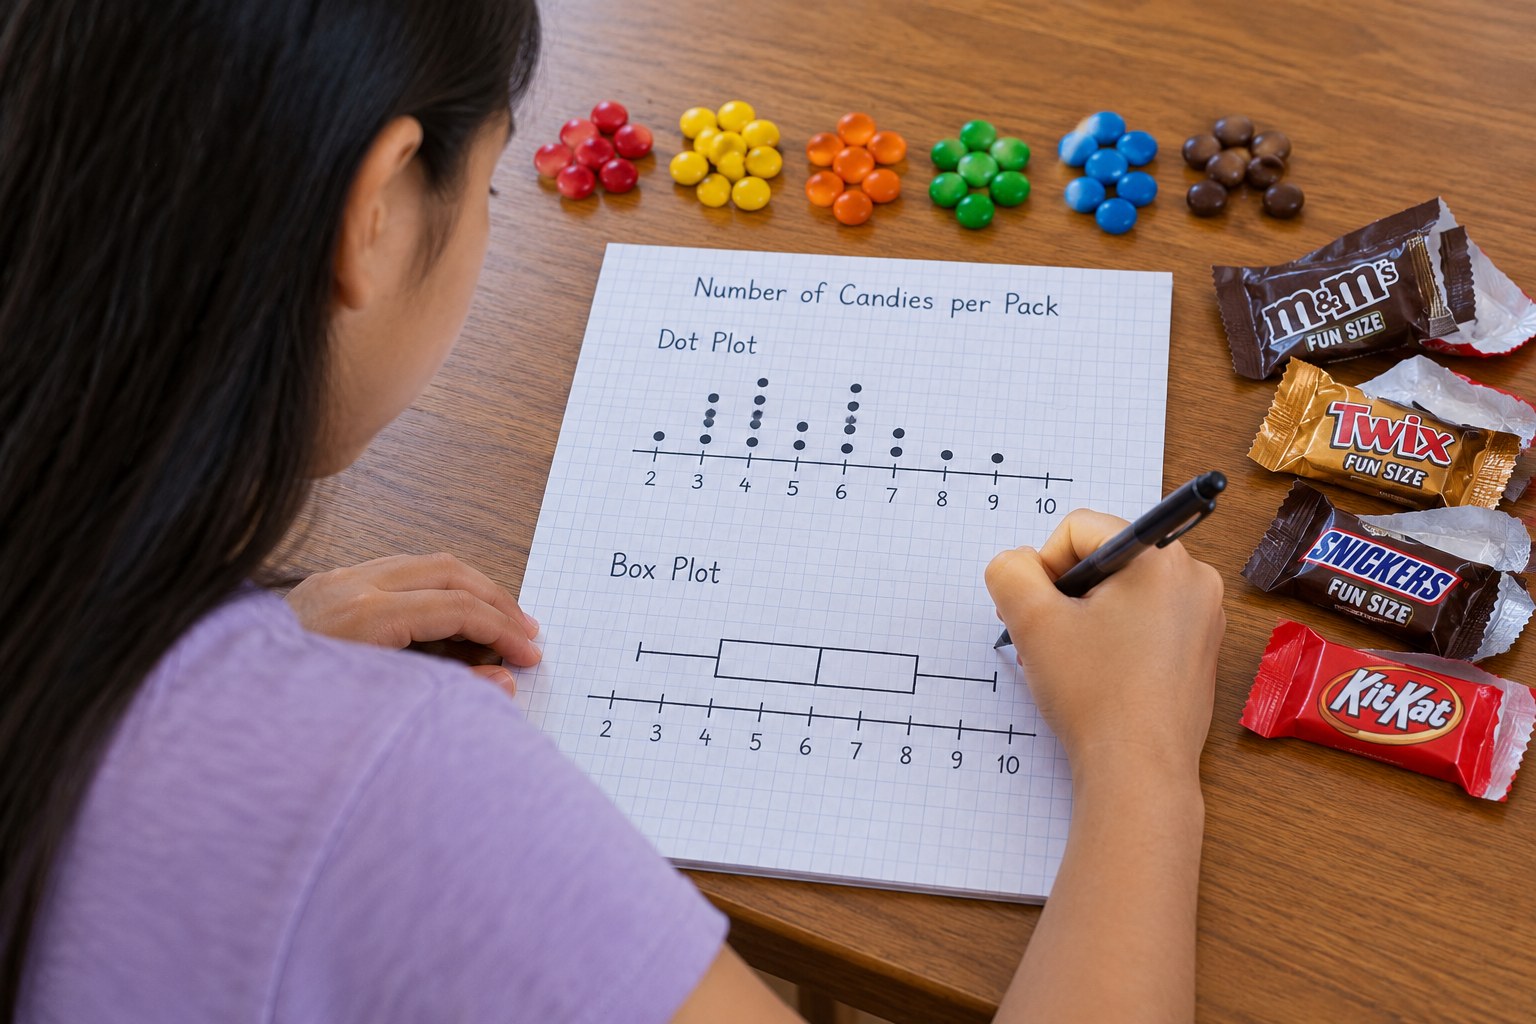
Your teen counts the pieces in 12-20 fun-size Halloween packs of one small candy (or mini snack packs of raisins or crackers), builds a dot plot and a box plot, and uses the median, mean and interquartile range to describe what a 'typical' pack holds.
Objective
Your teen will collect real count data, display it in a dot plot and a box plot, and calculate the mean, median and interquartile range to describe the center and spread.
Standards
6.SP.4Math · Grade 6 · Statistics & Probability Display numerical data in plots on a number line, including dot plots, histograms, and box plots.
6.SP.5cMath · Grade 6 · Statistics & Probability Giving quantitative measures of center (median and/or mean) and variability (interquartile range and/or mean absolute deviation), as well as describing any overall pattern and any striking deviations from the overall pattern with reference to the context in which the data were gathered.
Materials
| Item | Quantity |
|---|
| Fun-size packs of one small candy or snack (pieces you can count) | 12-20 packs |
| Paper plates or bowls for counting | 2-3 |
| Graph paper or plain paper and ruler | 2 sheets |
| Pencil and calculator | 1 each |
| Sticky notes (optional, for a quick dot plot) | 20 |
Vocabulary
Median
The middle value when the data is put in order.
Mean
The sum of the values divided by how many values there are.
Interquartile range (IQR)
The distance between the first and third quartiles; the spread of the middle half of the data.
Box plot
A graph that shows the minimum, first quartile, median, third quartile and maximum.
Outlier
A value far away from the rest of the data.
Preparation
- Buy one bag of fun-size packs of the same candy (or use mini snack packs if your family skips candy). Check labels for allergens.
- Draw a number line on paper that covers a little below and above the counts you expect.
Introduction
Hold up two fun-size packs and ask: 'Do you think every pack has exactly the same number of pieces? Let's find out with data instead of guessing.'
What does 'typical' mean when things vary?
Which is a better summary here, the mean or the median? Why might it matter?
Steps
1Step 1
Predict and count
(10 min) Your teen writes a prediction for the typical number of pieces per pack. Then they open each pack, count the pieces on a plate, record the count in a list and keep each pack's pieces separate until counted.
2Step 2
Make a dot plot
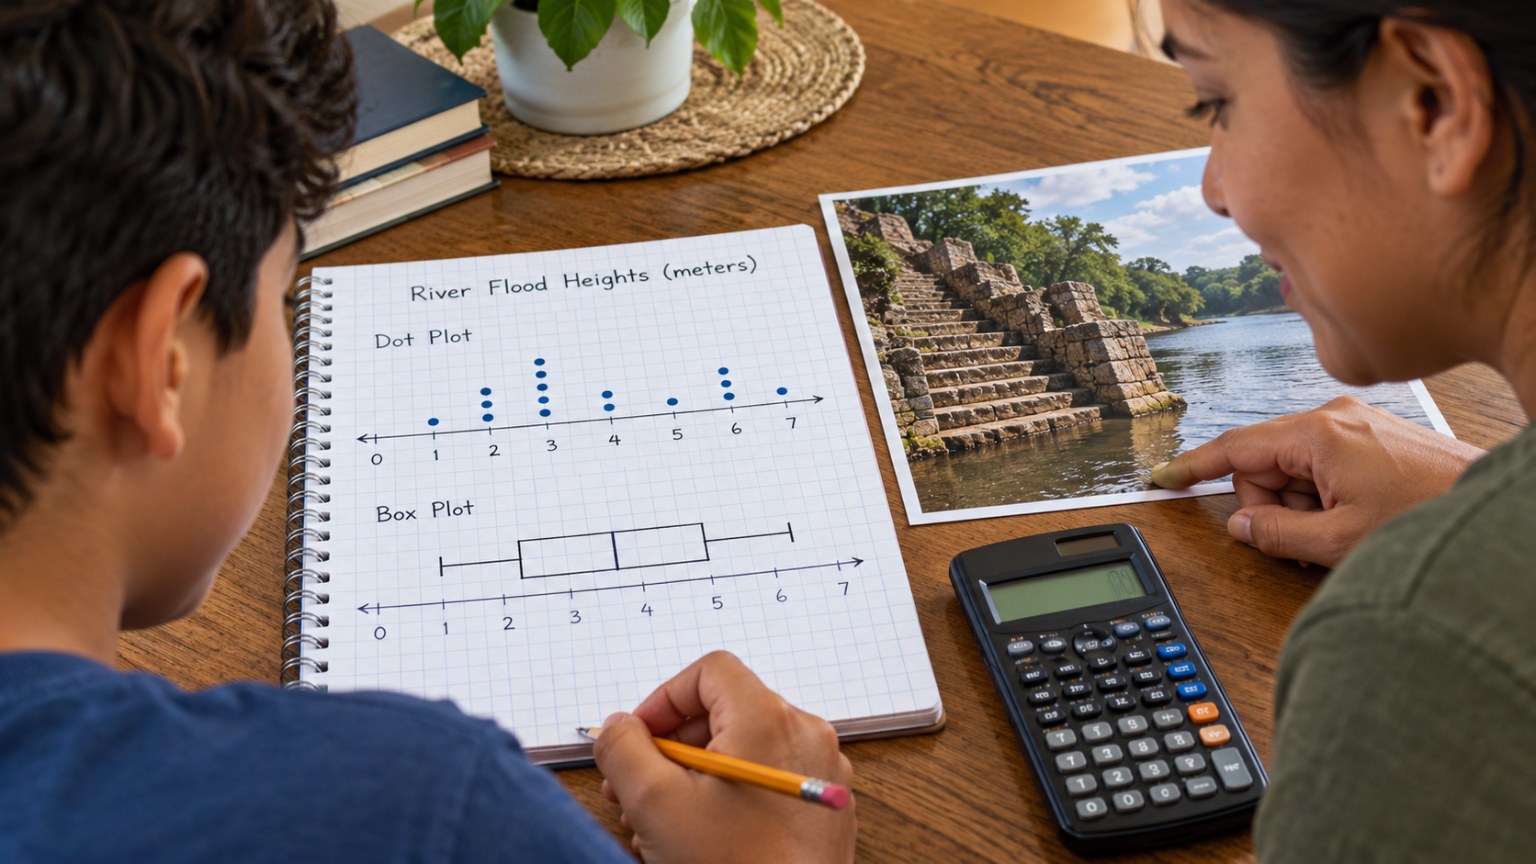
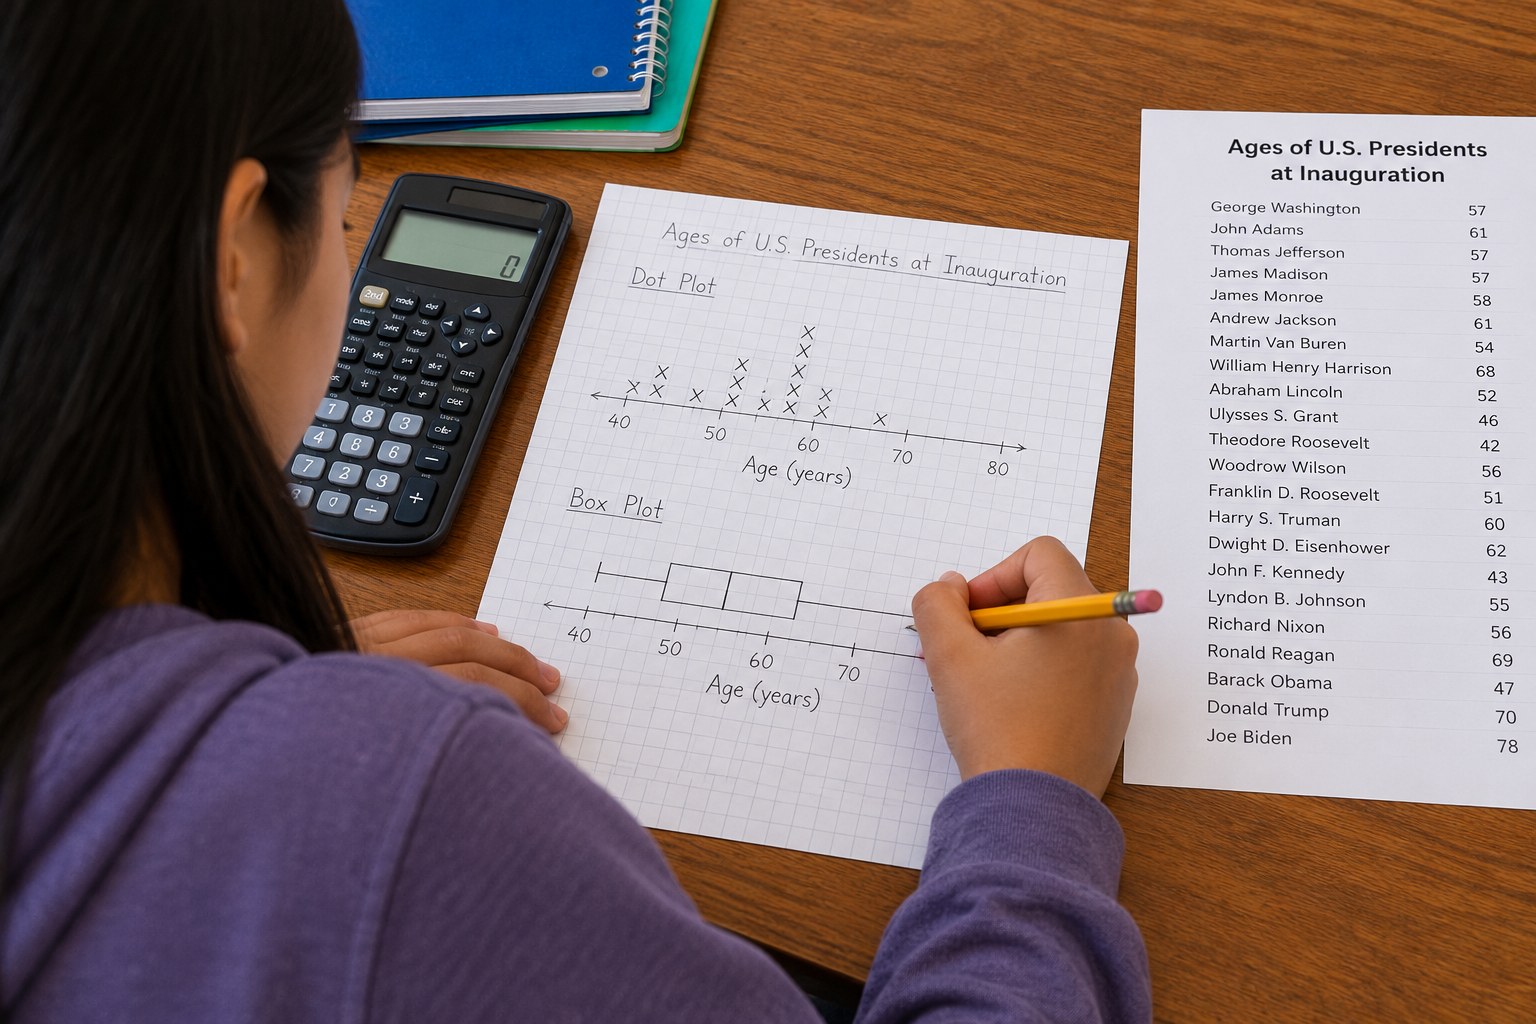
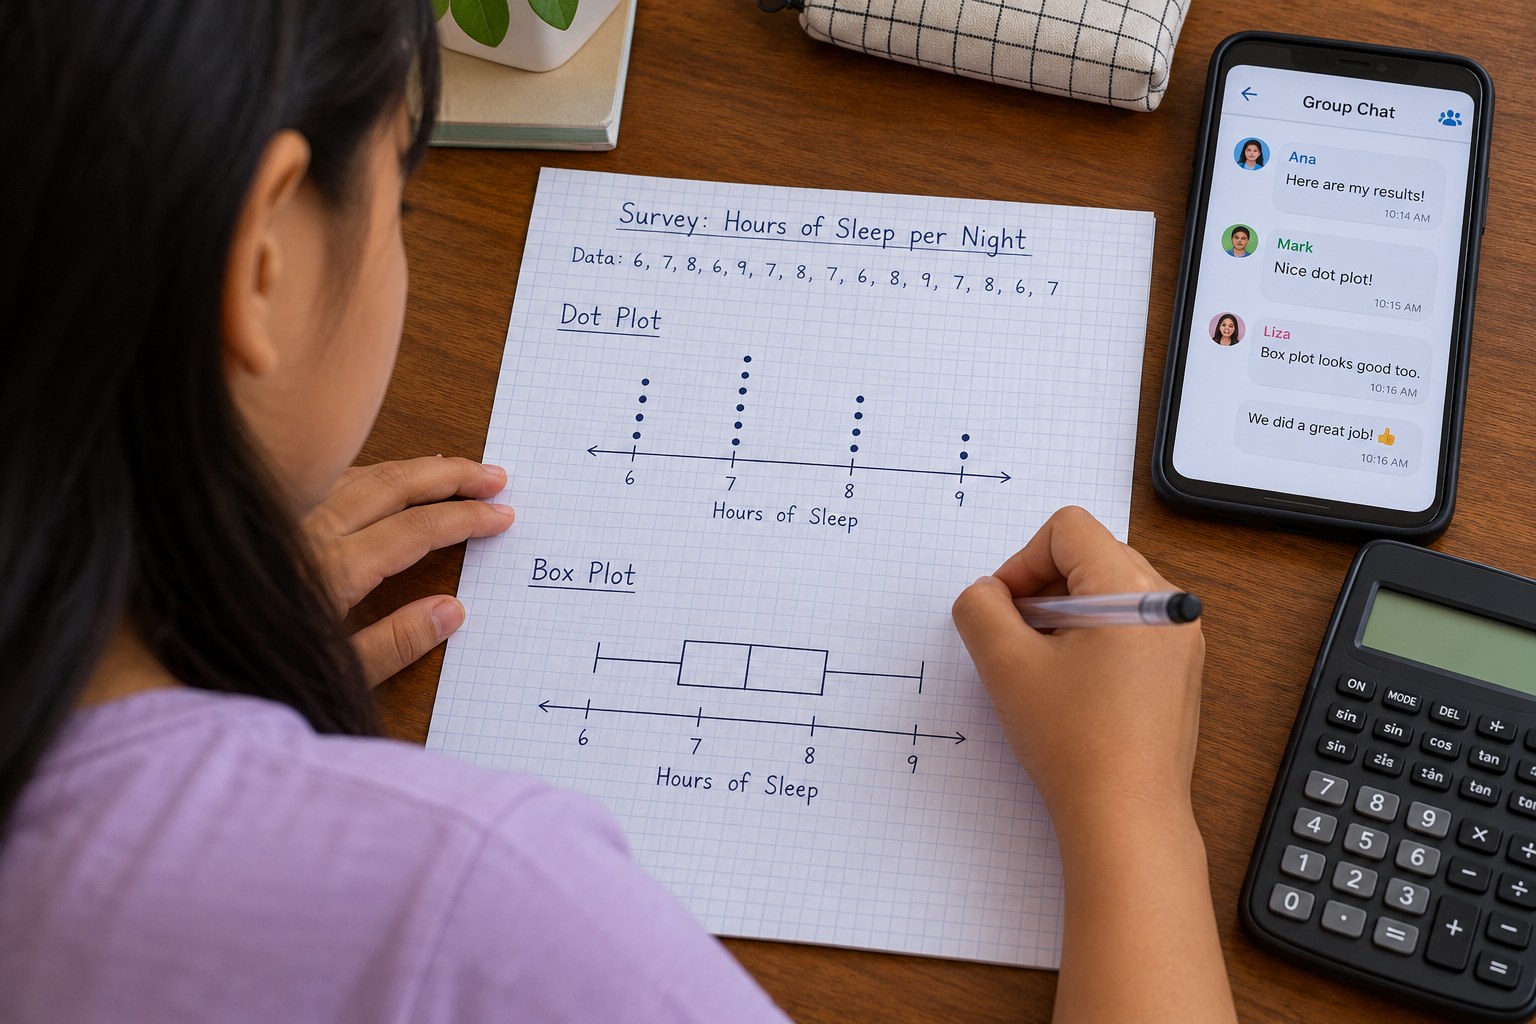
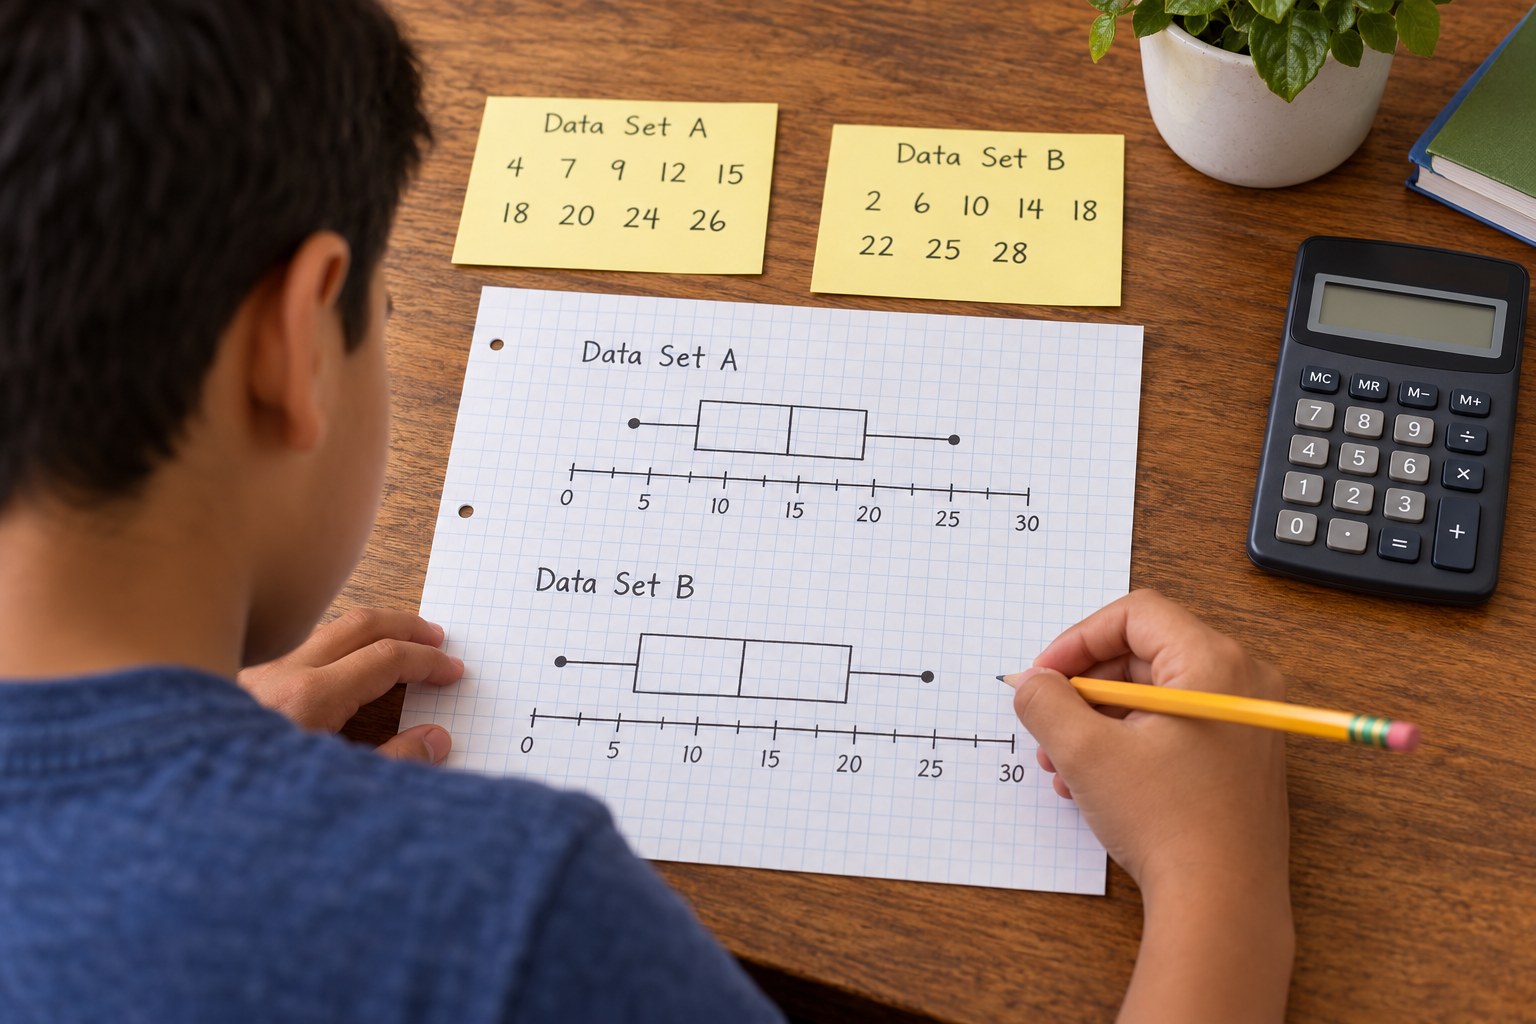
(6 min) Your teen draws a number line and places one dot (or sticky note) above the number for each pack. They describe the shape: where is the cluster, are there gaps, is anything far away?
3Step 3
Find center and spread
(10 min) Your teen orders the counts, finds the median and the mean, and then finds the first quartile, third quartile and IQR. They check whether any value is an outlier using 1.5 × IQR above Q3 or below Q1.
4Step 4
Build a box plot
(8 min) Under the dot plot, using the same number line, your teen draws the box plot from the five-number summary. They compare the two graphs and explain what each one shows better.
5Step 5
Write a data claim
(6 min) Your teen writes two sentences describing a typical pack using the median and IQR, and states whether their prediction was close. Ask: if a company printed 'about X pieces' on the bag, what number should it be?
Conclusion
Ask: why might real packs vary, and what would a factory do with this kind of data? Quality-control teams use box plots exactly like this.
Make your own lesson plan in minutes
Describe a topic and Resource Portal AI writes the objectives, materials and steps for your group.
Try Resource Portal AI