
Lesson plans for S-ID.6a
Math · High School · High School: Statistics & Probability — Interpreting Categorical & Quantitative Data
Fit a function to the data; use functions fitted to data to solve problems in the context of the data.
11 ready-to-teach lesson plans aligned to this standard. Each includes objectives, a materials list, vocabulary and step-by-step activities.
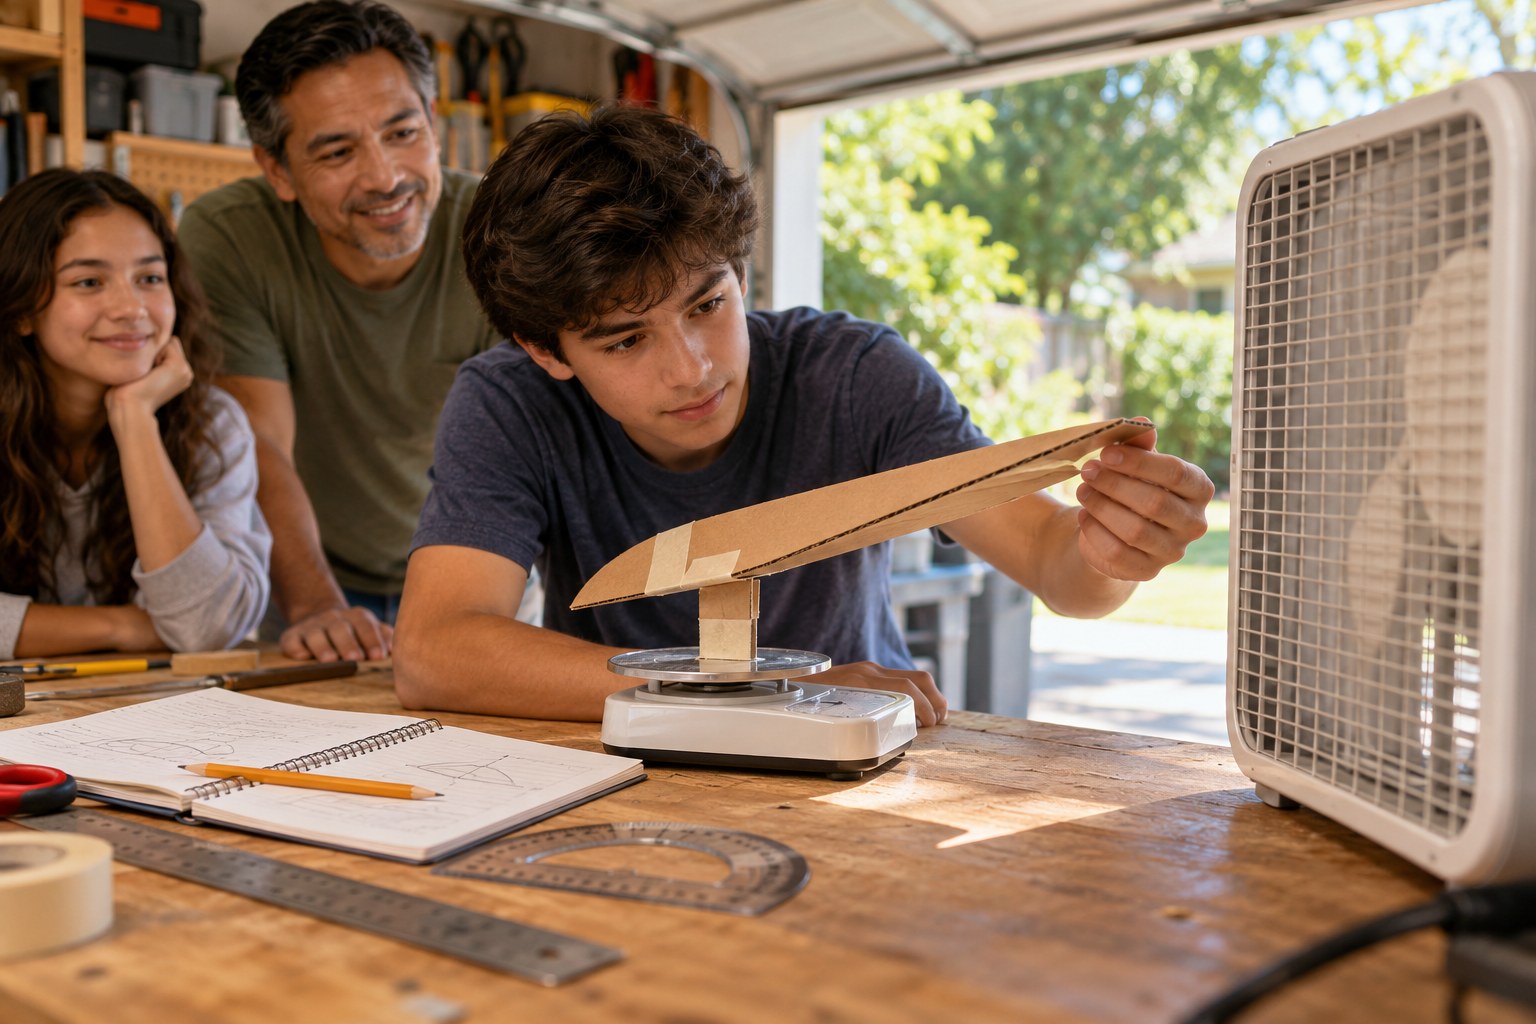
Wings That Move: Testing Active Aero With a Fan and a Kitchen Scale
Measure downforce at five wing angles with a fan and a scale.

Kepler's Third Law: Finding a Pattern in Real Planet Data
Rediscover Kepler's third law from real planet data.
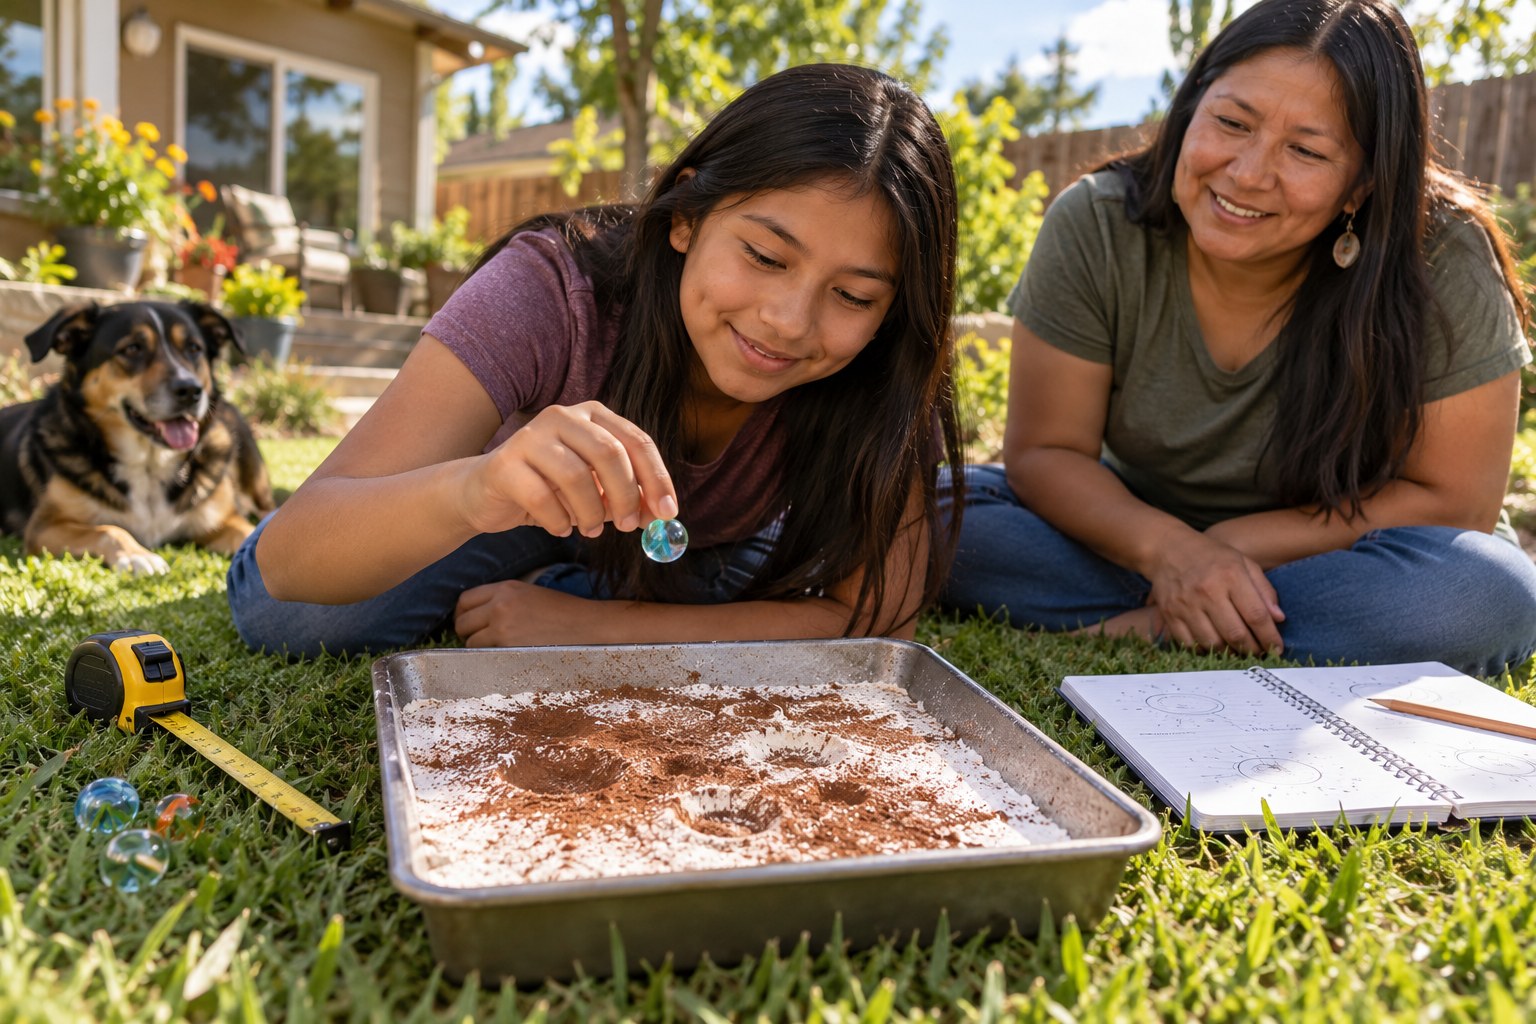
Crater Lab: Modeling Impacts with Flour, Cocoa and Marbles
Drop marbles into flour, graph the craters and fit a model.

Why Your Latte Cools Fast, Then Slow: Modeling Exponential Cooling
Measure a cooling latte and predict when it is drinkable.

Machine Learning by Hand: Fit the Best Line to Your Family's Data
Measure arm spans and train the simplest machine-learning model.
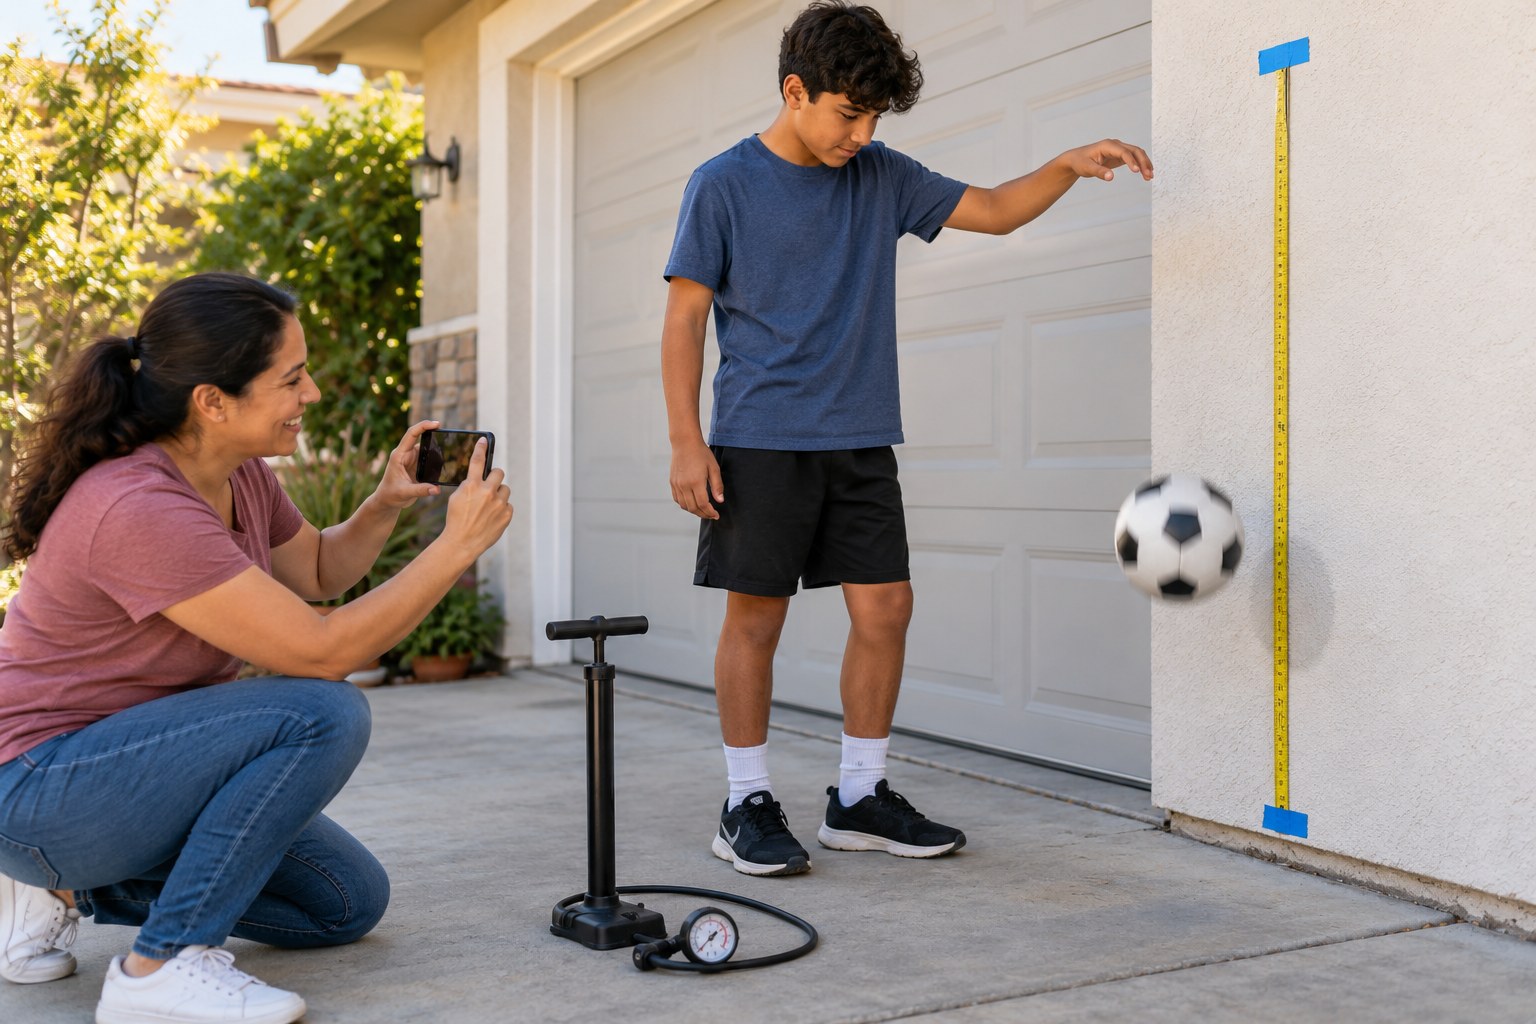
Pump It Up: How Air Pressure Changes a Ball's Bounce
Pump, drop, film and graph how pressure changes a bounce.

Cushion Science by the Numbers: Drop-Test Data and Regression
Test foams like a shoe lab and let the slope do the talking.

Stride Length vs. Height: Fitting a Line to Family Walking Data
Measure your step length and fit a line to predict anyone's.

Fit the Curve: Modeling Plant Growth and Fertilizer Yields
Fit linear and quadratic models to crop data and use them to decide.

Why Lights Fade So Fast: Fitting an Inverse-Square Model
Measure a lamp's falloff and fit y = k/x².

Cooling Cup Model: Fitting an Exponential Curve to Hot-Drink Data
Record a cooling mug and fit an exponential model to the data.
See all high school standards with lesson plans
Make a lesson like this in a minute
Pick a topic, grade, group size and length. Resource Portal AI writes the objectives, materials, steps and pictures.
Sign up FREEFree forever · no credit card needed. Members get all 5,100+ lessons for $14.99/month, with the first 7 days free.