
S-ID.6: lesson ideas
Math · High School · High School: Statistics & Probability — Interpreting Categorical & Quantitative Data
Represent data on two quantitative variables on a scatter plot, and describe how the variables are related.
Teaching this standard
S-ID.6 is part of High School Math (High School: Statistics & Probability — Interpreting Categorical & Quantitative Data). The lessons below are aligned to standards right next to it, so they build the same skills.
There is no ready-made lesson for this exact standard in the library yet. Ria, the Resource Portal AI assistant, can write one in about a minute: tell it the standard, the grade and how much time you have, and it plans the objectives, materials, vocabulary and step-by-step activities.
Lesson plans for related high school standards
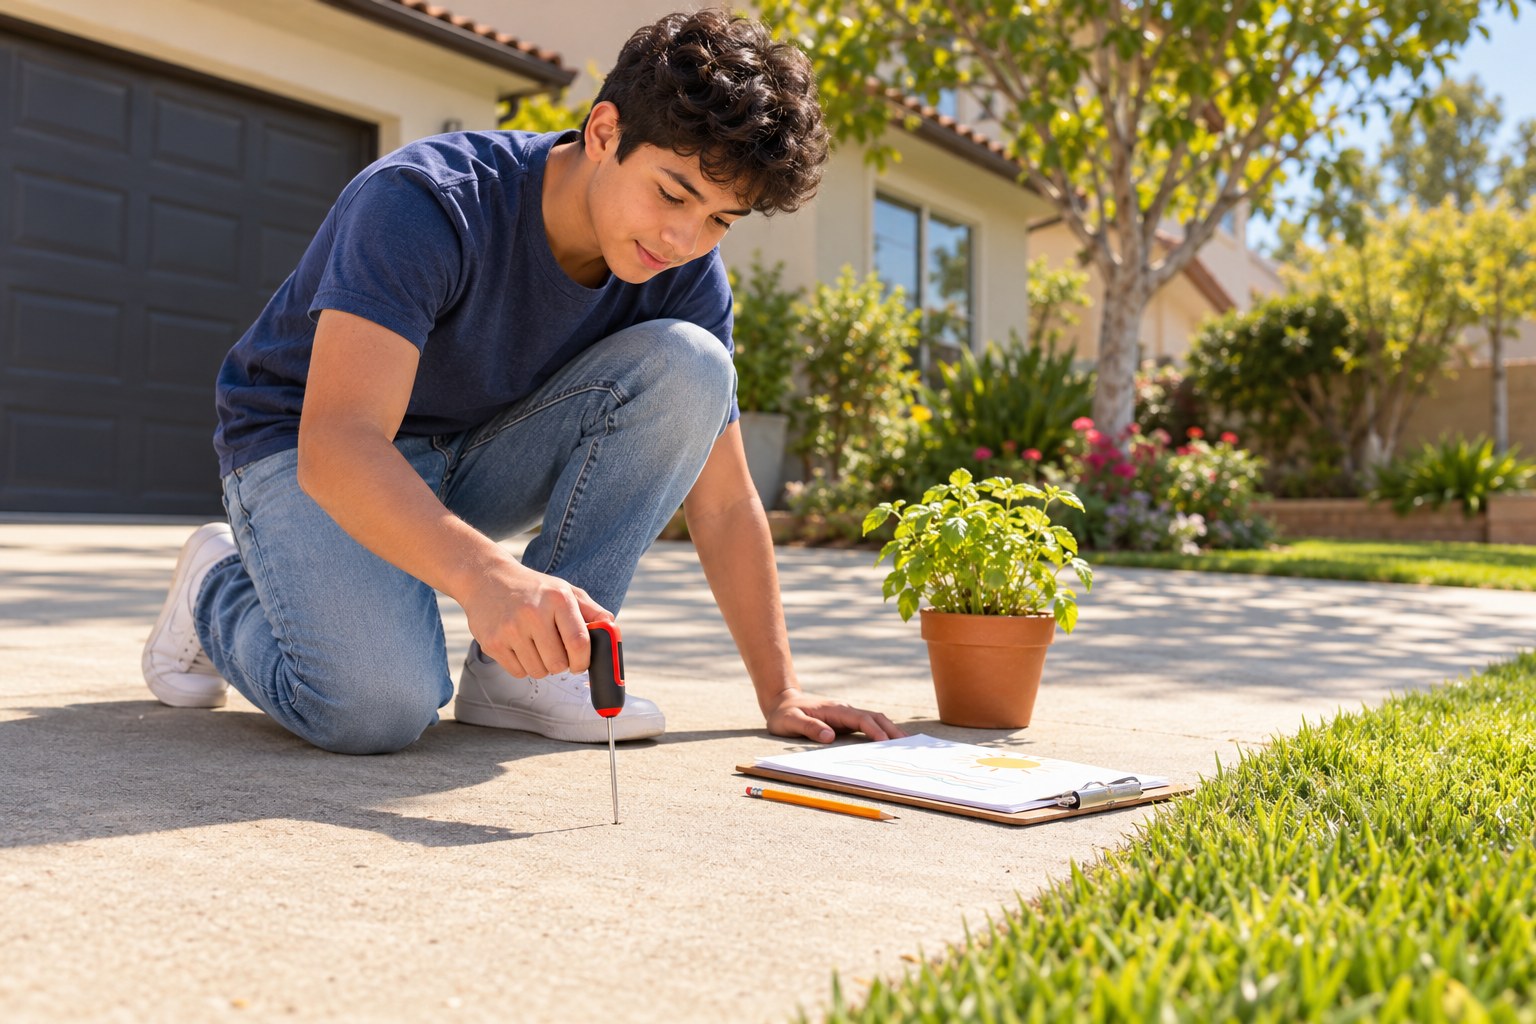
Backyard Heat Island Hunt: Measuring Surface Temps Around Your Home
Measure how hot your driveway gets, then plot the proof.
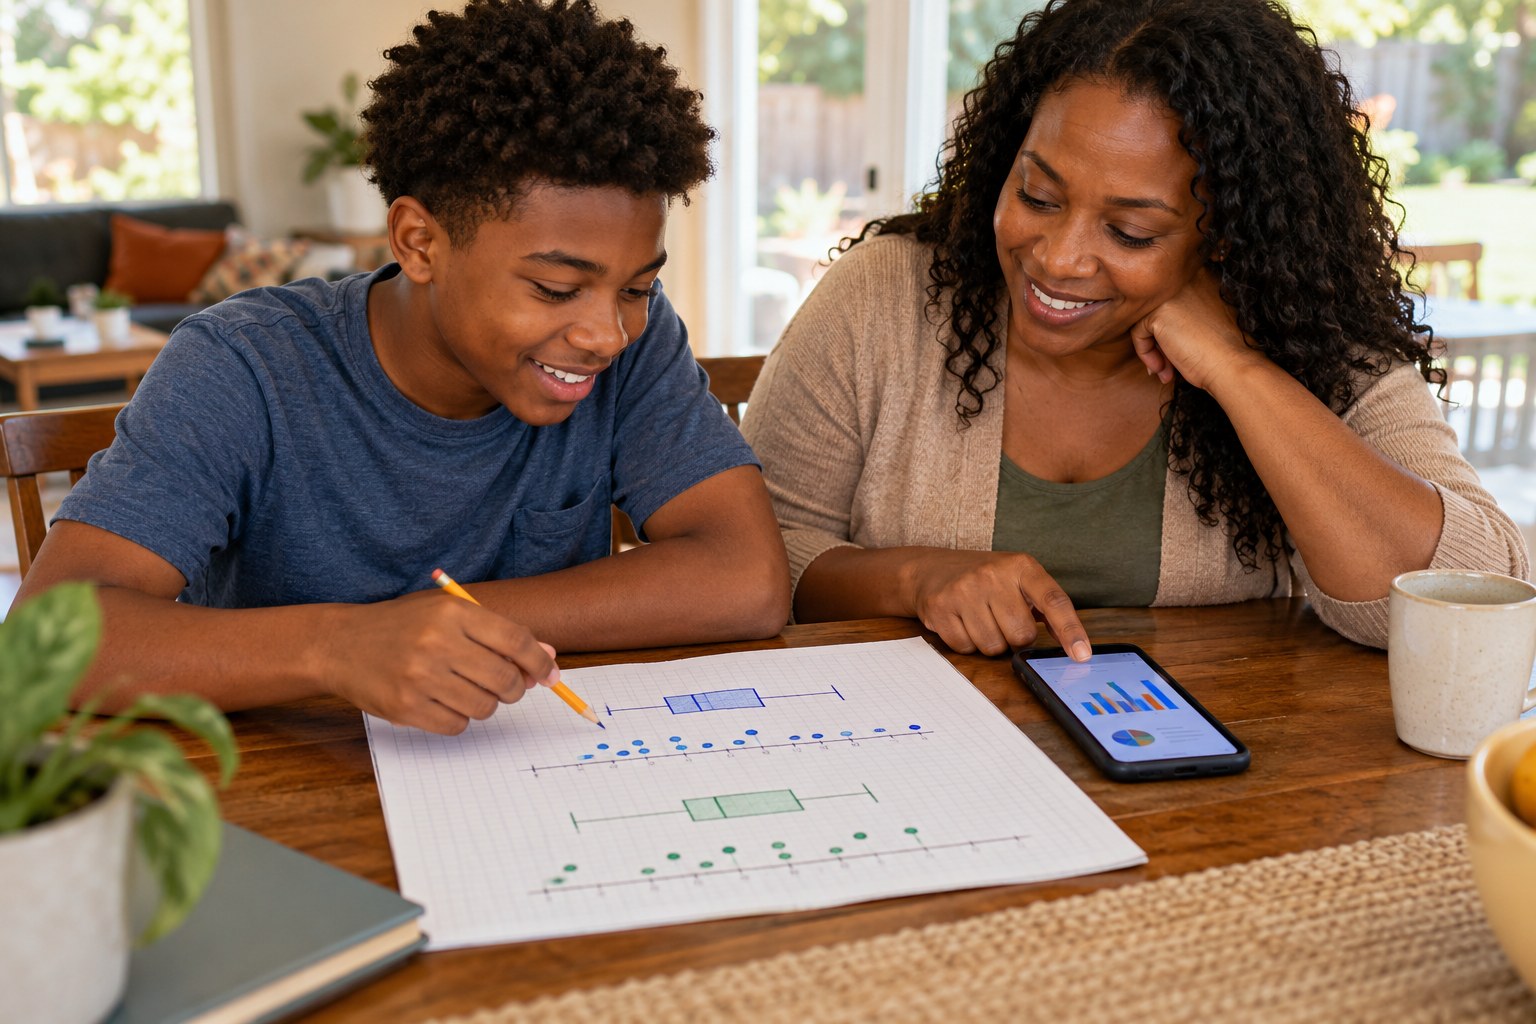
Screen Time Showdown: Teen vs Parent in Dot Plots and Box Plots
Compare two weeks of screen time with plots and stats.
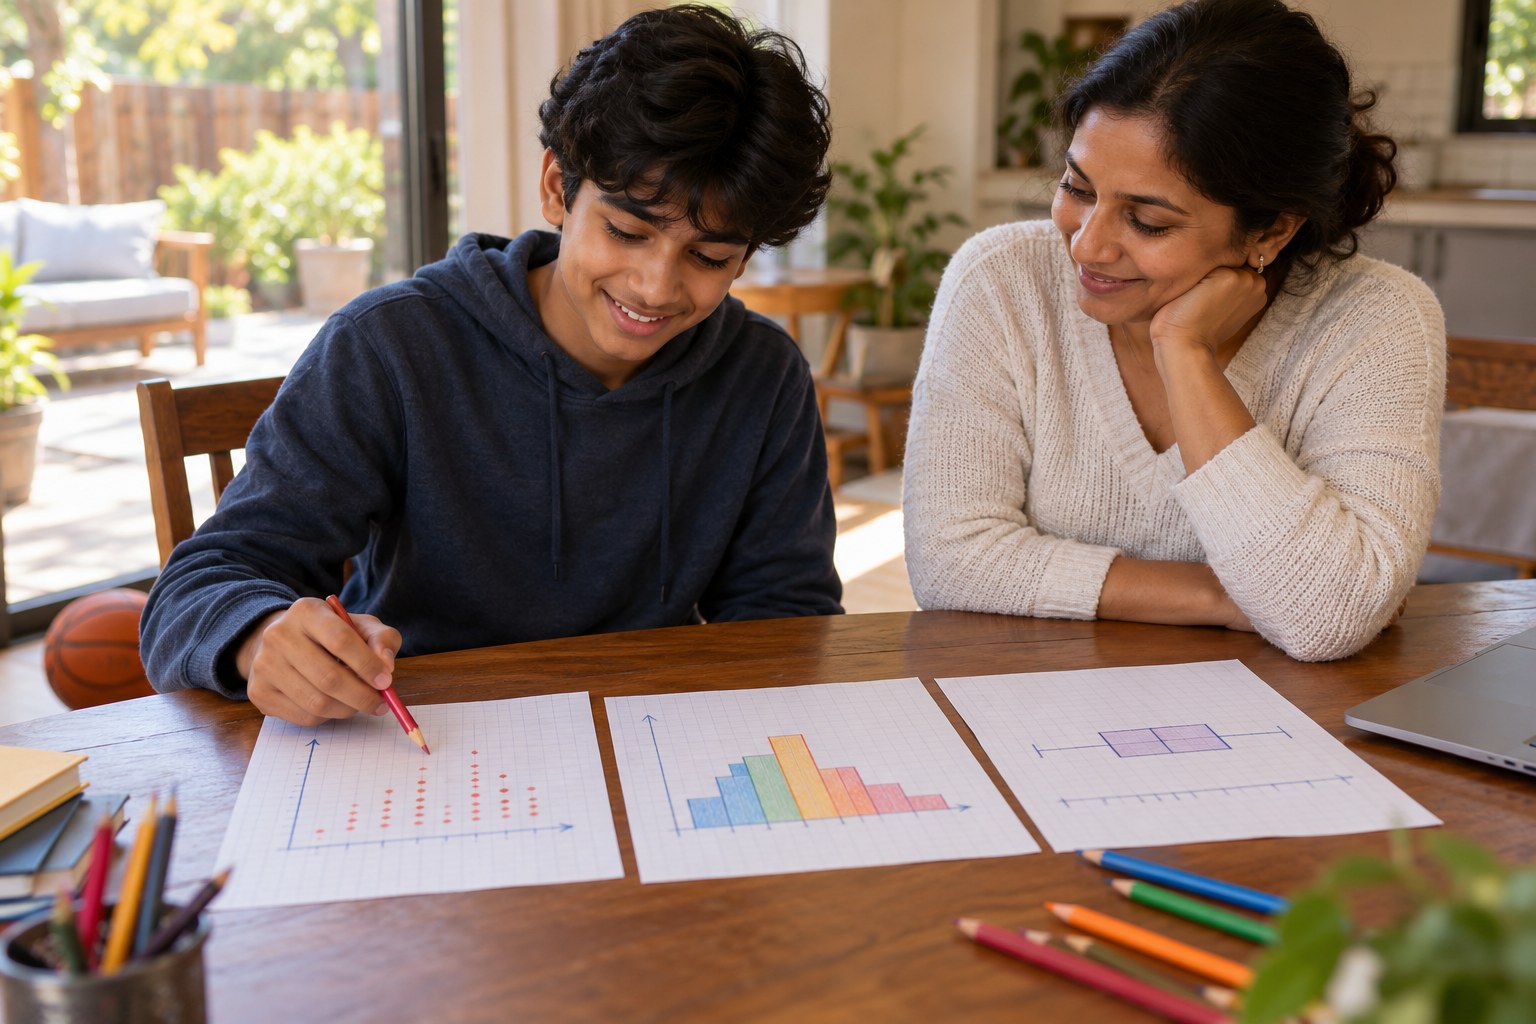
One Season, Three Pictures: Dot Plot, Histogram and Box Plot of a Scorer's Points
Draw one player's season as a dot plot, histogram and box plot.
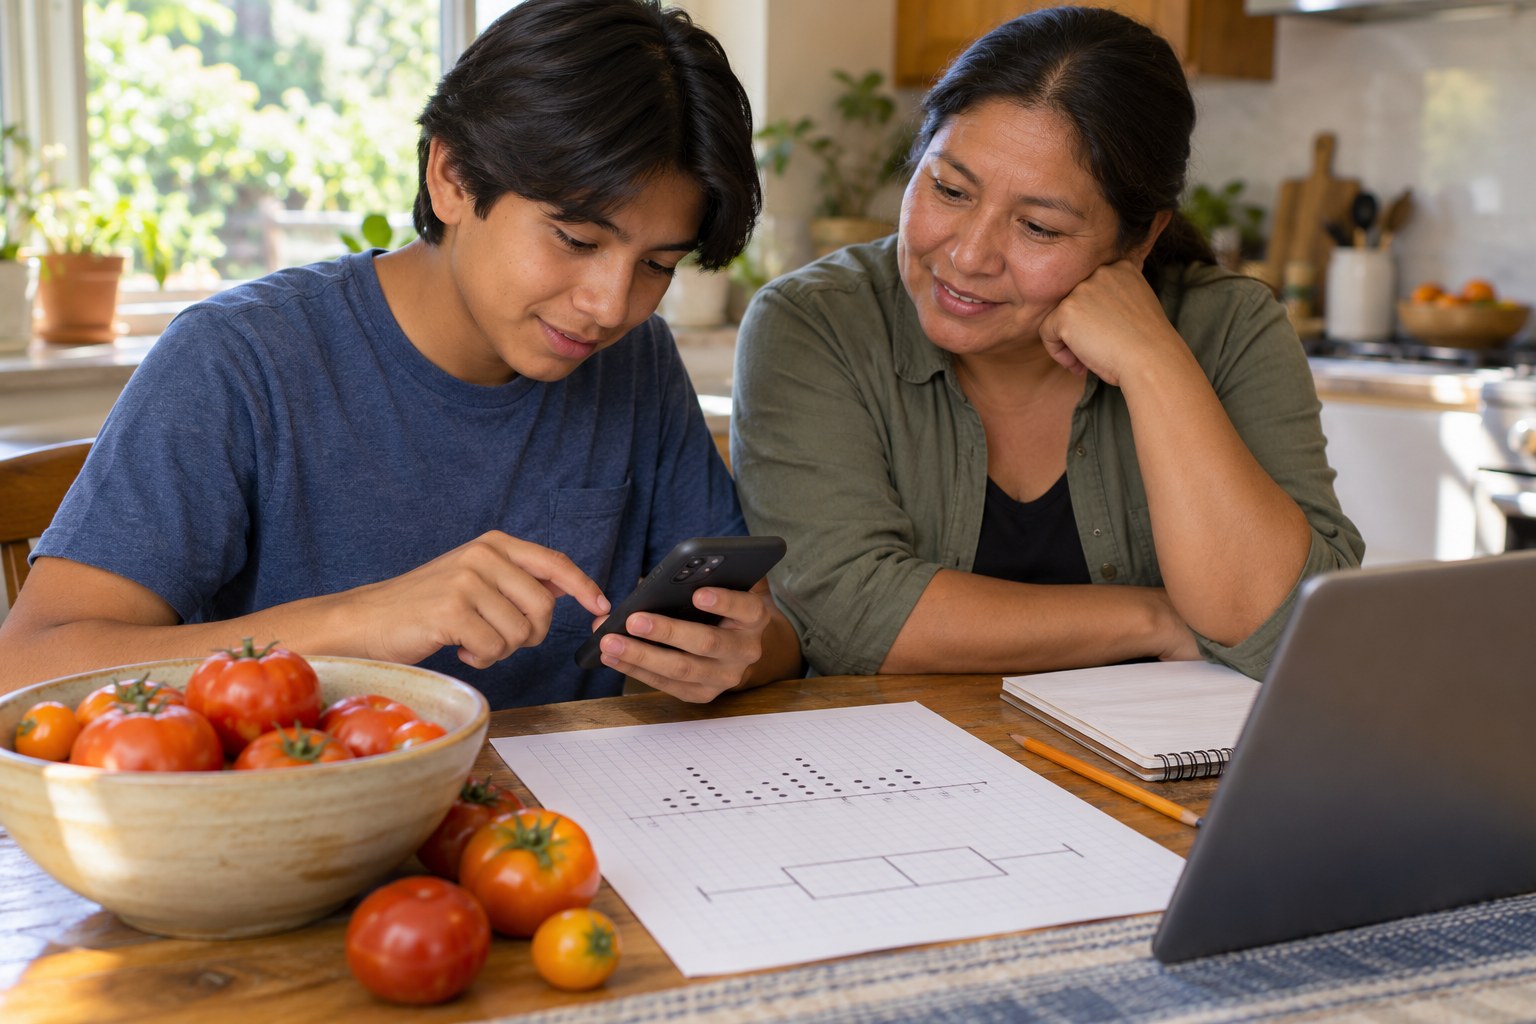
Tomato Yields on Trial: Plotting Harvest Data and Spotting Fake Causes
Plot a tomato harvest and catch claims that confuse correlation with cause.

Plot the Sleep: Dot Plots, Box Plots and the Correlation Trap
Graph sleep data three ways and catch headlines that confuse correlation with cause.

Full-Out Run-Throughs: Building Stamina With Heart-Rate Checks
Dance it four times, check your pulse, and plot what your heart did.
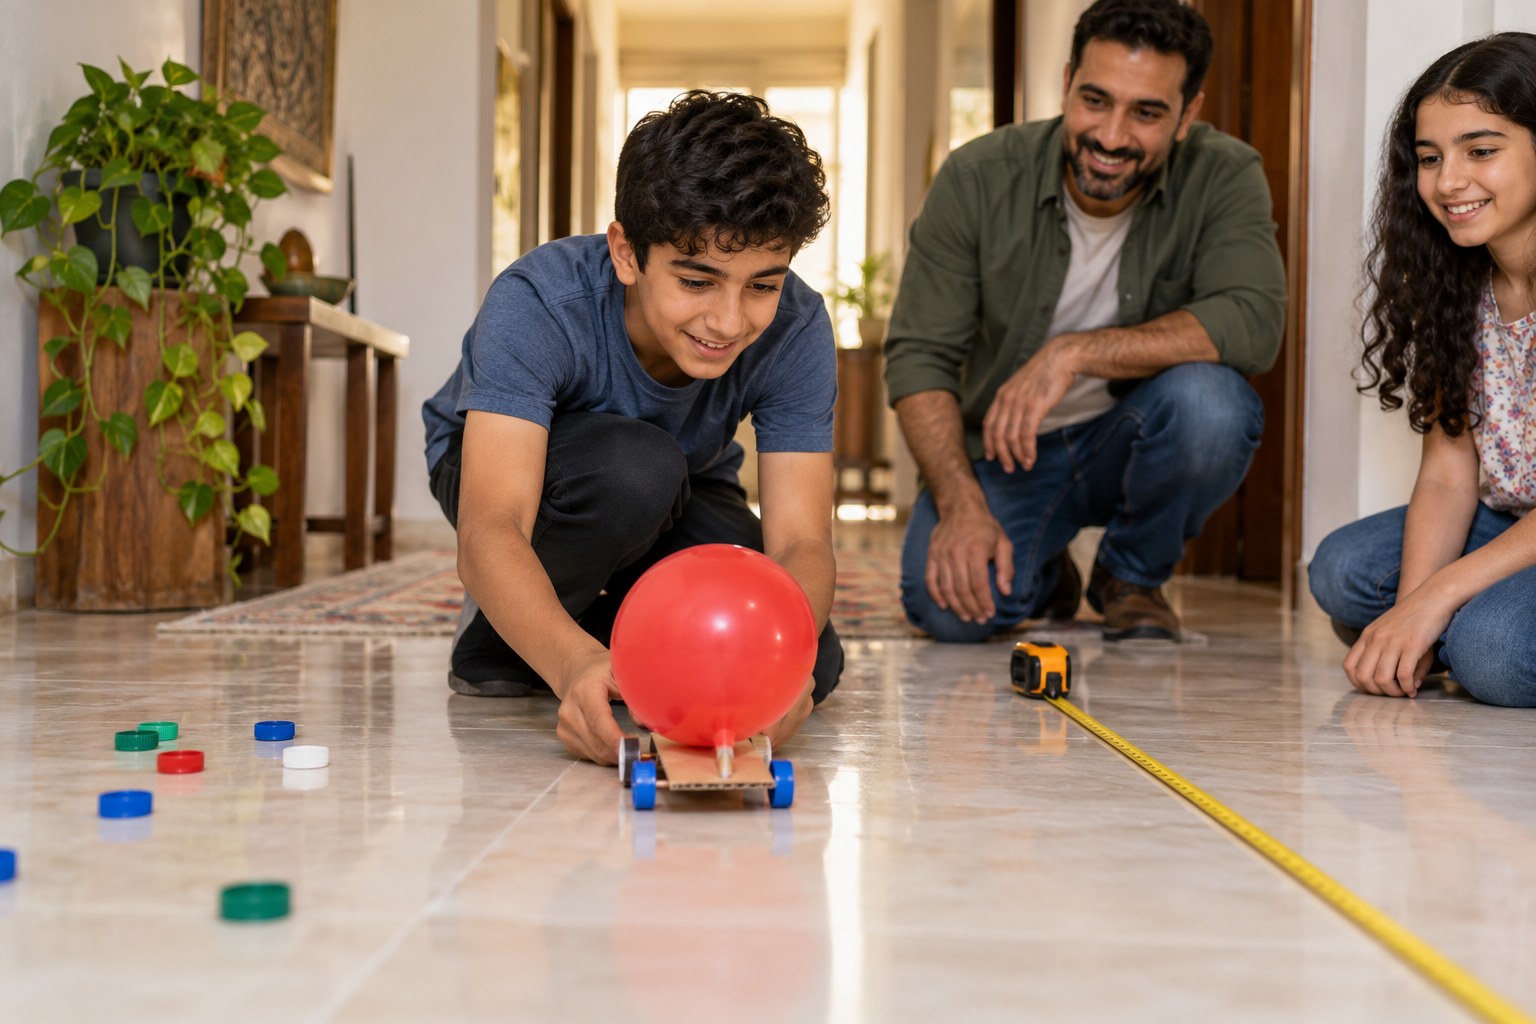
Balloon-Powered Racer: Design, Race and Redesign
Build, race and redesign a balloon car, then plot the results.
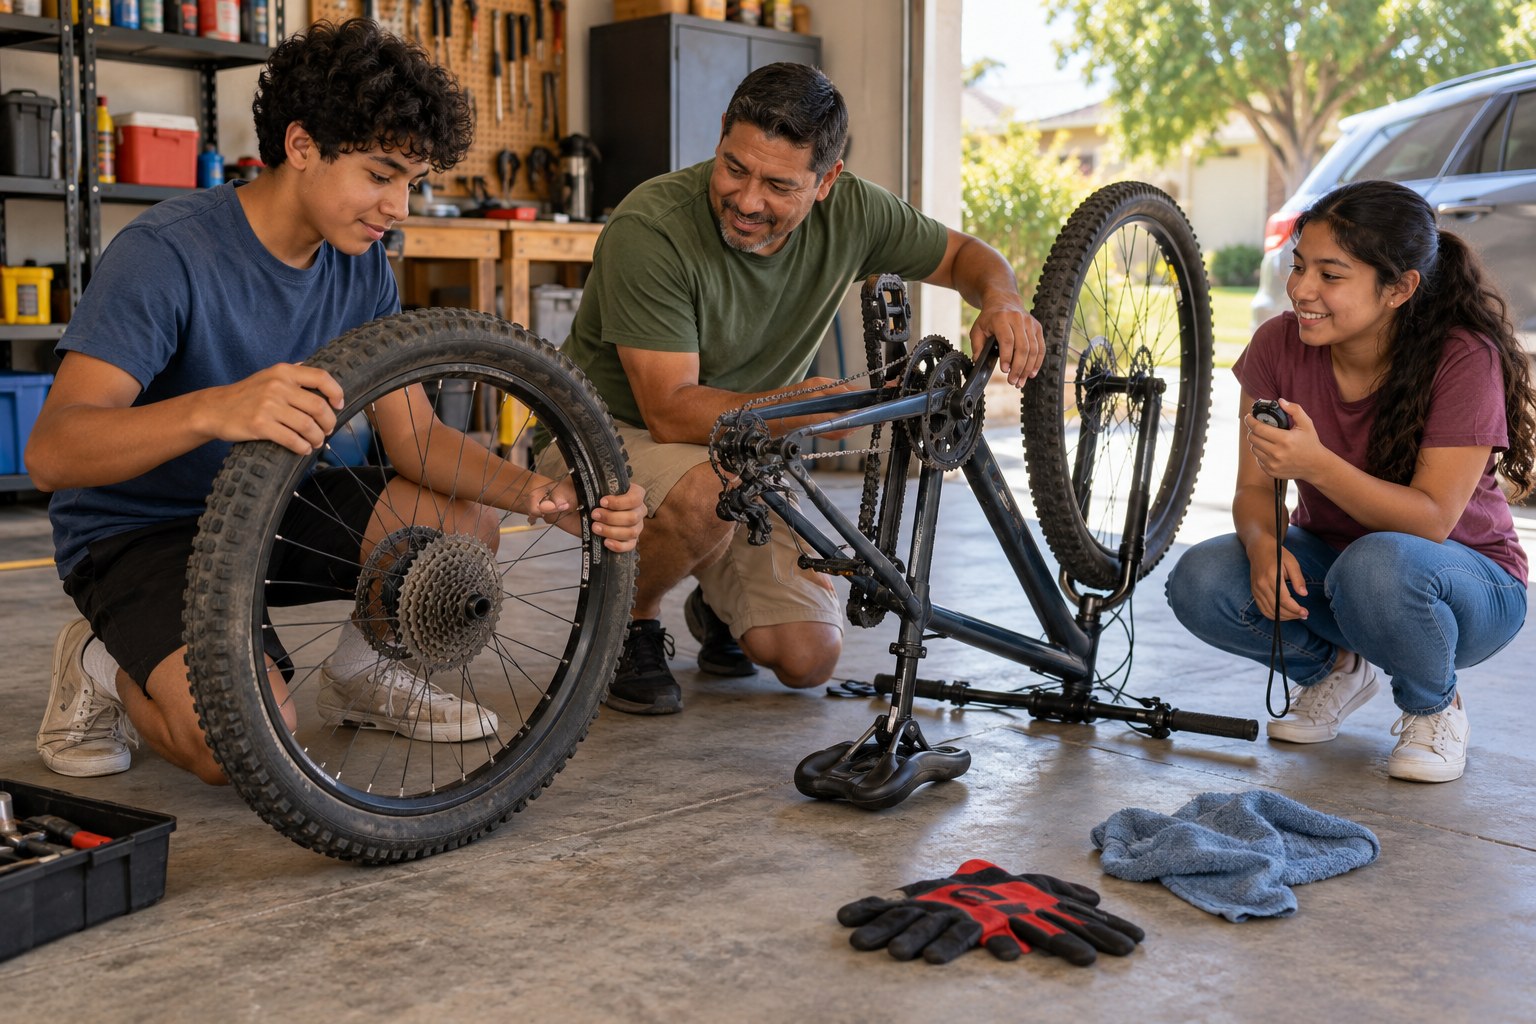
Pit Crew Precision: Timing a Family Wheel-Swap Relay
Turn a bike wheel swap into a timed pit-crew drill.
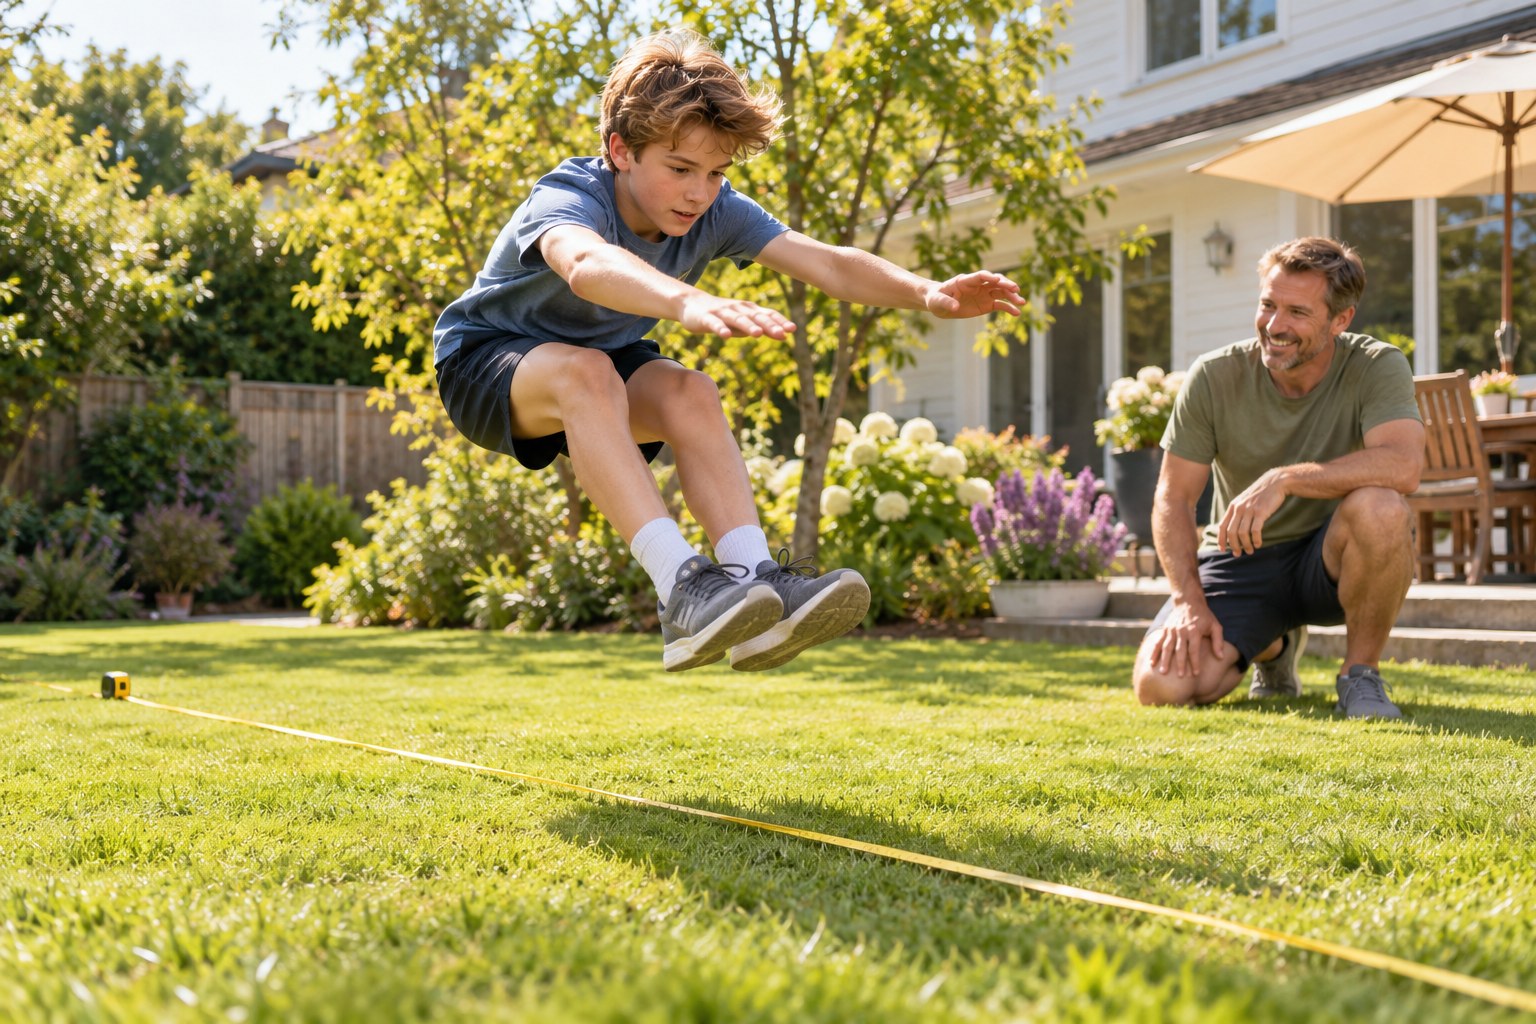
Standing Long Jump: Technique and Measurement
Jump, measure and plot your way to a better standing long jump.
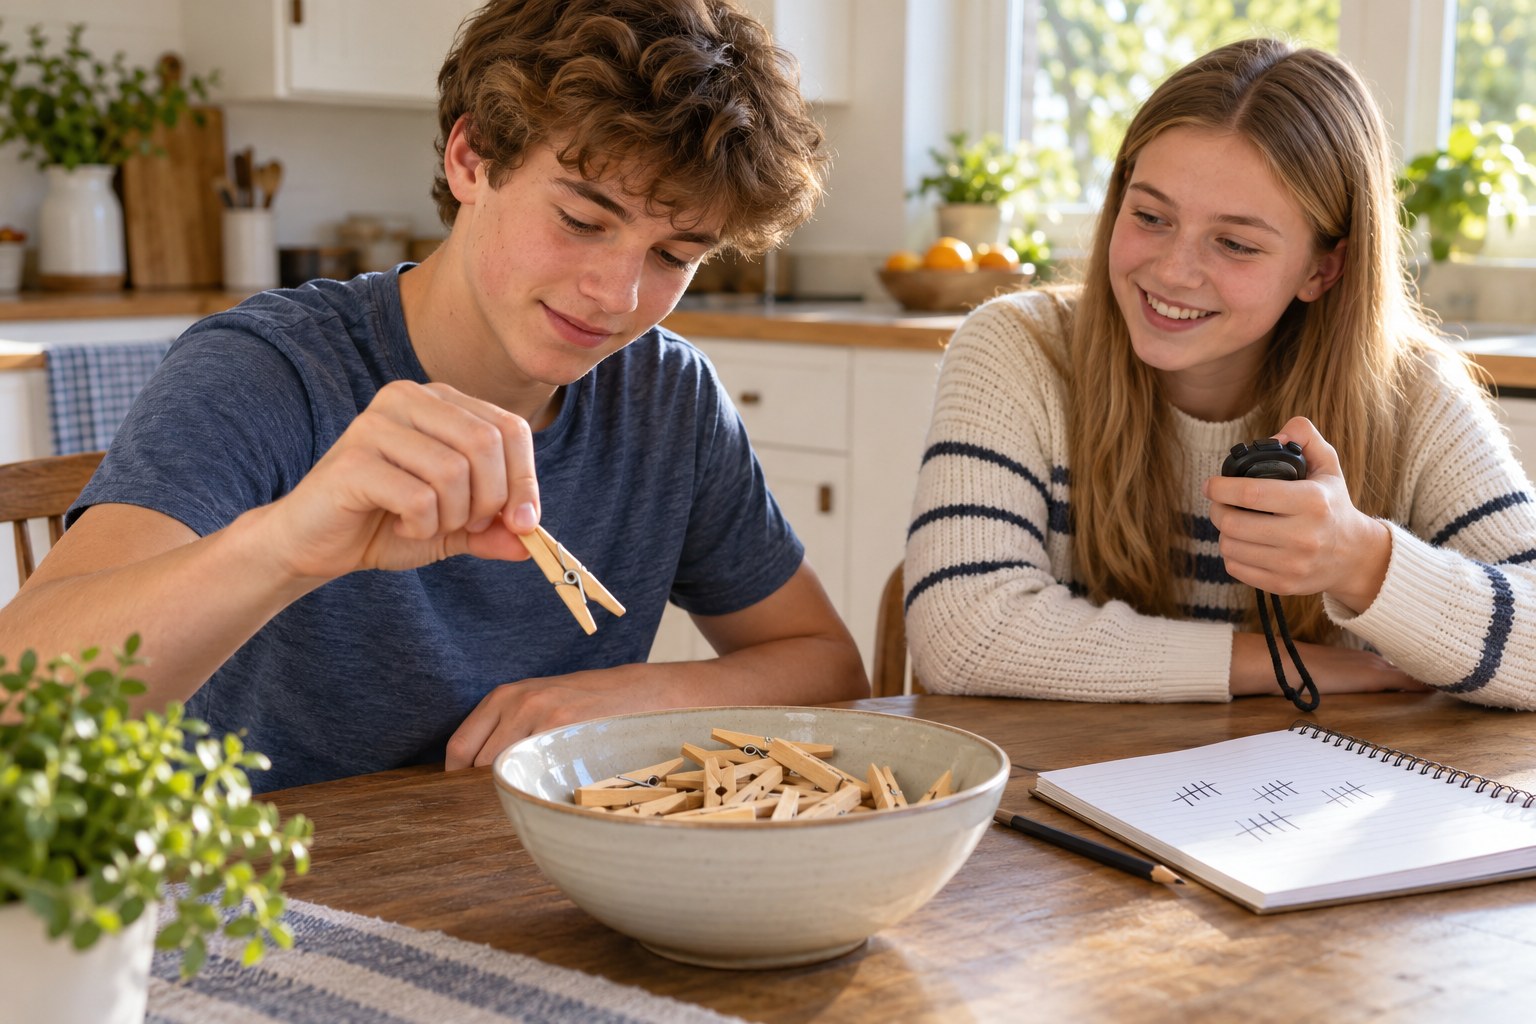
Muscle Fatigue Lab: How Long Until Your Hand Tires?
Squeeze a clothespin until your hand gives out, then graph it.
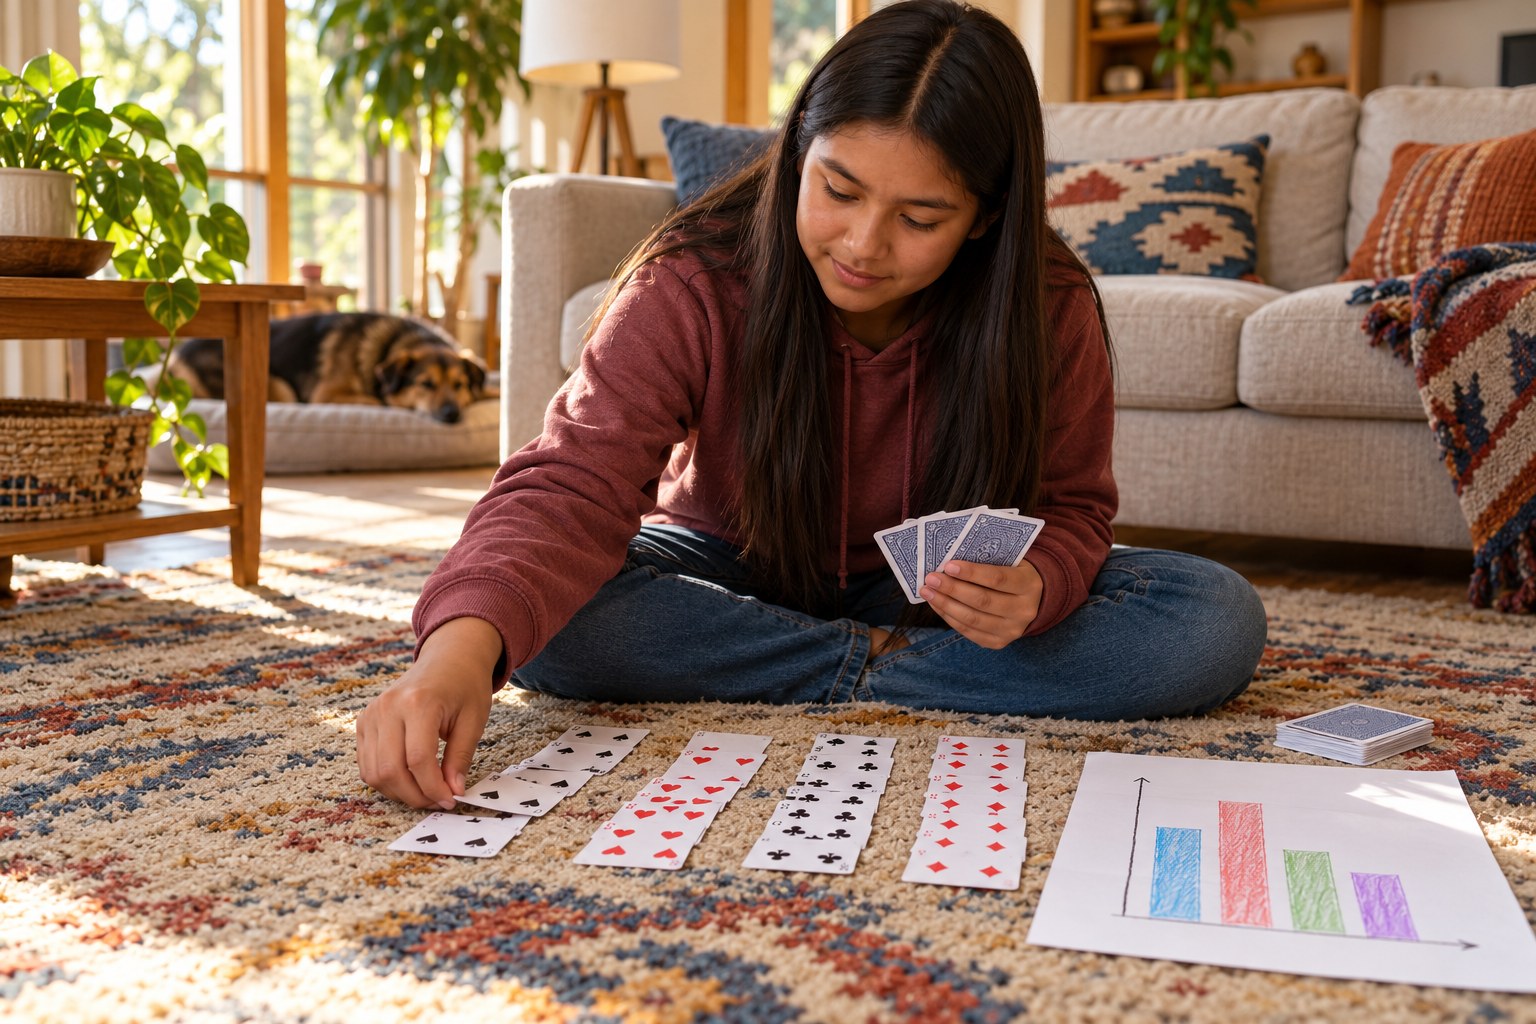
Build a Balanced Deck: Ratios and Bar Graphs for Card Games
Graph a deck's cost curve and rebalance it with data.

Power Nap Science: Testing a 20-Minute Afternoon Rest
Test whether a 20-minute nap actually helps your memory.
Related standards with lesson plans: S-ID.1.
See all high school Common Core standards
Make a lesson like this in a minute
Pick a topic, grade, group size and length. Resource Portal AI writes the objectives, materials, steps and pictures.
Sign up FREEFree forever · no credit card needed. Members get all 5,100+ lessons for $14.99/month, with the first 7 days free.