Lesson plan

Candy Pumpkin Catapult: Scatter Plot Launch Lab
STEAM50 minutesGrades: 7th, 8th
Candy Pumpkin Catapult: Scatter Plot Launch Lab

Overview

Build a catapult and graph pull-back against launch distance.

Description

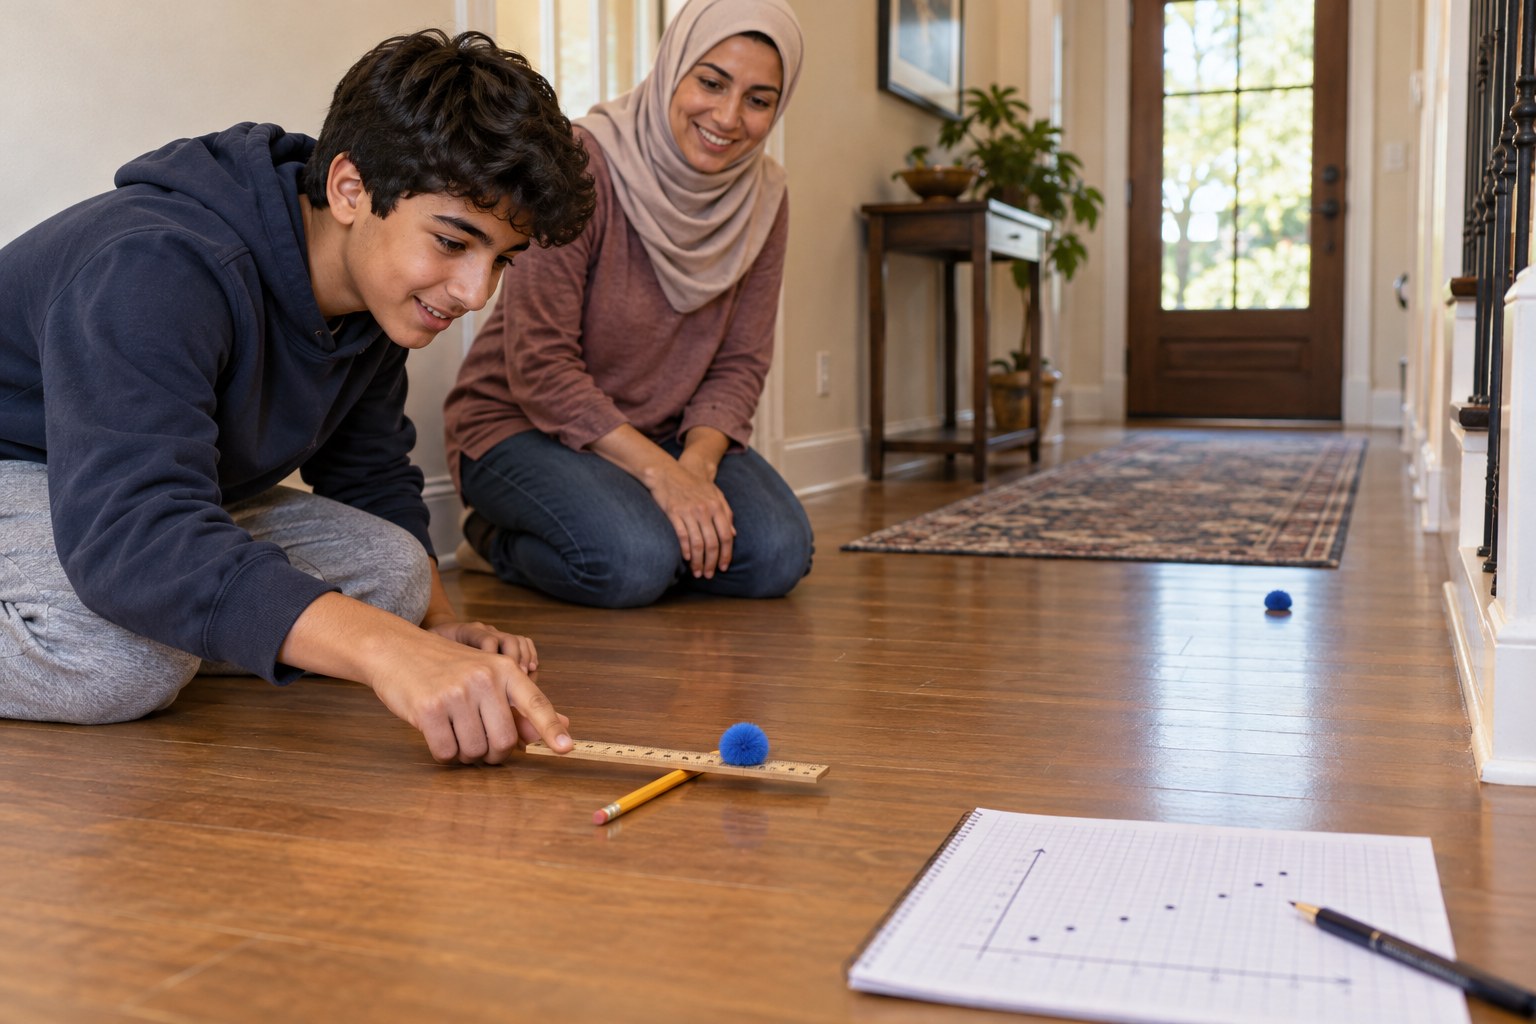
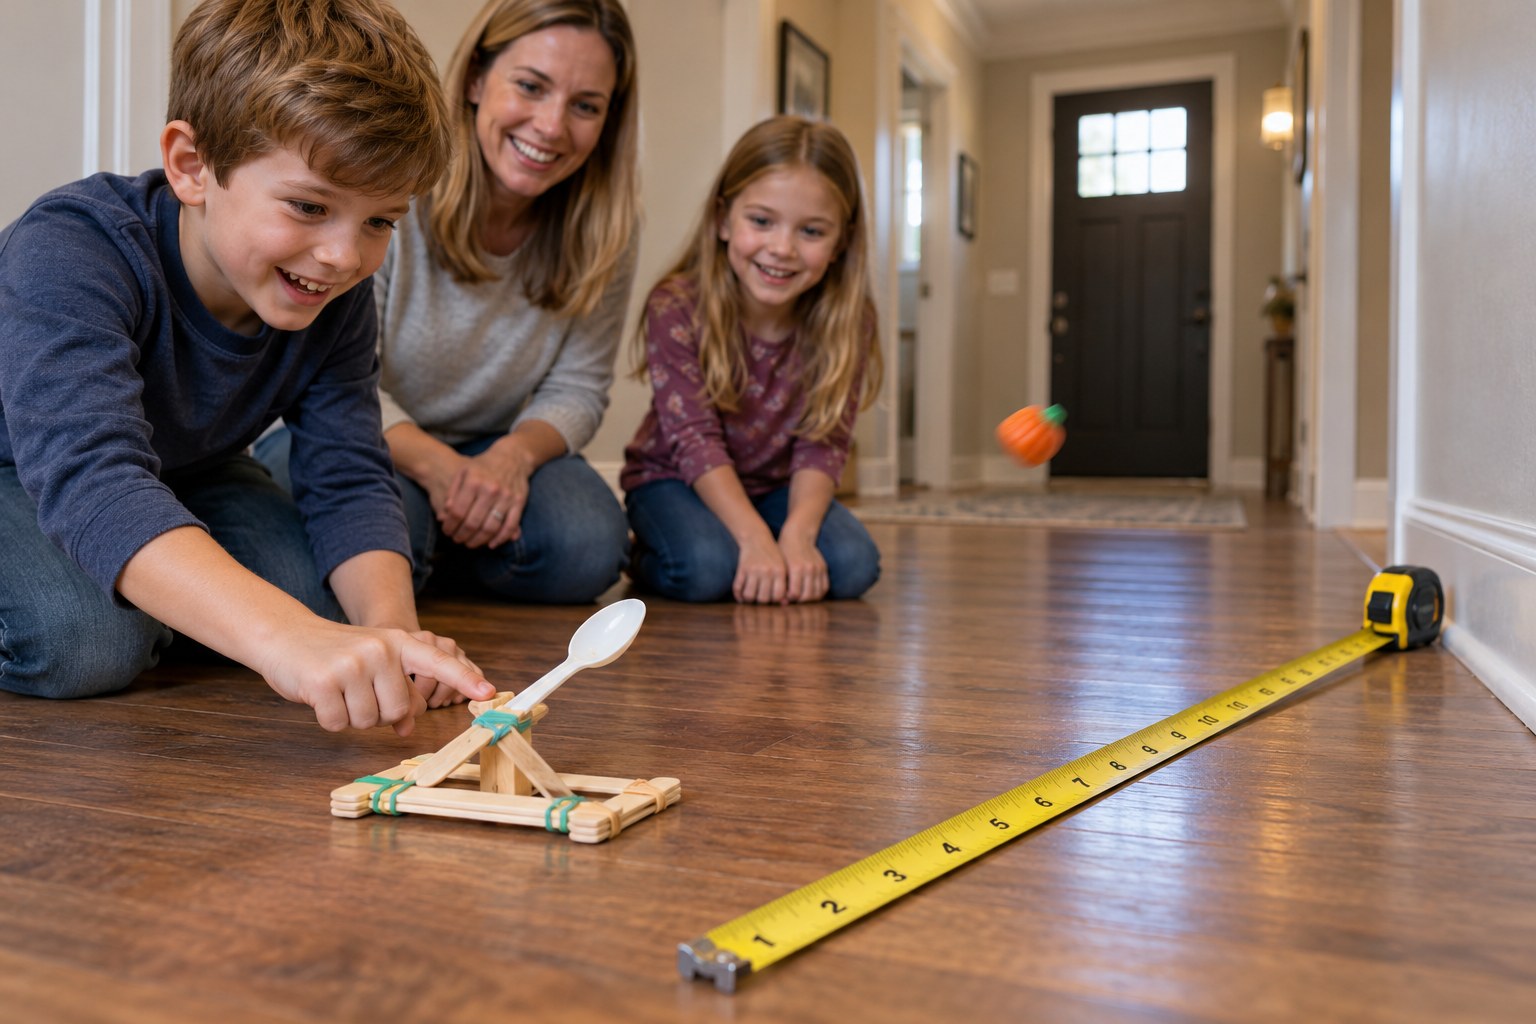
Your teen builds a craft-stick catapult, launches candy pumpkins or pom-poms at different pull-back distances, records the launch distances, and makes a scatter plot with a line of fit to describe the relationship.

Objective

Your teen will build a working lever catapult, run a controlled test, construct a scatter plot of bivariate data, draw an informal line of fit and describe the association.

Standards

8.SP.1Math · Grade 8 · Statistics & Probability
Construct and interpret scatter plots for bivariate measurement data to investigate patterns of association between two quantities. Describe patterns such as clustering, outliers, positive or negative association, linear association, and nonlinear association.
8.SP.2Math · Grade 8 · Statistics & Probability
Know that straight lines are widely used to model relationships between two quantitative variables. For scatter plots that suggest a linear association, informally fit a straight line, and informally assess the model fit by judging the closeness of the data points to the line.

Materials

ItemQuantity
Jumbo craft sticks9
Rubber bands6
Plastic spoon or bottle cap1
Hot glue (adult) or strong tape1
Candy pumpkins, pom-poms or mini marshmallows (projectiles)10
Tape measure or yardstick1
Ruler1
Graph paper and pencil2 sheets

Vocabulary

Lever
A bar that pivots on a point (the fulcrum) to move a load.
Fulcrum
The pivot point of a lever.
Independent variable
The thing you change on purpose in an experiment.
Scatter plot
A graph of paired data points showing how two variables relate.
Line of fit
A straight line drawn close to most points to show the trend.

Preparation

Introduction

Launch one pom-pom from a spoon by hand and ask: 'How could we make it go farther every time, and prove it with data instead of luck?'
What makes a catapult store energy?
What should stay the same in every launch so the test is fair?

Steps

1Step 1
Build the catapult
(12 min) Your teen stacks 7 craft sticks and wraps rubber bands tightly around both ends to make the fulcrum. They band 2 sticks together at one end only, slide the stack between them, and attach the spoon or bottle cap to the top stick with glue (adult) or tape.
2Step 2
Plan a fair test
(6 min) Your teen chooses 5 pull-back distances, such as 1, 2, 3, 4 and 5 centimeters, measured with a ruler at the spoon. They list what stays the same: projectile, launch spot, catapult position and the person launching.
3Step 3
Launch and record
(15 min) For each pull-back distance, your teen launches 3 times and measures how far the projectile lands from the launch line. They record all 15 results in a table and calculate the average distance for each pull-back.
4Step 4
Make the scatter plot
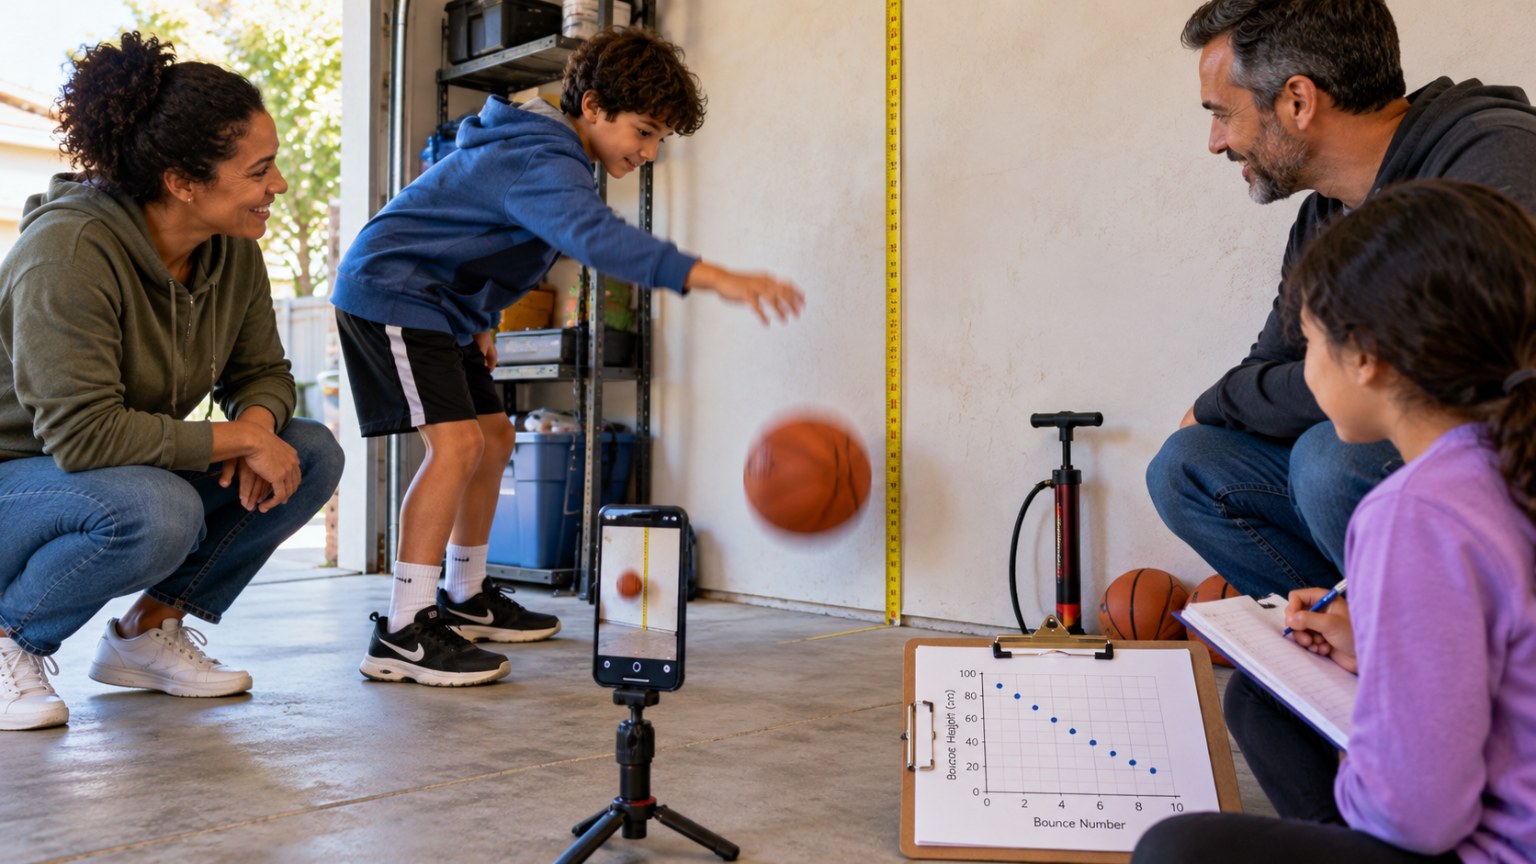
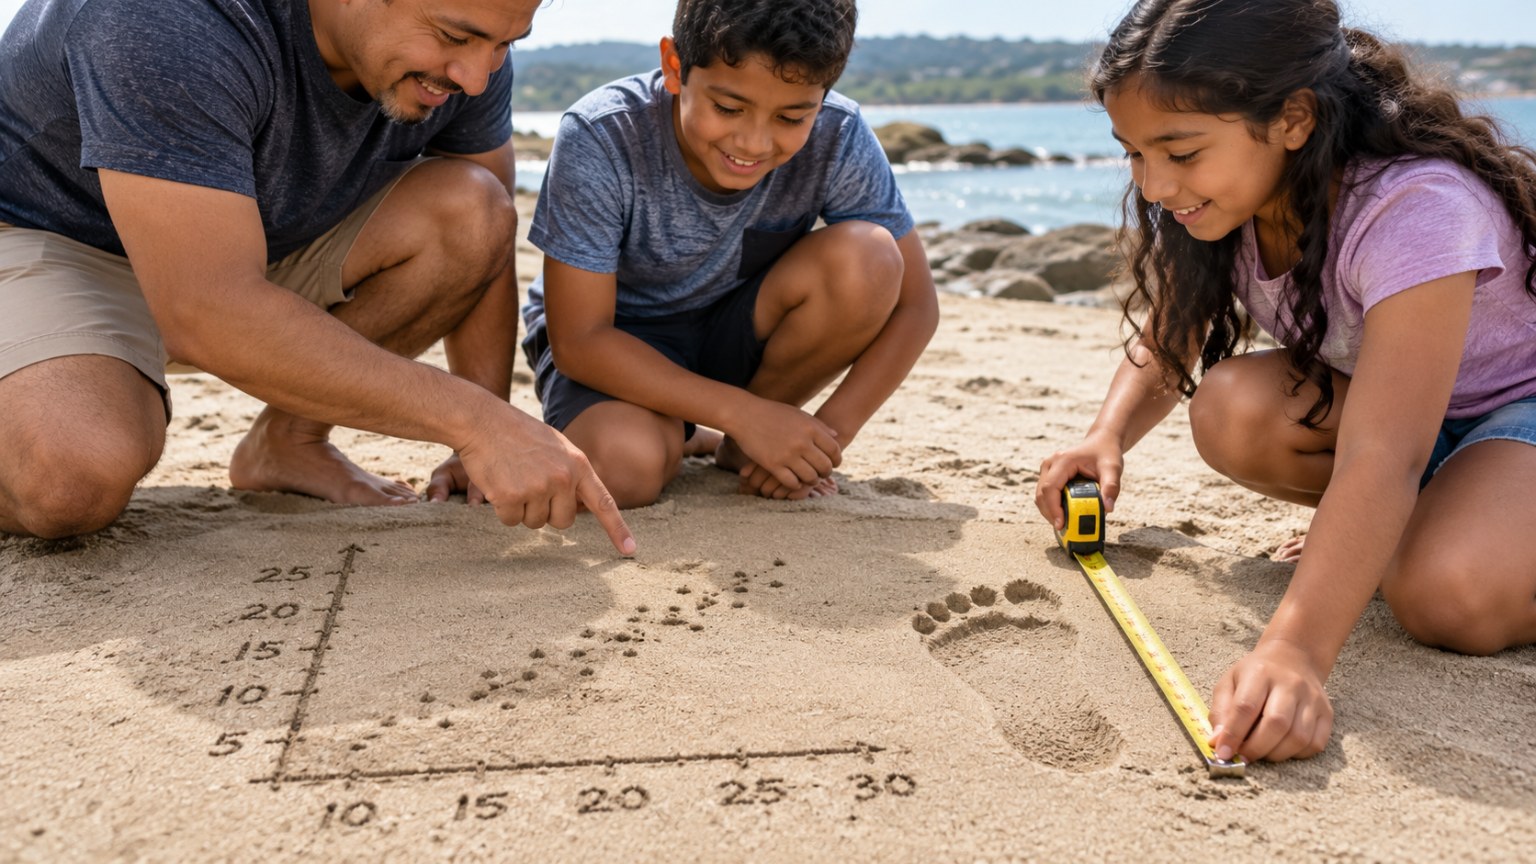
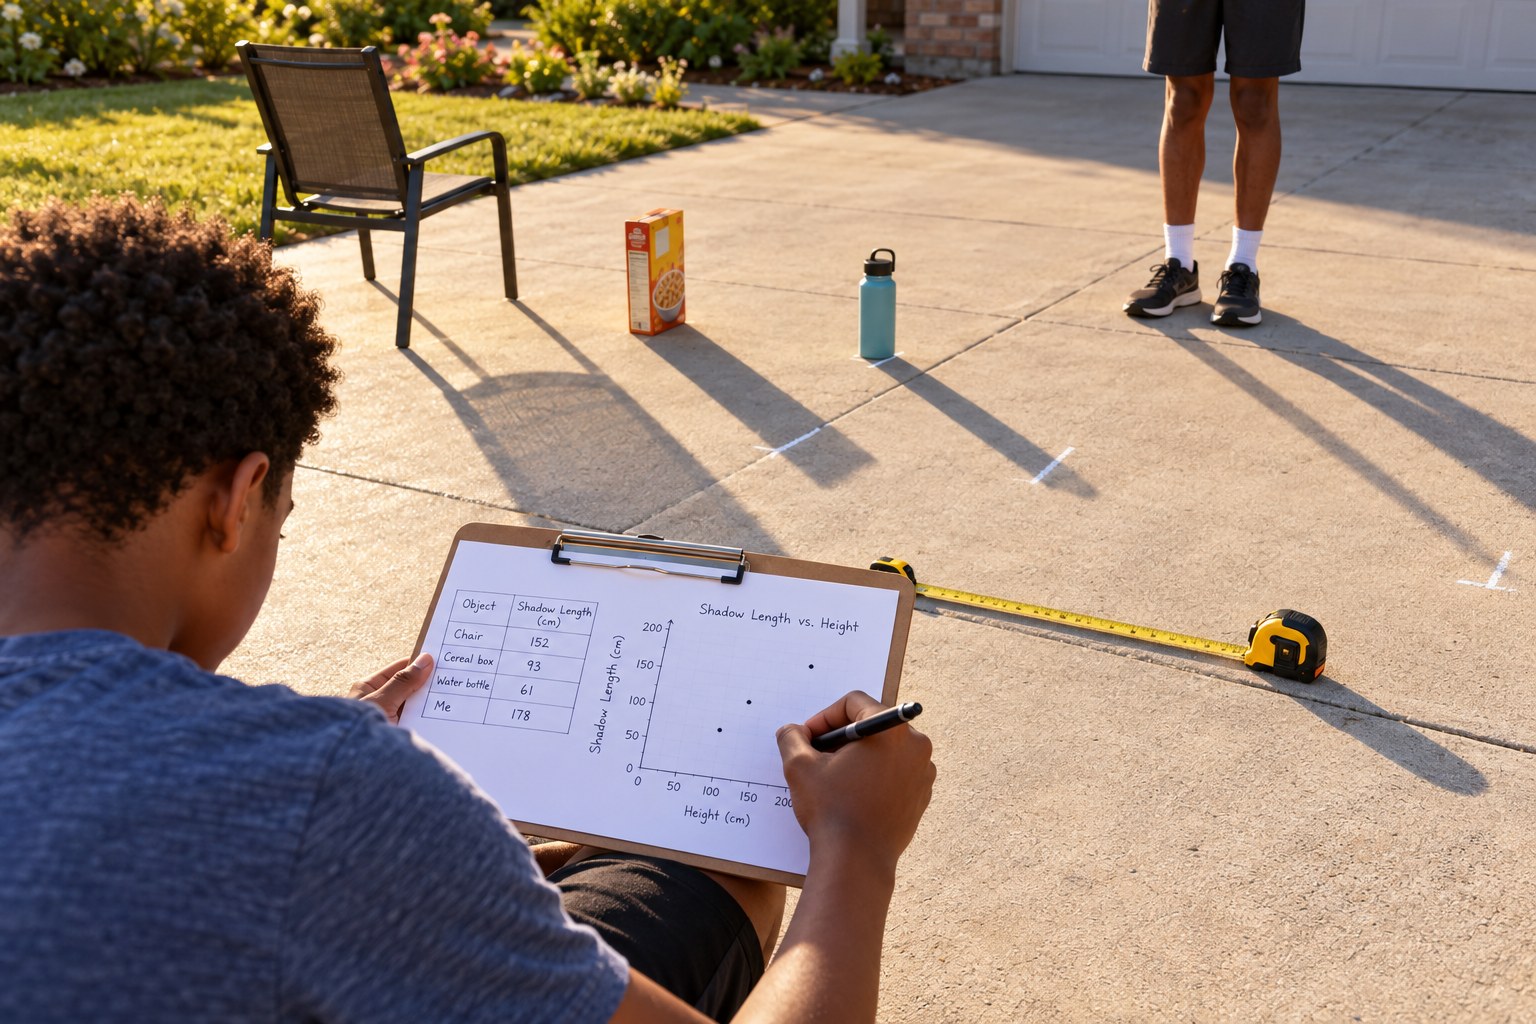
(10 min) Your teen plots pull-back distance on the x-axis and launch distance on the y-axis, using all trials as points. They draw a straight line of fit that passes close to most points and describe the association as positive, negative or none, and as linear or not.
5Step 5
Predict and test
(6 min) Your teen uses the line of fit to predict the distance for a new pull-back, such as 3.5 cm, then launches to test it. They explain how close the prediction was and why points do not fall exactly on the line.

Conclusion

Ask: what does the slope of your line mean in real words? Engineers use scatter plots and lines of fit to predict how designs will perform before building the real thing.

Make your own lesson plan in minutes

Describe a topic and Resource Portal AI writes the objectives, materials and steps for your group.

Try Resource Portal AI