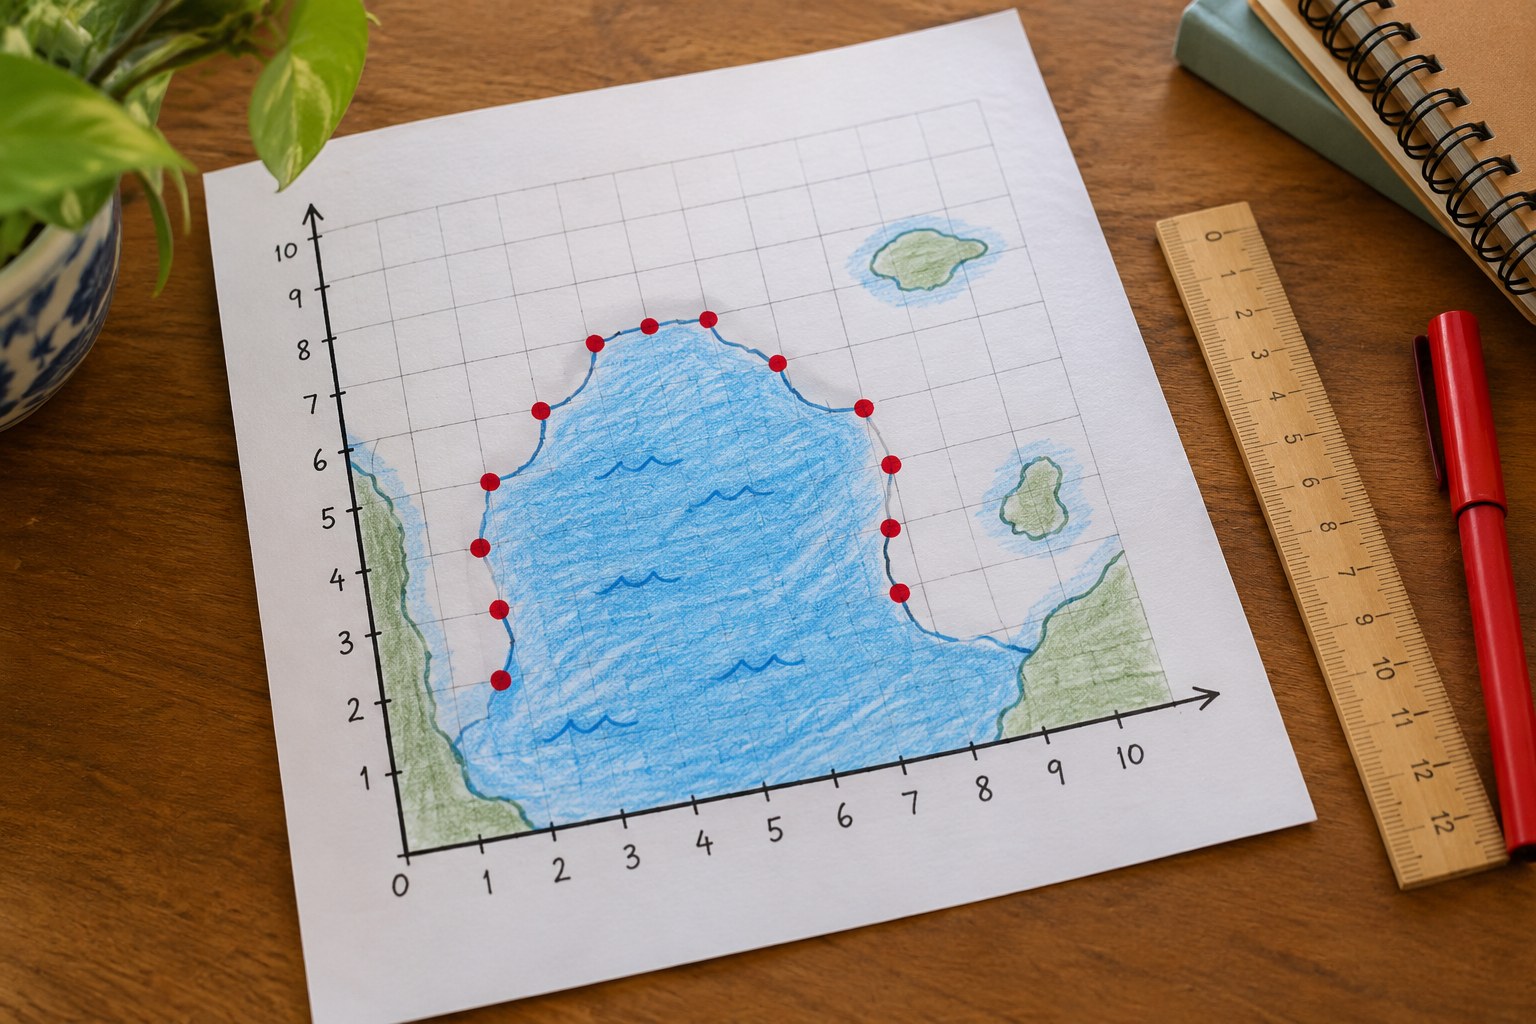
Lesson plan

Hurricane Tracker: Plot a Storm's Path on a Coordinate Grid
Math40 minutesGrades: 5th
Hurricane Tracker: Plot a Storm's Path on a Coordinate Grid

Overview

Plot a pretend hurricane's path with ordered pairs.

Description

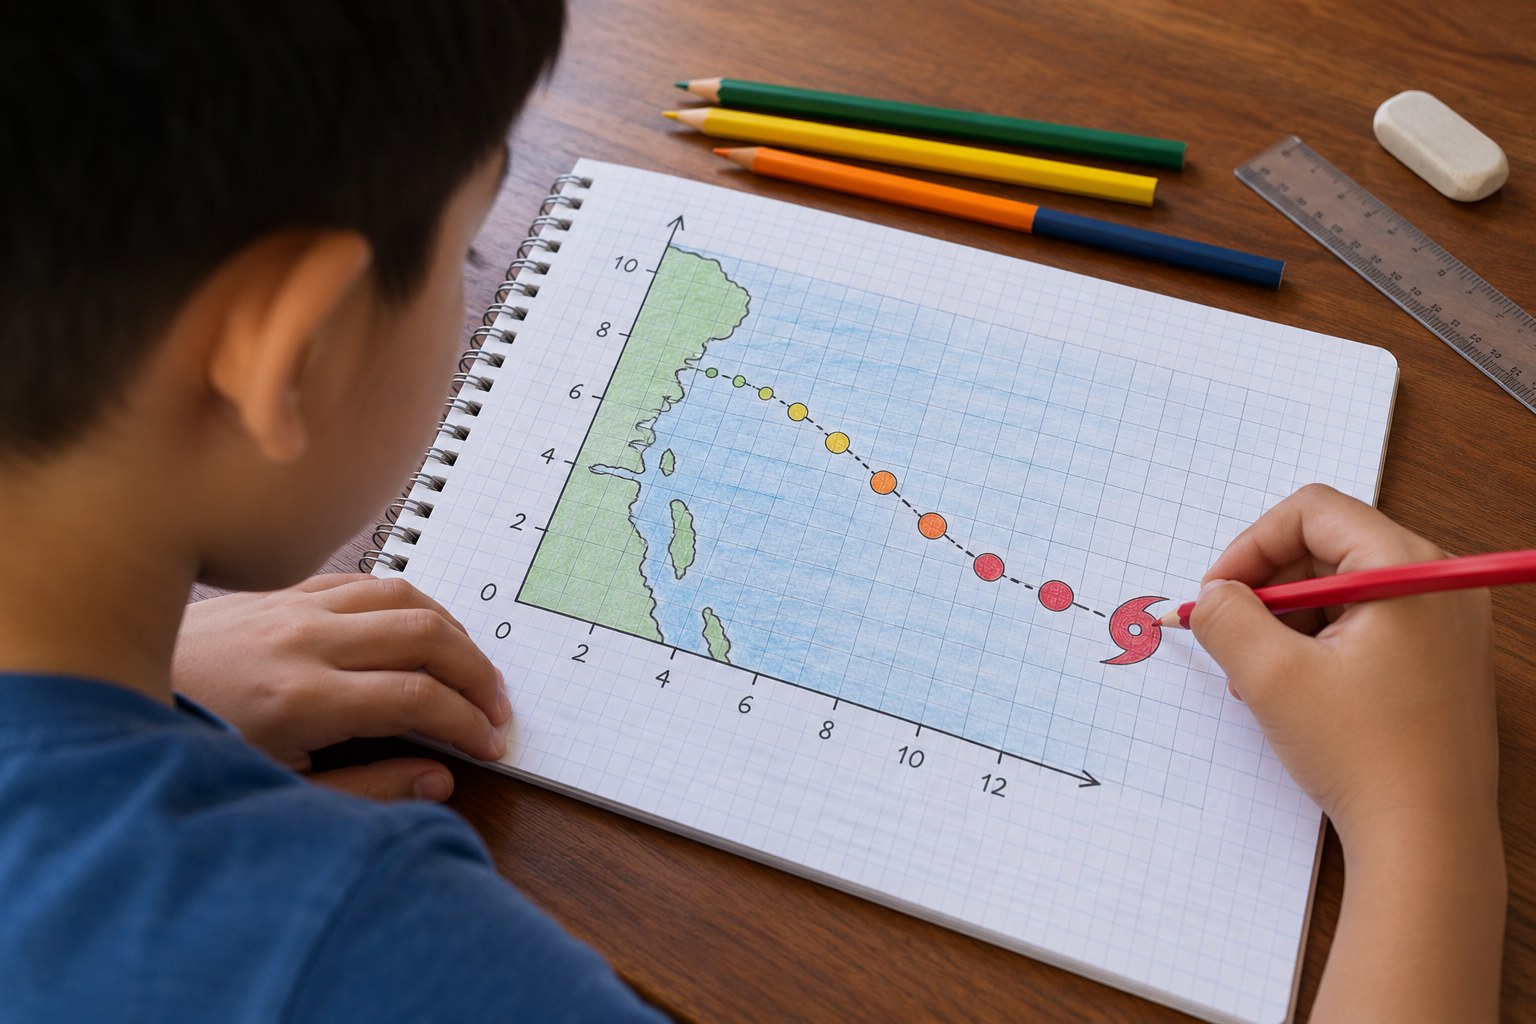
Your child plays hurricane forecaster, plotting a made-up storm's position every 6 hours as ordered pairs on a coordinate grid, connecting the path, finding landfall and labeling each point with its Saffir-Simpson category.

Objective

Your child will plot and interpret ordered pairs in the first quadrant to track a storm's movement, describe the path in terms of x and y distances, and classify wind speeds by hurricane category.

Standards

5.G.1Math · Grade 5 · Geometry
Use a pair of perpendicular number lines, called axes, to define a coordinate system, with the intersection of the lines (the origin) arranged to coincide with the 0 on each line and a given point in the plane located by using an ordered pair of numbers, called its coordinates. Understand that the first number indicates how far to travel from the origin in the direction of one axis, and the second number indicates how far to travel in the direction of the second axis, with the convention that the names of the two axes and the coordinates correspond (e.g., x-axis and x-coordinate, y-axis and y-coordinate).
5.G.2Math · Grade 5 · Geometry
Represent real world and mathematical problems by graphing points in the first quadrant of the coordinate plane, and interpret coordinate values of points in the context of the situation.

Materials

ItemQuantity
Graph paper2 sheets per child
Ruler and pencil1 each
Colored pencils (red, orange, yellow, blue)1 set
Storm data table (in the section below)1 copy
Optional: a real hurricane tracking map printed from the National Hurricane Center website1

Vocabulary

Ordered pair
Two numbers (x, y) that give a point's location: first across, then up.
Origin
The point (0, 0) where the x-axis and y-axis meet.
Landfall
When the center (eye) of a hurricane crosses the coastline onto land.
Saffir-Simpson scale
The 1-to-5 category scale for hurricanes based on sustained wind speed.

Preparation

Introduction

Tell your child: you work at the hurricane center, and a storm called Hurricane Pip (a made-up storm) is spinning in the ocean. Every 6 hours a plane and satellite send you its location. Your job is to track it and warn the coast.
How do you think forecasters know where a hurricane is in the middle of the ocean?
Why would people on the coast want to know a storm's path days ahead?

Steps

1Step 1
Review the grid
(6 min) Practice: start at the origin, move across the x-axis first, then up the y-axis. Your child plots two practice points, (3, 2) and (2, 3), and explains why they are in different places.
2Step 2
Plot the storm
(10 min) Your child plots each position from the data table as a dot, labels it with the hour, and connects the dots in order with a red line to show the storm's track. Remind them to check each point by counting across first, then up.
3Step 3
Color by category
(8 min) Using the Saffir-Simpson table, your child finds each point's category from its wind speed and circles the dot in a color: yellow for Category 1, orange for 2, red for 3 or higher. Ask: when was the storm strongest?
4Step 4
Read the path
(10 min) Your child answers the answer-key questions: how far east and north the storm moved overall, during which 6 hours it moved farthest north, and where it made landfall. Encourage them to answer using the coordinates, for example: it moved 5 units west.
5Step 5
Forecast the next point
(5 min) Your child predicts the storm's next position after landfall, plots it with a dotted line and explains their reasoning. Talk about why real forecasters draw a cone of possible paths rather than one line.

Conclusion

Ask: what do the x-coordinate and y-coordinate each tell you about the storm? Look at a real hurricane tracking map during hurricane season and find the dots and the path.

Make your own lesson plan in minutes

Describe a topic and Resource Portal AI writes the objectives, materials and steps for your group.

Try Resource Portal AI