Lesson planAlbedo Lab: Why Melting Sea Ice Makes the Arctic Warm Faster
Science45 minutesGrades: 6th, 7th
Overview
Measure how surface color changes heat absorbed, like ice versus ocean.
Description
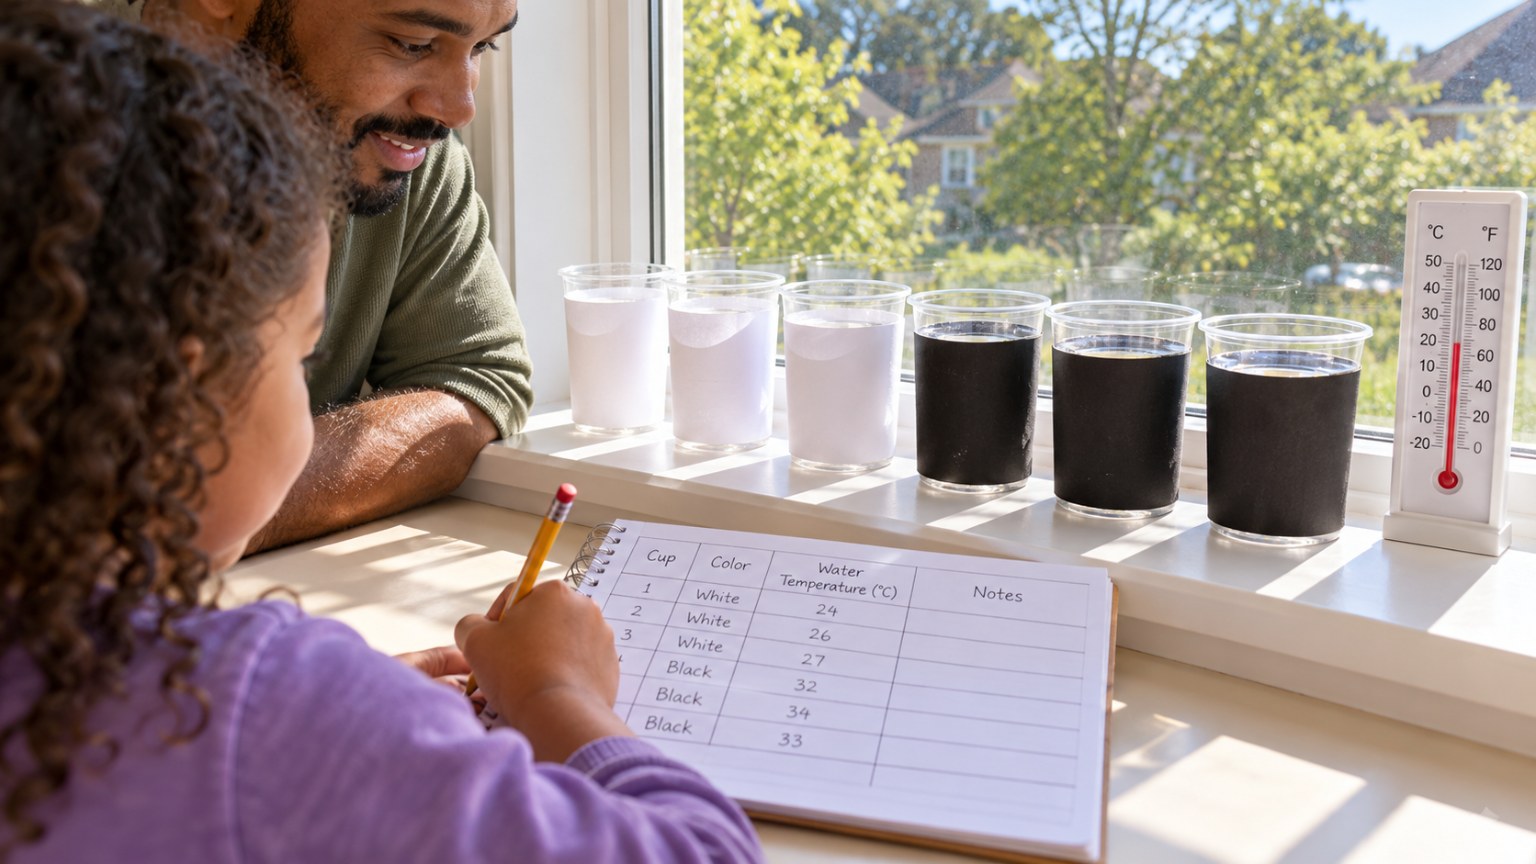
Your teen models bright sea ice and dark open ocean with white- and black-wrapped cups of water under sun or a lamp, runs three trials, calculates the mean temperature change and range for each, and writes a claim-evidence-reasoning paragraph about the ice-albedo feedback.
Objective
Your teen will collect temperature data from repeated trials, summarize it with mean and range, and write an argument supported by their evidence explaining why losing sea ice speeds up Arctic warming.
Standards
Support claim(s) with clear reasons and relevant evidence, using credible sources and demonstrating an understanding of the topic or text.
6.SP.5cMath · Grade 6 · Statistics & Probability Giving quantitative measures of center (median and/or mean) and variability (interquartile range and/or mean absolute deviation), as well as describing any overall pattern and any striking deviations from the overall pattern with reference to the context in which the data were gathered.
Materials
| Item | Quantity |
|---|
| Identical clear cups or jars | 6 |
| White paper and black paper (or dark fabric) | 3 sheets each |
| Tape | 1 roll |
| Room-temperature water and a measuring cup | about 6 cups |
| Kitchen or digital thermometer | 1-2 |
| Sunny windowsill or a desk lamp with an incandescent or halogen bulb | 1 |
| Timer, paper and pencil | 1 each |
Vocabulary
Albedo
How much sunlight a surface reflects, from 0 (reflects none) to 1 (reflects all).
Absorb
To take in energy, such as sunlight, which warms an object.
Feedback loop
A process where a change causes effects that make the original change bigger (or smaller).
Mean
The average: the sum of values divided by how many there are.
Range
The difference between the largest and smallest values.
Preparation
- Wrap 3 cups in white paper and 3 in black paper around the sides and bottom, leaving the tops open. Label W1-W3 and B1-B3.
- Fill each cup with exactly 1 cup of room-temperature water from the same pitcher so starting temperatures match.
- Choose a spot where all 6 cups get the same sun or lamp light, at the same distance (about 12 inches from a lamp). Make a data table: Cup, Start °F, End °F, Change.
Introduction
Ask your teen: on a sunny day, would you rather wear a black T-shirt or a white one? Why? Then tell them the Arctic is warming several times faster than the planet as a whole, and that the answer to the T-shirt question is part of the reason.
What happens to the color of the Arctic Ocean's surface when sea ice melts?
Why do scientists repeat an experiment more than once?
Steps
1Step 1
Learn the science
(6 min) Read the 'About albedo and Arctic sea ice' section. Your teen predicts which cups will warm more and writes a hypothesis using 'If... then... because...'.
2Step 2
Start the trials
(5 min) Your teen measures and records the starting temperature of each cup, then places all six in the sun or under the lamp at the same time. Note the time and keep everything else (water amount, distance, starting temperature) the same.
3Step 3
Wait and research
(20 min) While the cups sit for 20 minutes, your teen reads the 'Ice-albedo feedback' section and draws a flow diagram showing the loop: warmer air, sea ice melts, darker ocean exposed, more sunlight absorbed, more warming. At 20 minutes, they record each cup's ending temperature, stirring gently before reading.
4Step 4
Summarize the data
(7 min) Your teen calculates the temperature change for each cup, then the mean change and the range for the white cups and for the black cups. They compare: how much bigger was the mean change for the black cups, and did the ranges overlap?
5Step 5
Write the argument
(7 min) Your teen writes a claim-evidence-reasoning paragraph answering: 'Why does losing sea ice speed up Arctic warming?' The claim answers the question, the evidence uses their means and ranges, and the reasoning connects albedo to the ice and ocean. Read the paragraph aloud and check that every number matches the data table.
Conclusion
Ask: which cups modeled the open ocean? What was the difference in mean temperature change? How does this connect to polar bears losing hunting time on the ice?
Make your own lesson plan in minutes
Describe a topic and Resource Portal AI writes the objectives, materials and steps for your group.
Try Resource Portal AI