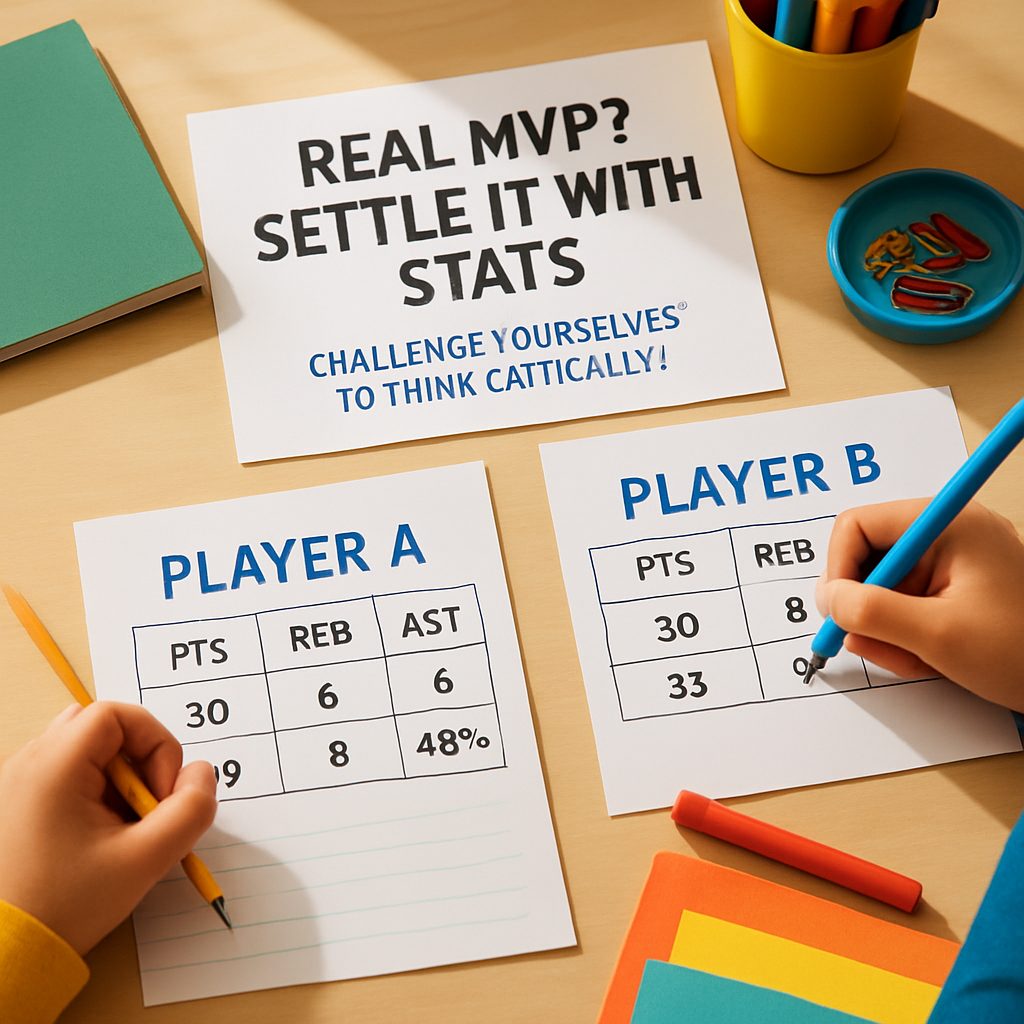
Real MVP? Settle It With Stats

Overview
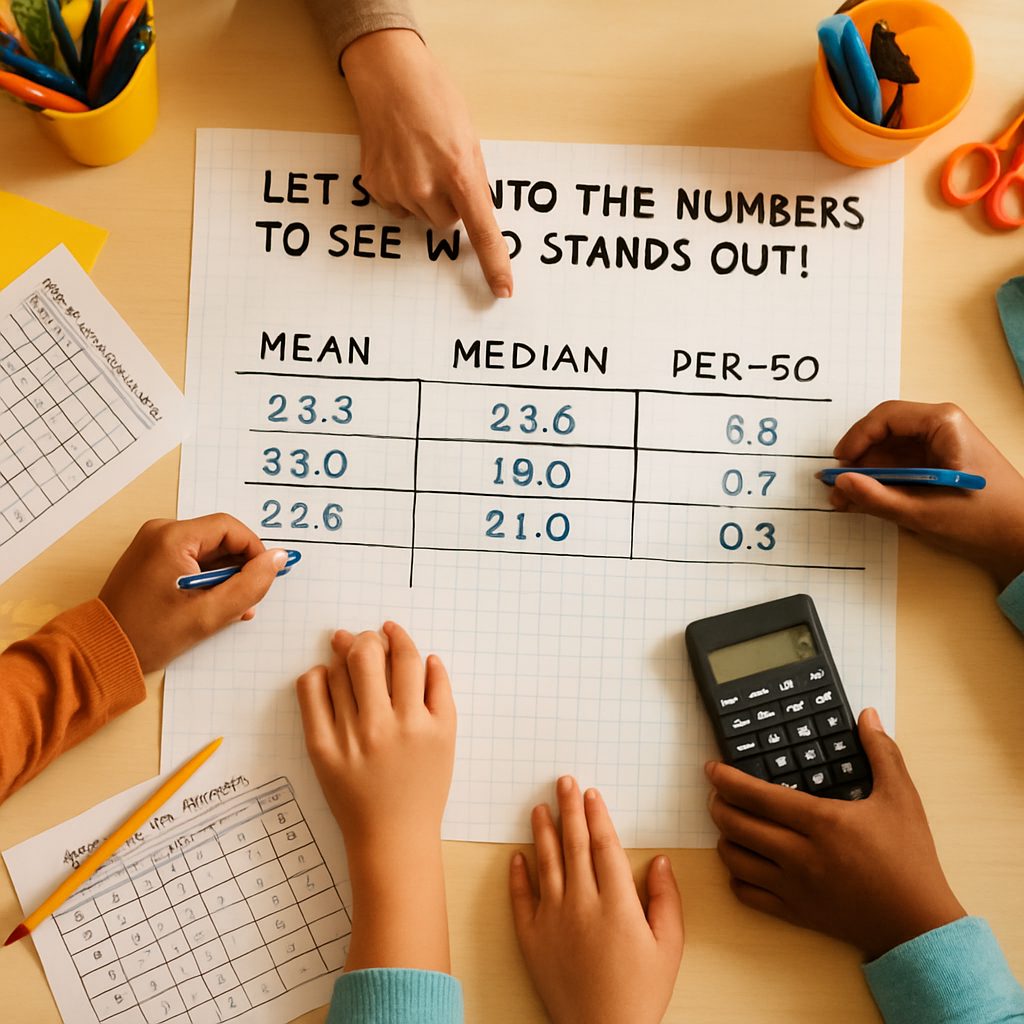
Students will analyze sports statistics to collaboratively determine the MVP using data-driven arguments.
Description
In this engaging lesson, students will utilize statistical analysis to collaboratively determine the 'Most Valuable Player' (MVP) from a set of sports data. The lesson encourages critical thinking and collaboration by analyzing performance data and drawing conclusions based on their findings.
Objective
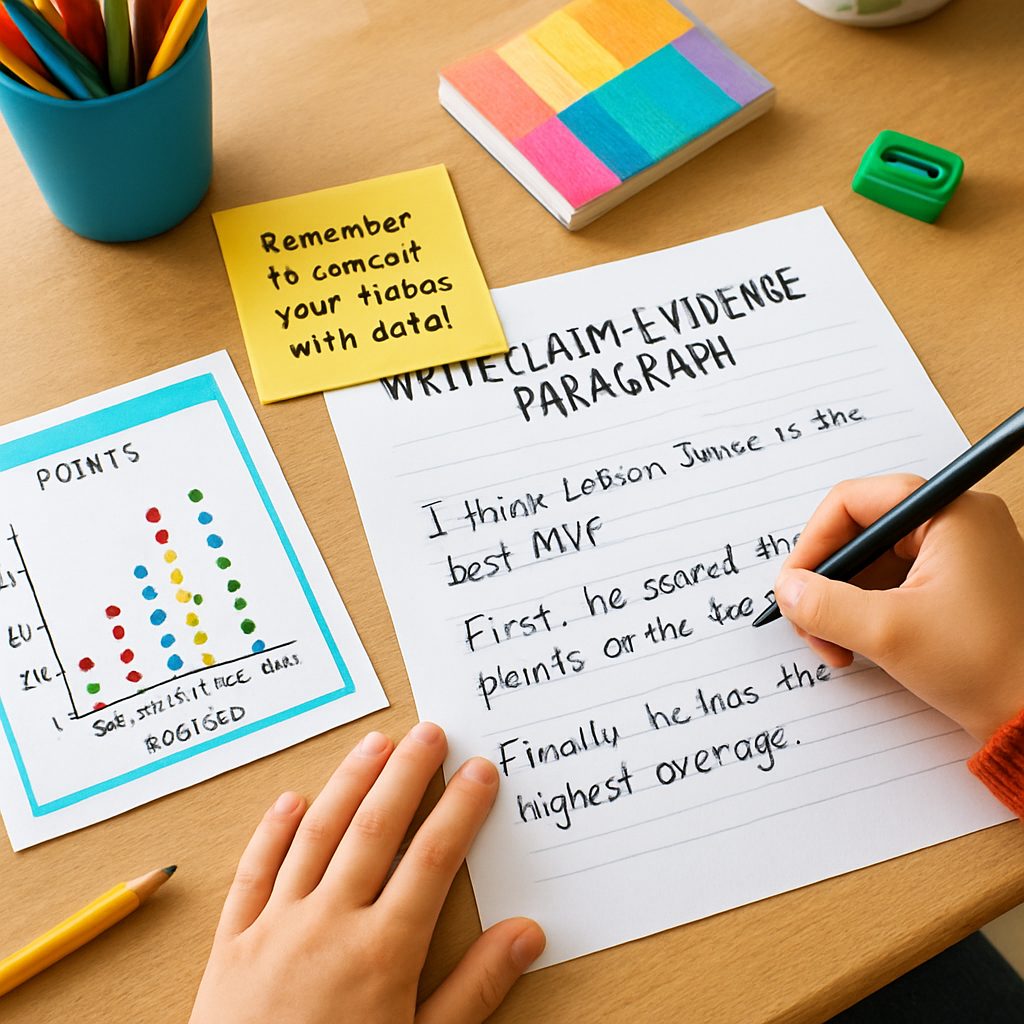
Students will be able to analyze statistical data and collaboratively present their findings to support their MVP choice.
Materials
| Item | Quantity |
|---|---|
| Player Stat Data Tables | 30 sheets (6 per group) |
| Calculators | 5 pieces (1 per group) |
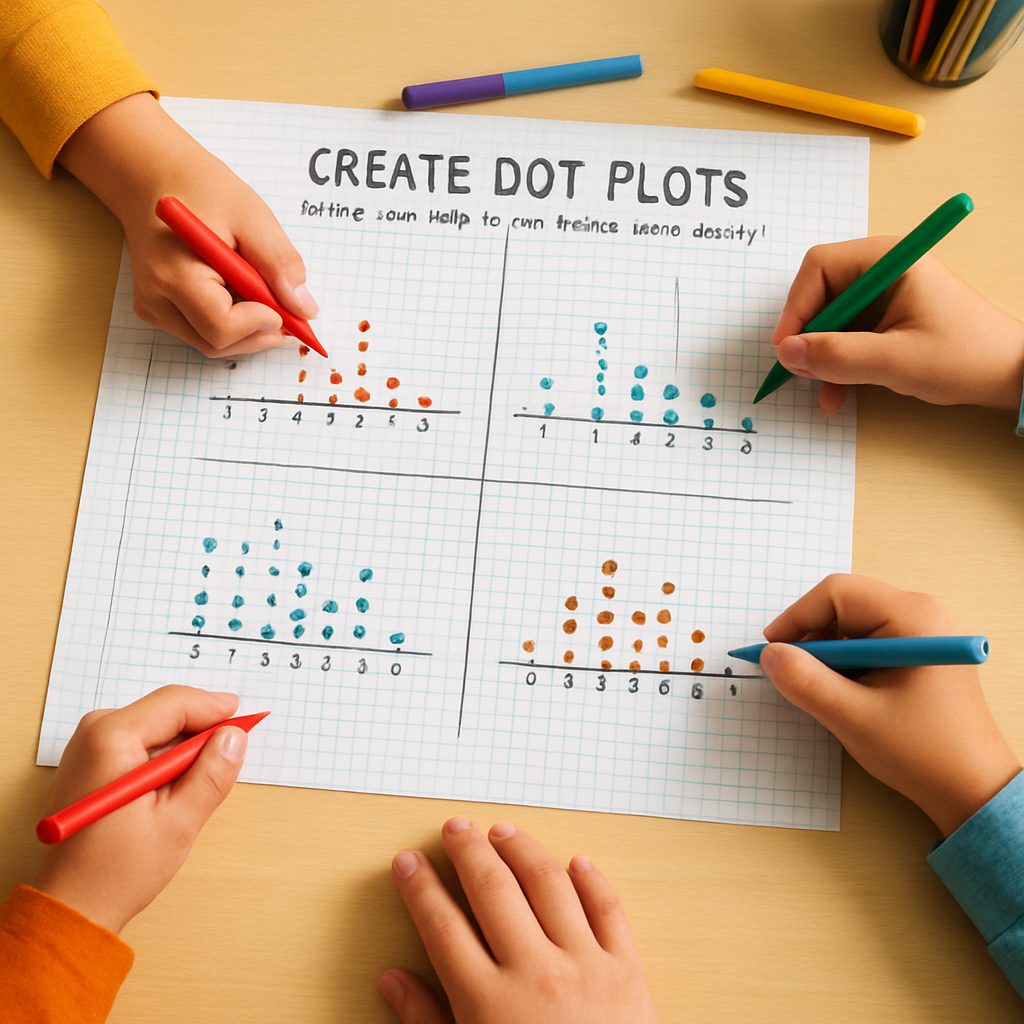
| Graph Paper | 20 sheets (4 per group) |
| Markers (assorted colors) | 20 pieces (4 per group) |
Vocabulary
Preparation
- Gather sports statistics for six top tournament players regarding goals, assists, minutes played, and passes.
- Prepare data tables for each group containing the relevant statistics.
- Set up technology for presentations (computers, projectors).
Introduction
Start with a 5-minute discussion on who they think is the best player of the tournament and why, encouraging students to share their thoughts.
What factors make a player valuable to their team?
How can statistics help us make decisions in sports?
Steps

Conclusion
Wrap up by discussing how statistics can influence decisions in sports, emphasizing how data can lead to different perspectives on who the MVP is and why.
Make your own lesson plan in minutes
Describe a topic and Resource Portal AI writes the objectives, materials and steps for your group.
Try Resource Portal AI