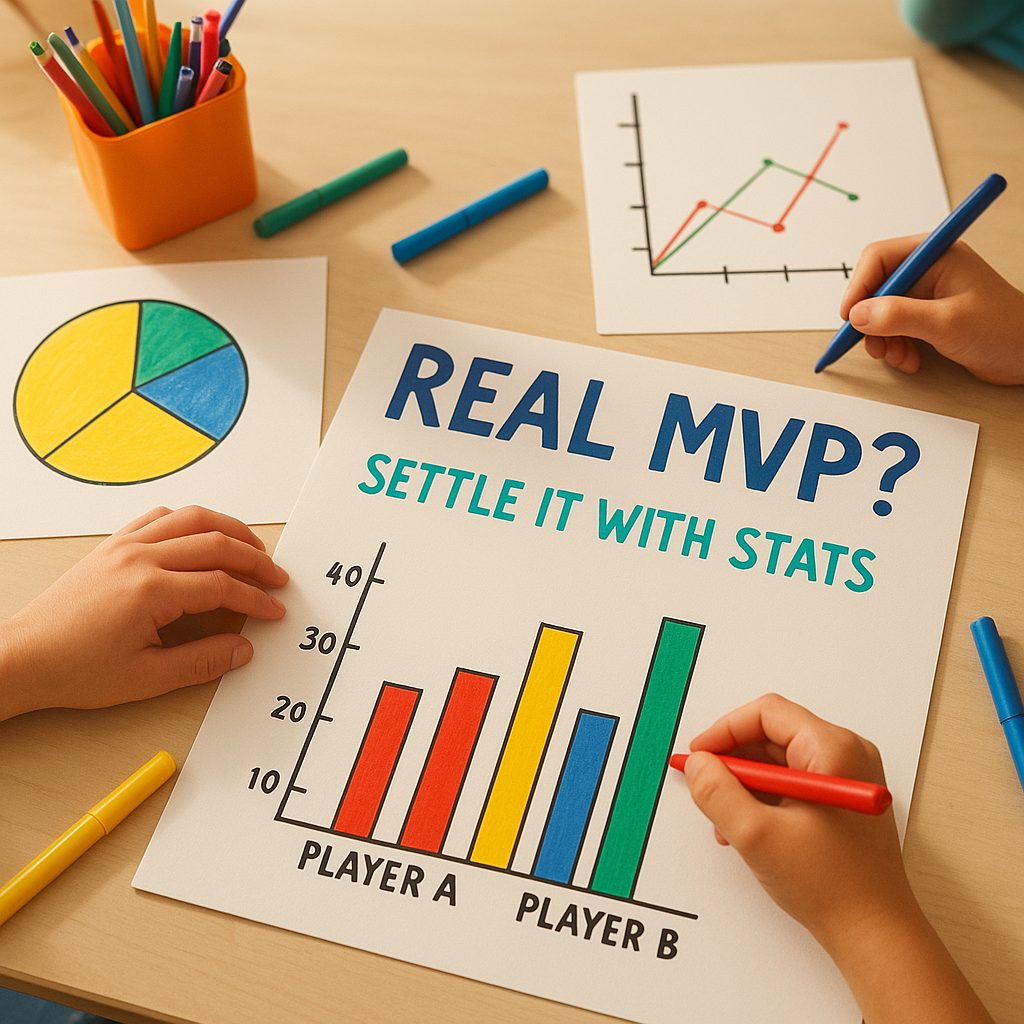
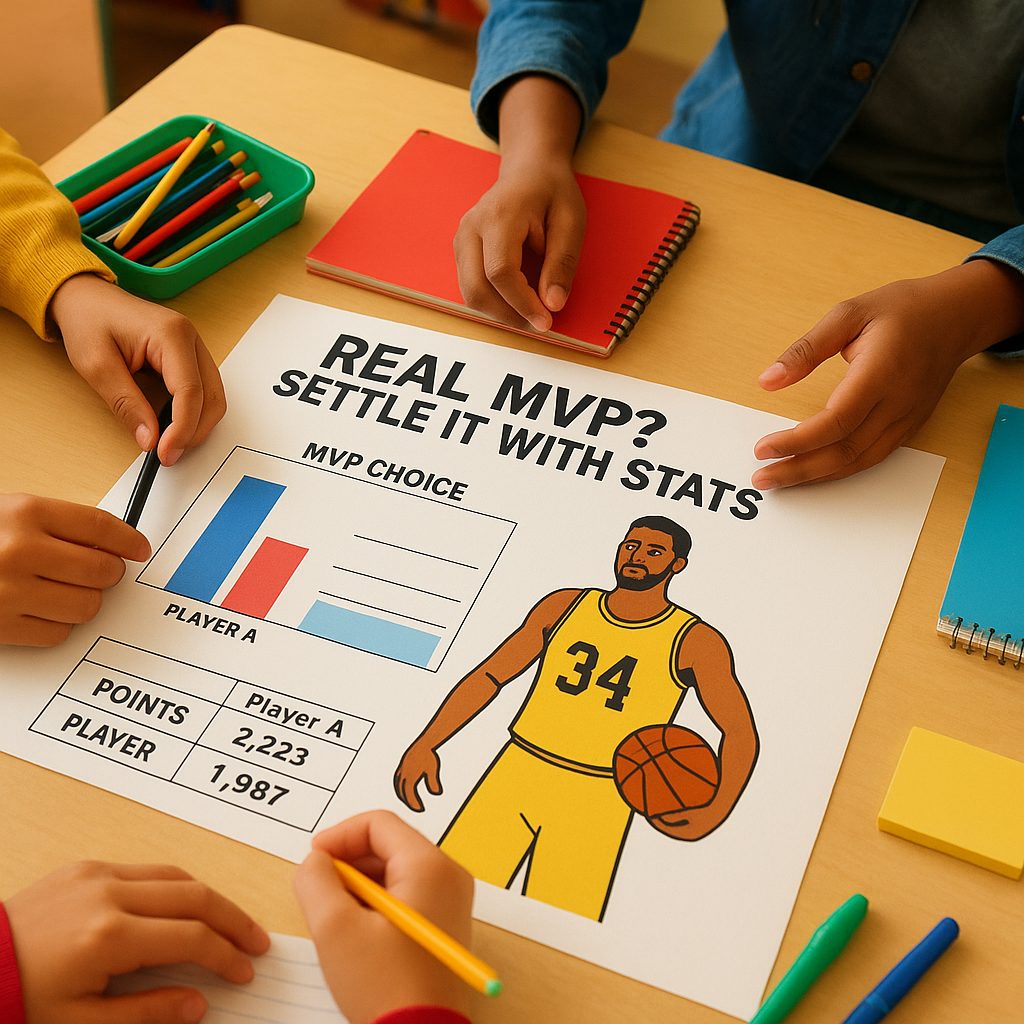
Real MVP? Settle It With Stats
Overview
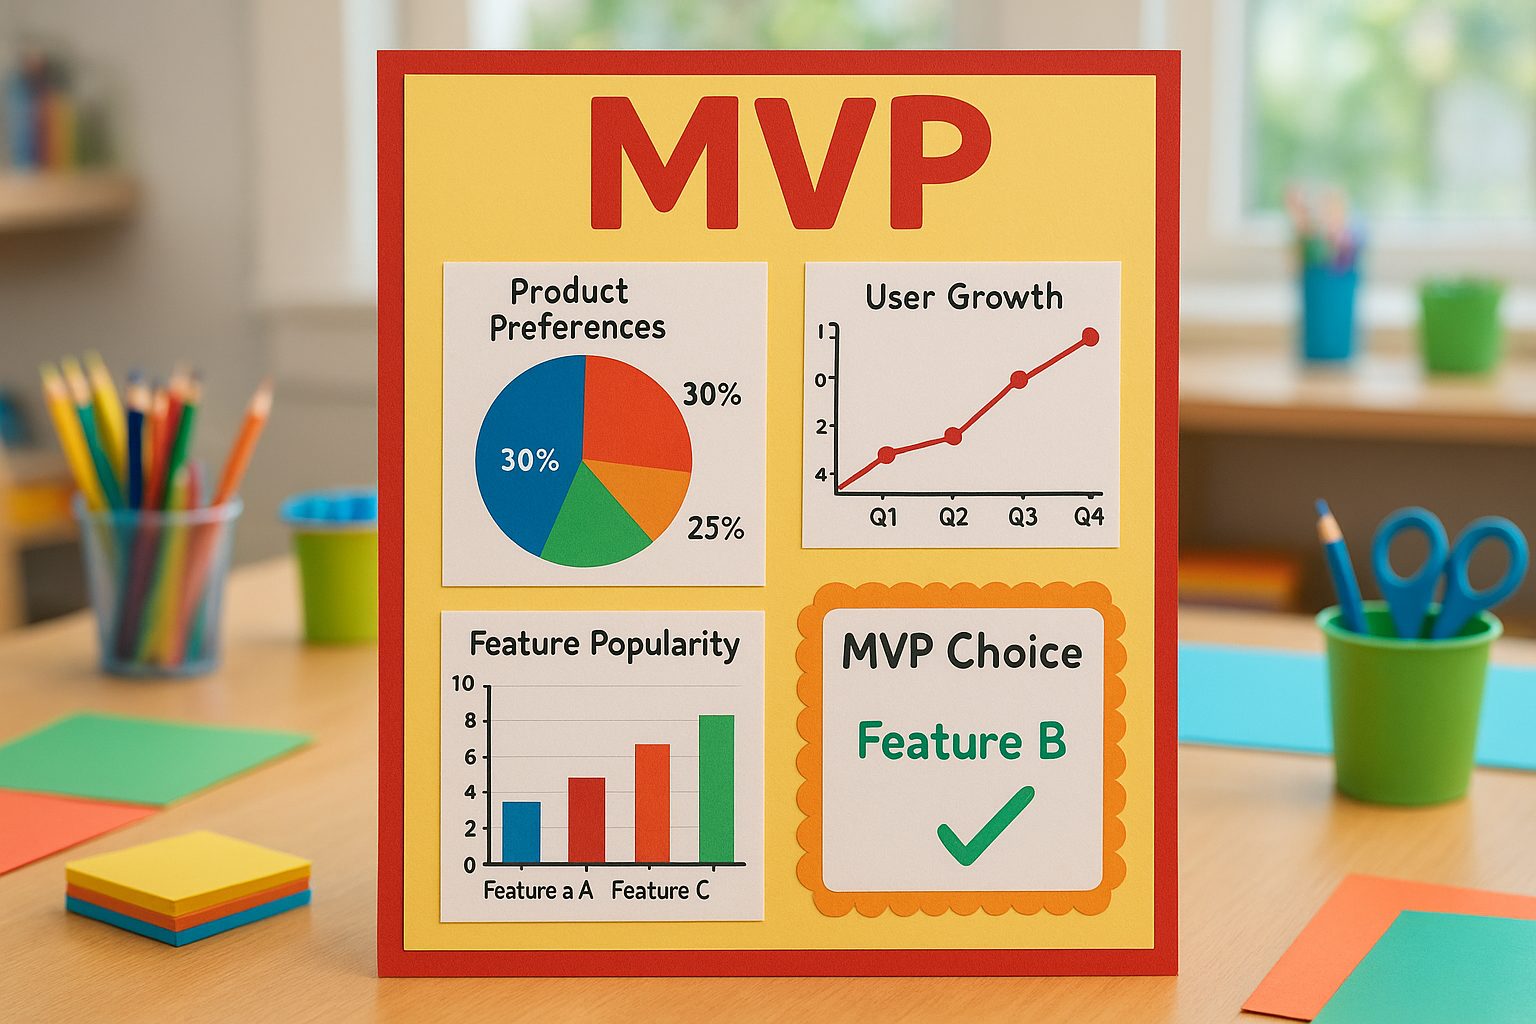
Students will engage in a collaborative project analyzing sports statistics to identify the MVP, enhancing their critical thinking and communication skills.
Description
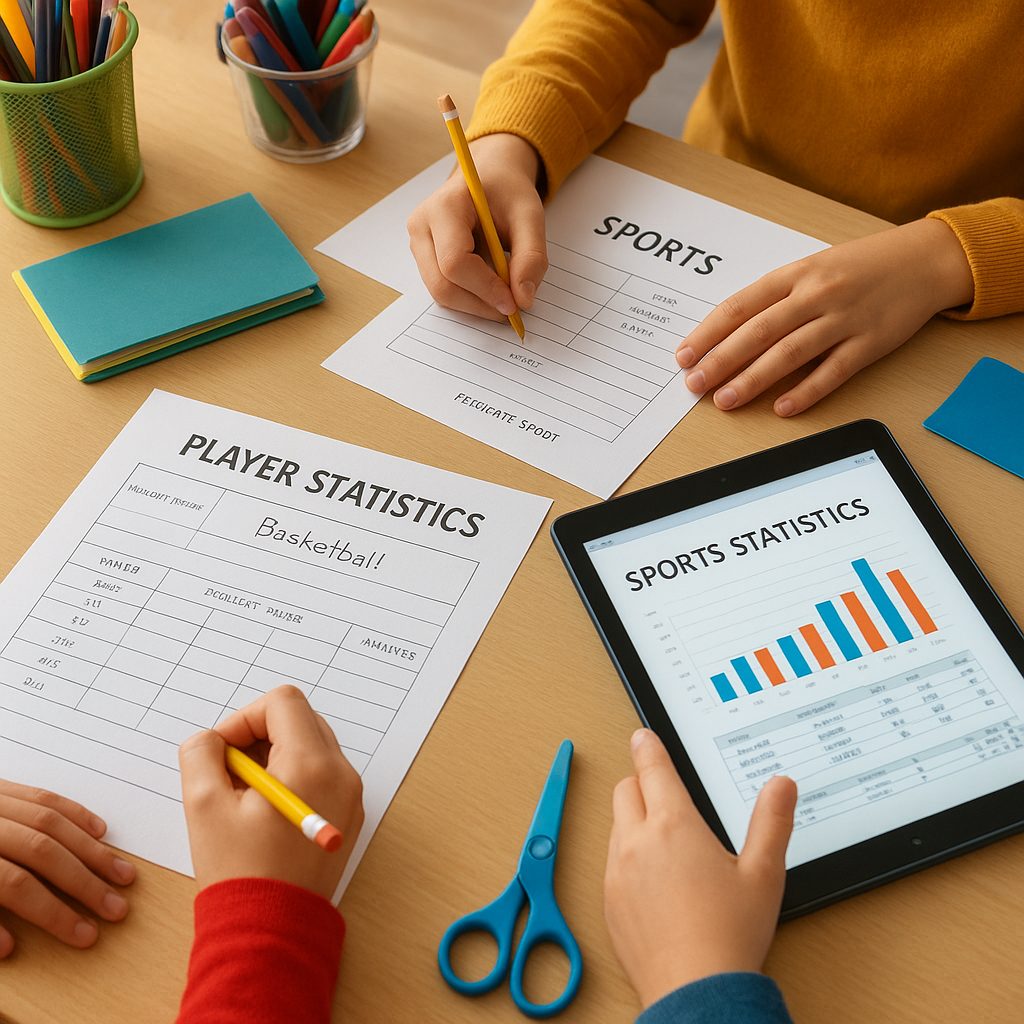
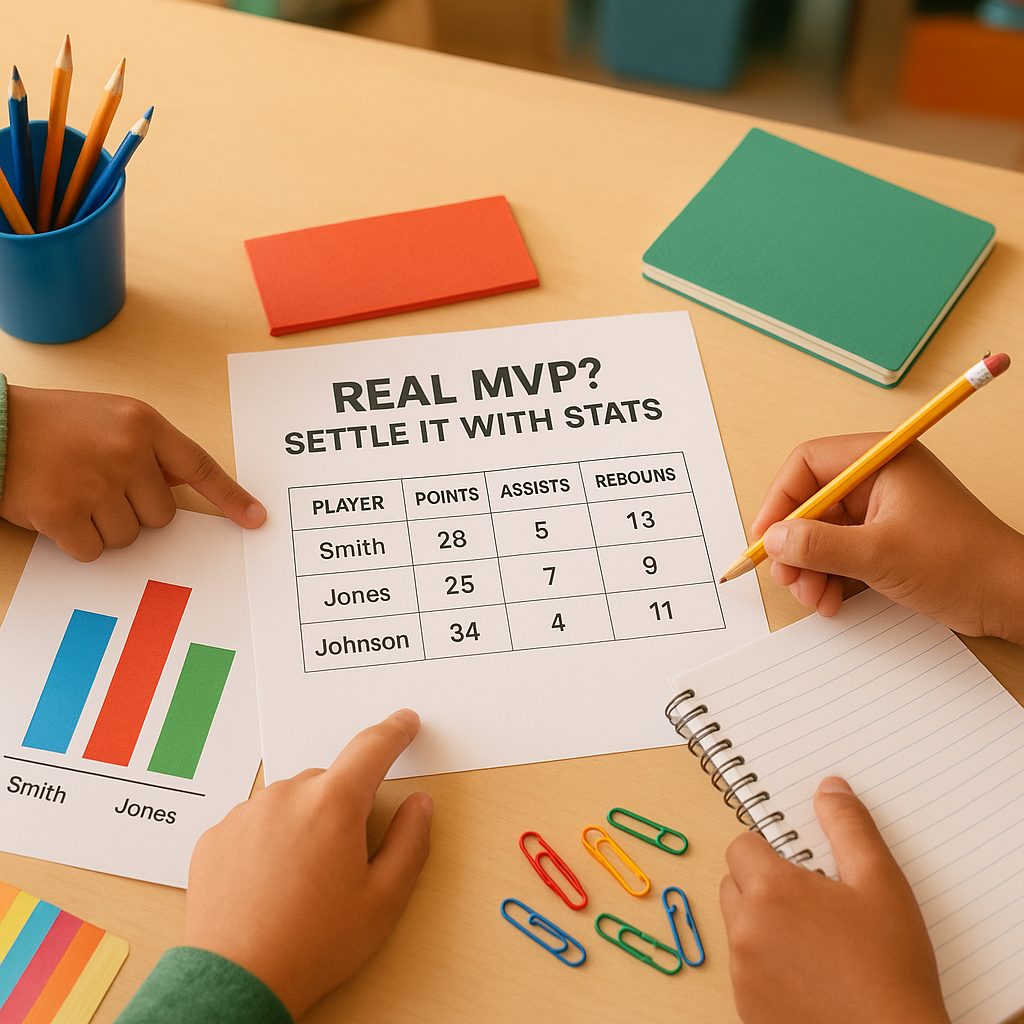
In this lesson, students will analyze statistics from their favorite sports players to determine who the real MVP is. They will work in groups to collect data, create visual representations, and present their findings to the class.
Objective
Students will collaboratively analyze sports statistics to determine the MVP, improving their data interpretation and presentation skills.
Materials
| Item | Quantity |
|---|---|
| Sports Statistics Data Sheets | 5 sheets |
| Markers | 10 pieces |
| Poster Boards | 5 pieces |
| Rulers | 5 pieces |
| Computers or Tablets | 10 units |
Vocabulary
Preparation
- Gather sports statistics data sheets and ensure they are relevant to students' interests.
- Prepare poster boards and markers for group presentations.
- Set up computers or tablets for data research and visualization.
Introduction
Show a short video clip highlighting outstanding performances from various athletes and their statistics to spark interest.
What does MVP mean in sports?
Why do you think statistics are important in determining who the MVP is?
Can you name a player you think deserves the MVP title and why?
Steps

Conclusion
Reflect on the importance of data in making informed decisions, discussing how statistics can change perceptions of performance in sports and beyond.
Make your own lesson plan in minutes
Describe a topic and Resource Portal AI writes the objectives, materials and steps for your group.
Try Resource Portal AI