Ocean Plastic Audit: What Percent of Our Trash Is Plastic?
Overview
Calculate what percent of your family's trash is plastic.
Description
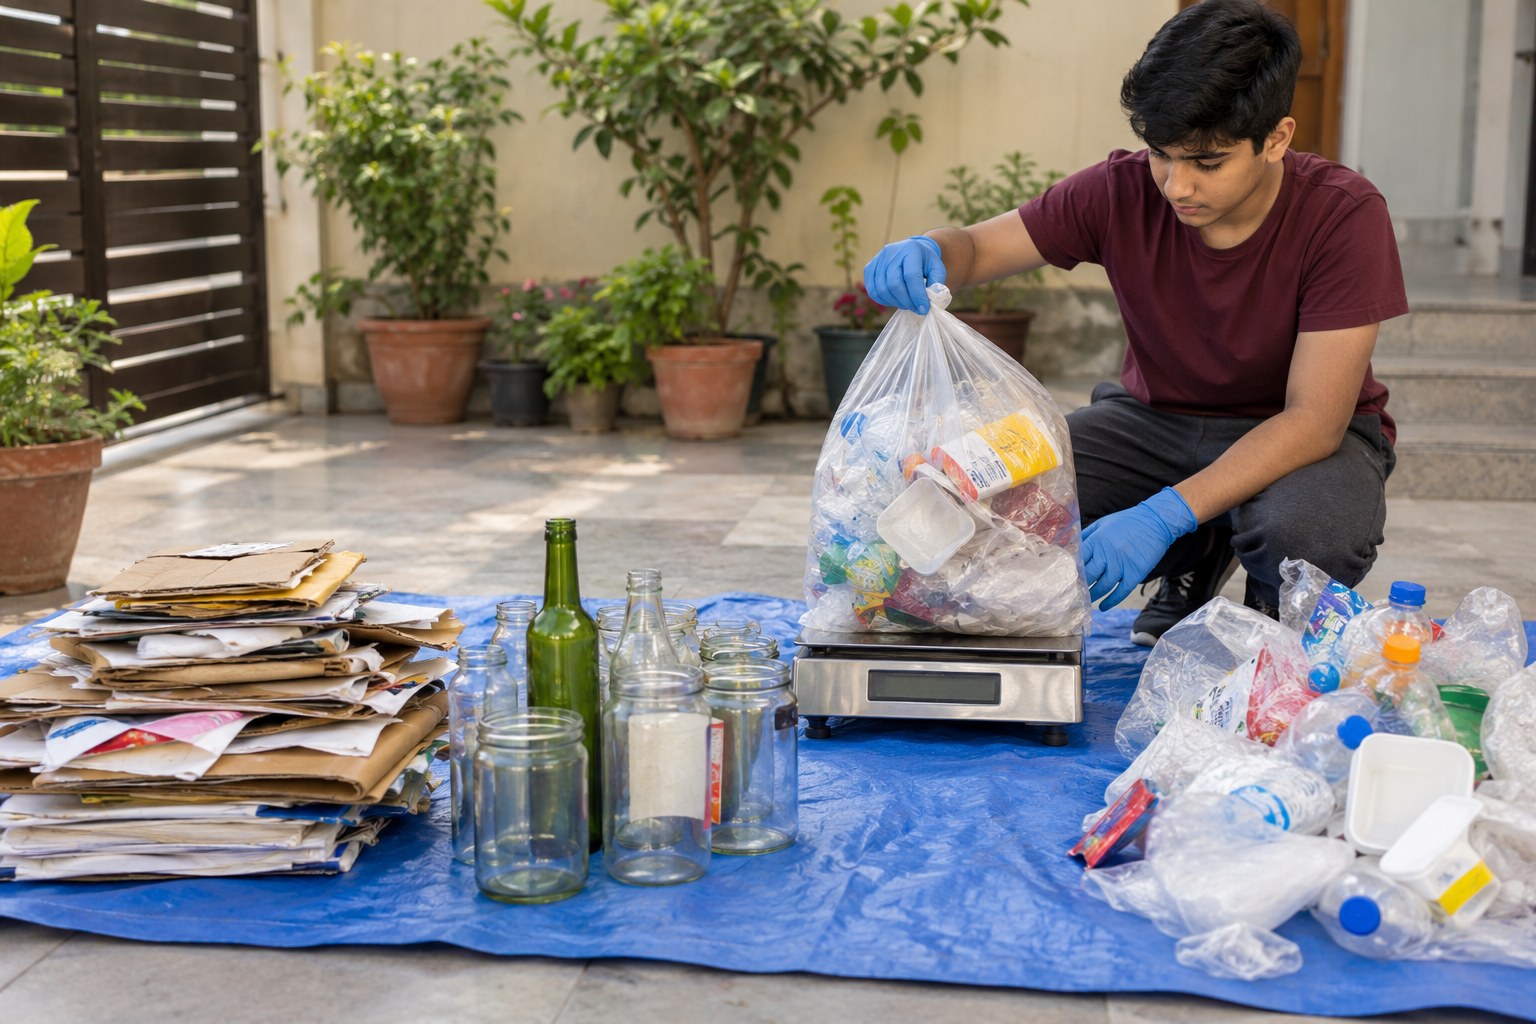
Your teen sorts and weighs a few days of household packaging (or uses the sample data), calculates the percent of the family's waste that is plastic by weight and by item count, projects a year's total, and figures out how a 25 percent cut would change the numbers, connecting the math to plastic that reaches the ocean.
Objective
Your teen will find percents of a total by weight and by count, use proportional reasoning to project yearly totals, and solve a multistep percent-decrease problem about household plastic.
Standards
Materials
| Item | Quantity |
|---|---|
| Household packaging and recycling collected over 2-3 days (clean and dry only), or the sample data | 1 bag or bin |
| Kitchen or bathroom scale (grams if possible) | 1 |
| Disposable or dish gloves | 1 pair |
| Old sheet, tarp or newspaper to sort on | 1 |
| Calculator, paper and pencil | 1 each |
| Sticky notes to label sorting piles | 5 |
Vocabulary
Preparation
- For 2 or 3 days, ask the family to drop clean packaging and recyclables into one bin instead of the trash. Do not collect food scraps, used tissues or anything sharp.
- Label sticky notes: Plastic, Paper and Cardboard, Glass, Metal, Other. If you skip collecting, print or copy the sample data.
Introduction
Hold up a single plastic bottle cap and ask: where does this go after it leaves our house? Scientists estimate millions of metric tons of plastic reach the ocean every year. How much of that kind of waste comes from one family like ours?
Which do you think is a bigger percent of our waste: plastic by weight, or plastic by number of items?
Why might plastic be especially harmful in the ocean compared with paper?
Steps
Conclusion
Ask: which percent surprised you more, by weight or by count? Lightweight plastic items are easy to blow away and wash into storm drains and rivers, which is one way plastic travels from neighborhoods to the ocean.
Make your own lesson plan in minutes
Describe a topic and Resource Portal AI writes the objectives, materials and steps for your group.
Try Resource Portal AI