Hurricane Tracker: Plot a Storm's Path on a Coordinate Grid
Overview
Plot a pretend hurricane's path with ordered pairs.
Description
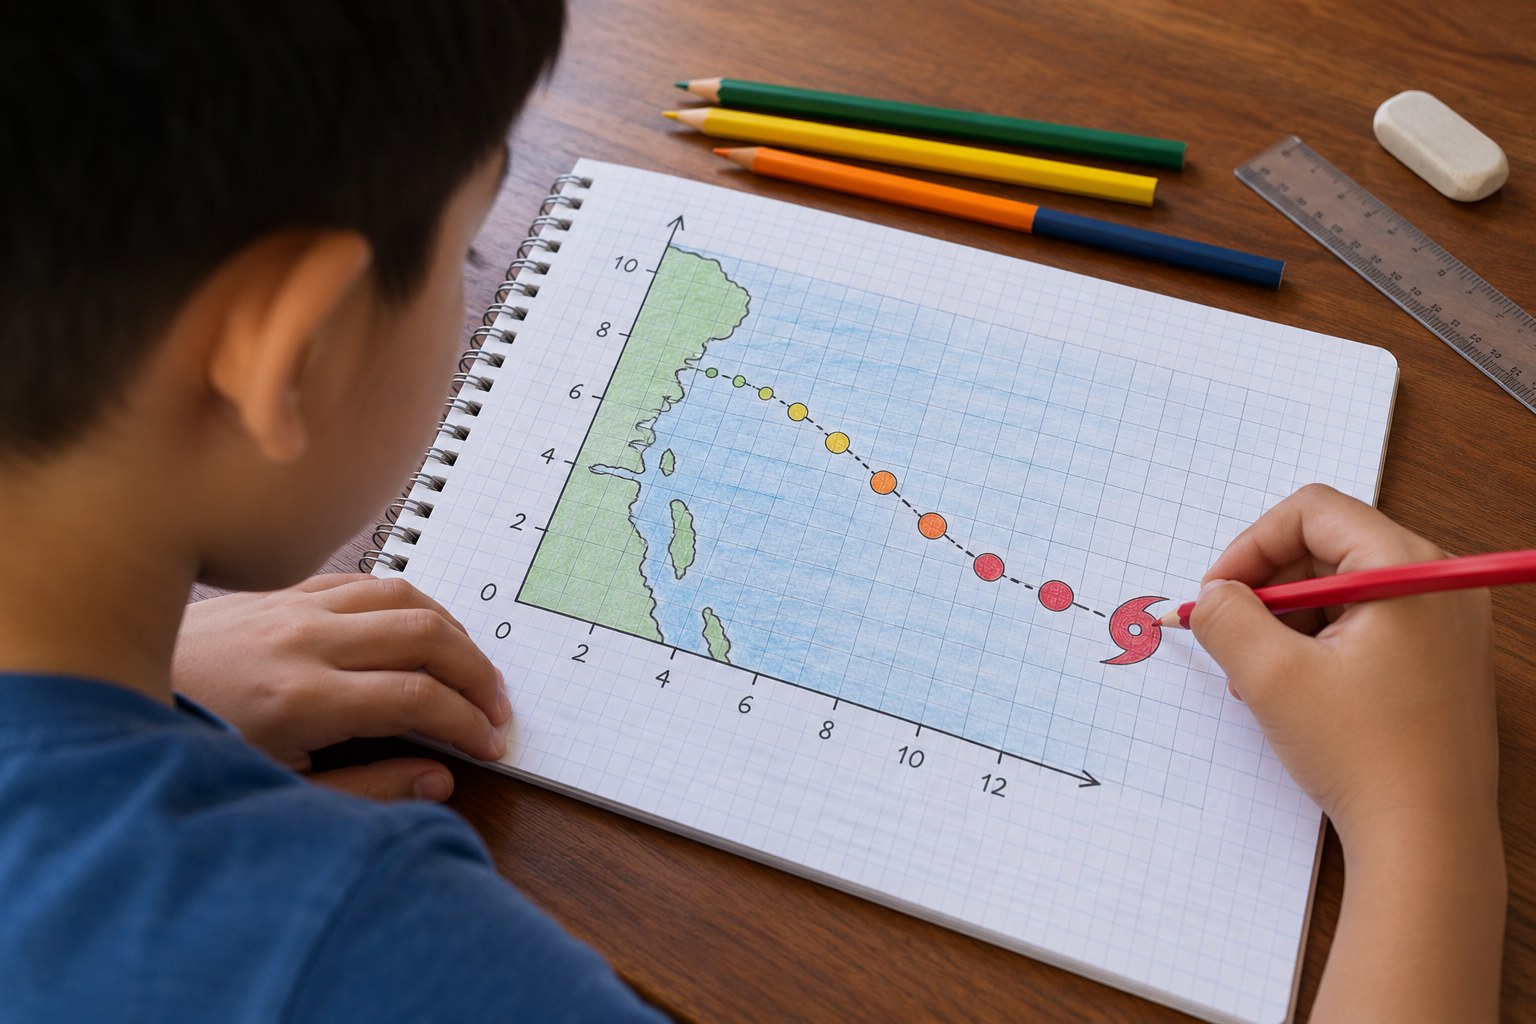
Your child plays hurricane forecaster, plotting a made-up storm's position every 6 hours as ordered pairs on a coordinate grid, connecting the path, finding landfall and labeling each point with its Saffir-Simpson category.
Objective
Your child will plot and interpret ordered pairs in the first quadrant to track a storm's movement, describe the path in terms of x and y distances, and classify wind speeds by hurricane category.
Standards
Materials
| Item | Quantity |
|---|---|
| Graph paper | 2 sheets per child |
| Ruler and pencil | 1 each |
| Colored pencils (red, orange, yellow, blue) | 1 set |
| Storm data table (in the section below) | 1 copy |
| Optional: a real hurricane tracking map printed from the National Hurricane Center website | 1 |
Vocabulary
Preparation
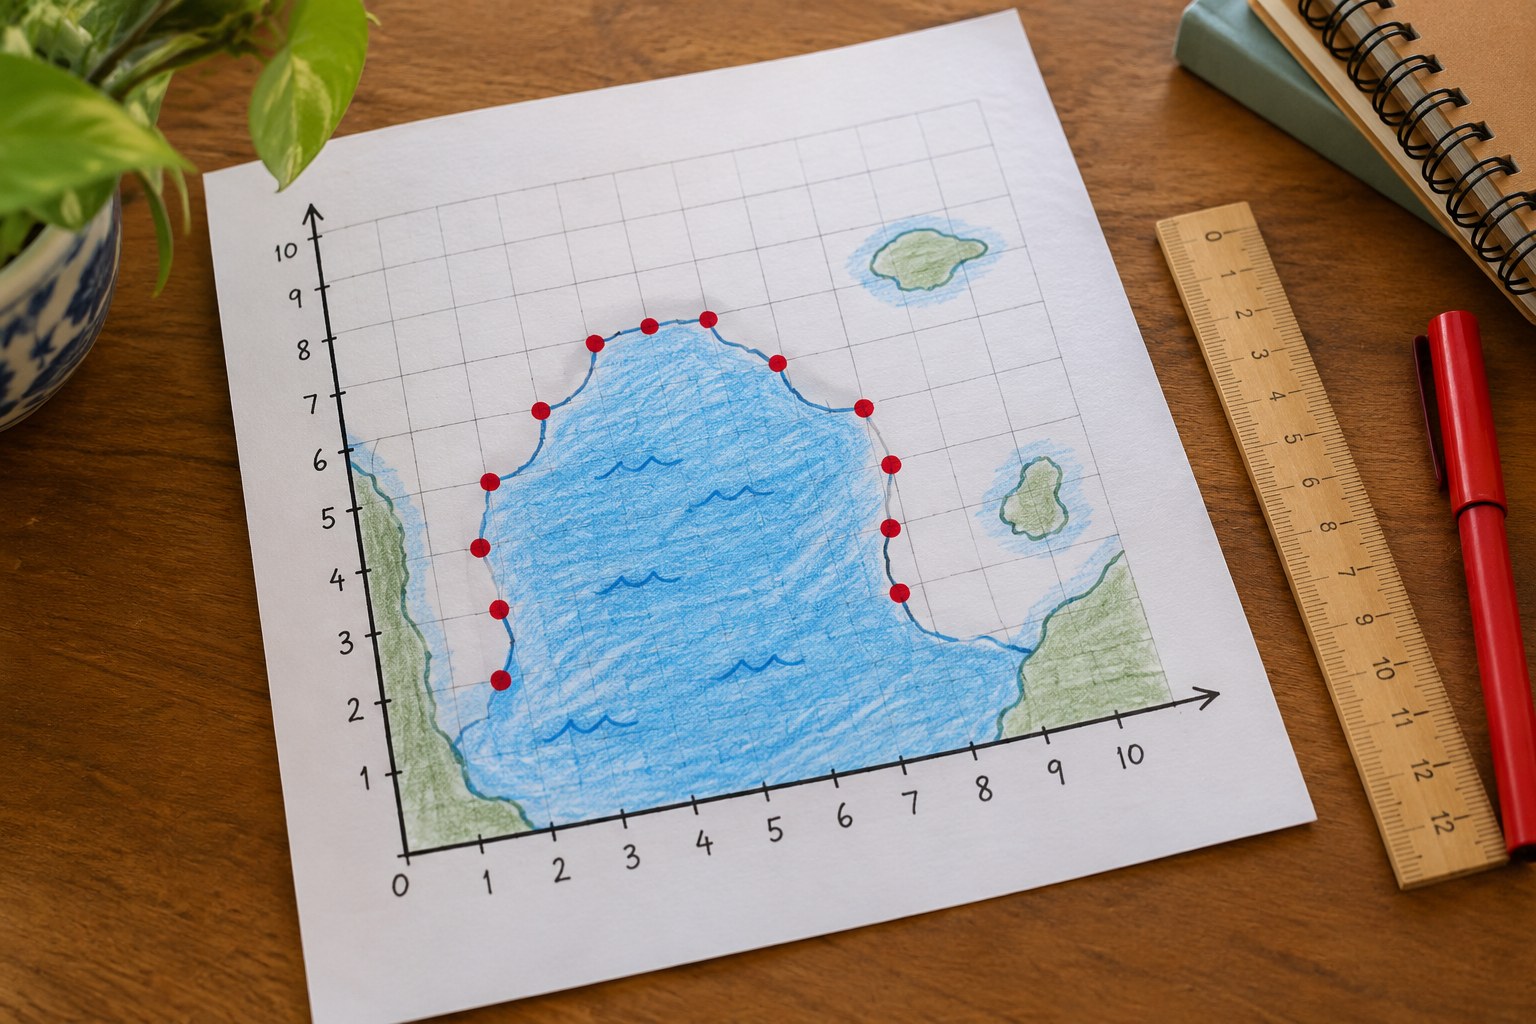
- On graph paper, draw an x-axis and y-axis from 0 to 10. Label the x-axis 'East' and the y-axis 'North.'
- Draw a wavy coastline across the grid along y = 8, and lightly shade the area above it as land. Copy the storm data table.
Introduction
Tell your child: you work at the hurricane center, and a storm called Hurricane Pip (a made-up storm) is spinning in the ocean. Every 6 hours a plane and satellite send you its location. Your job is to track it and warn the coast.
How do you think forecasters know where a hurricane is in the middle of the ocean?
Why would people on the coast want to know a storm's path days ahead?
Steps
Conclusion
Ask: what do the x-coordinate and y-coordinate each tell you about the storm? Look at a real hurricane tracking map during hurricane season and find the dots and the path.
Make your own lesson plan in minutes
Describe a topic and Resource Portal AI writes the objectives, materials and steps for your group.
Try Resource Portal AI