Amazon Deforestation by the Numbers
Overview
Calculate percent change in Amazon forest loss from real data.
Description
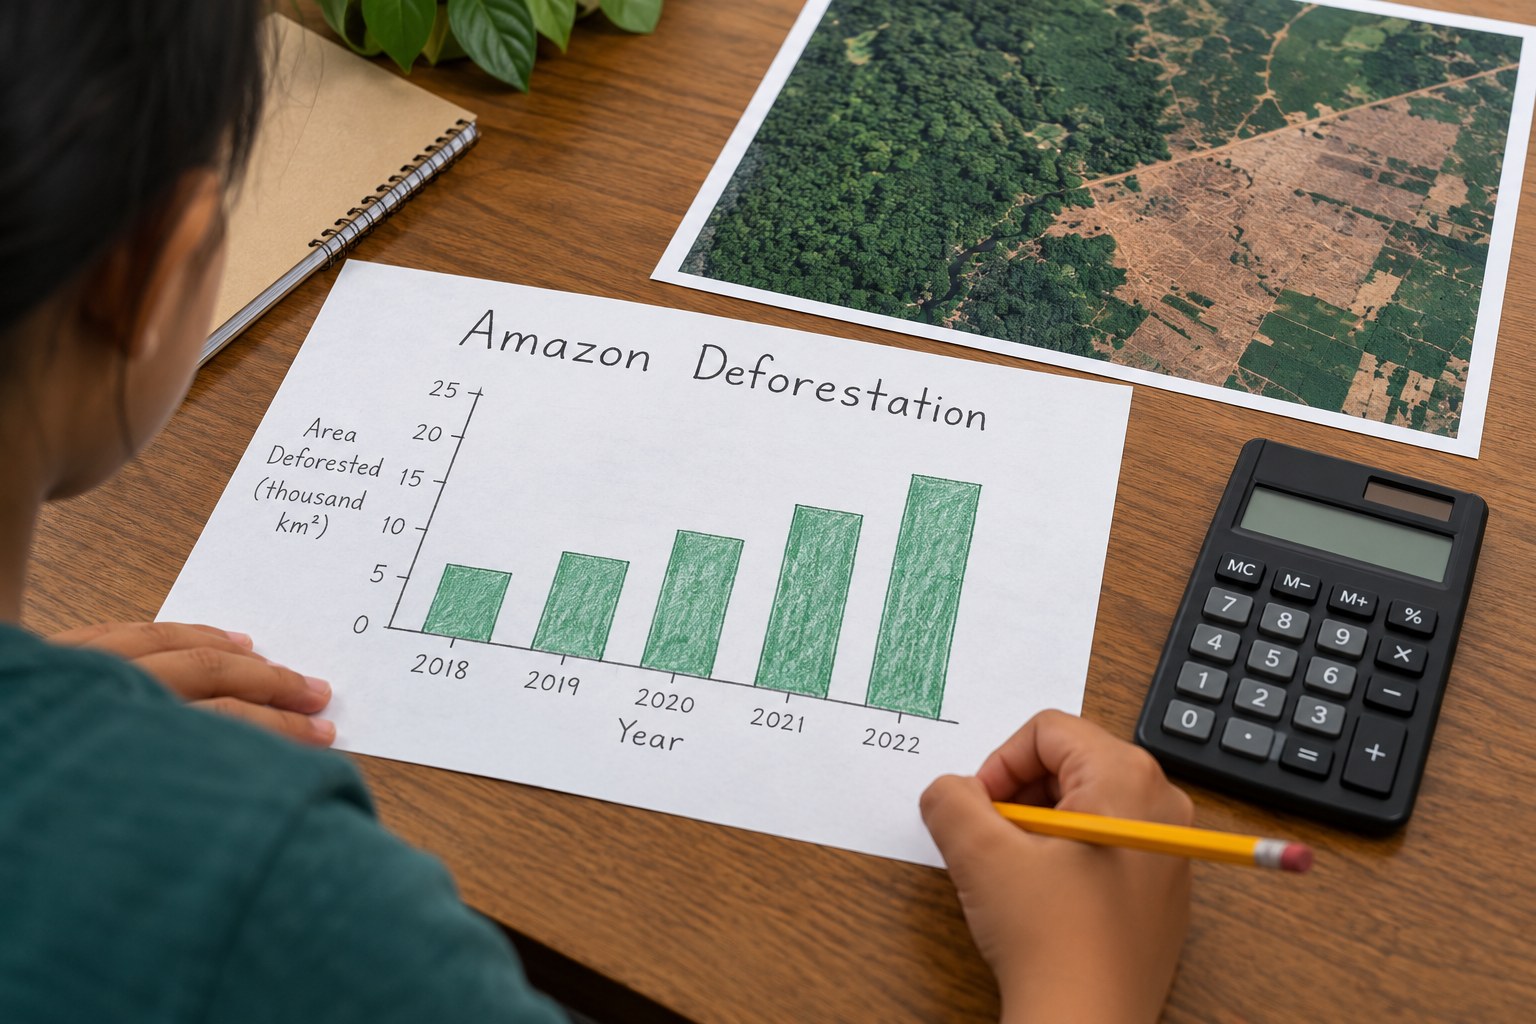
Your teen works with rounded satellite data on yearly forest loss in Brazil's Amazon, calculating percent decrease and percent increase between key years, converting square kilometers into soccer fields per day, and explaining what the numbers show about conservation policies.
Objective
Your teen will solve multistep percent problems, including percent increase and decrease, using real rounded deforestation data, and interpret the results in context.
Standards
Materials
| Item | Quantity |
|---|---|
| Data table in Additional Sections | 1 copy |
| Calculator | 1 |
| Graph paper | 2 sheets |
| Pencil and ruler | 1 each |
| Colored pencils | 2 colors |
Vocabulary
Preparation
- Copy the data table and the problem set from Additional Sections.
- Review the percent change formula: (new - original) / original x 100. For a group, partners can split the problems and then check each other's work.
Introduction
Tell your teen: in 2004, an area of Brazilian Amazon forest about the size of Massachusetts was cleared in one year. Within eight years, that number dropped dramatically. Today we find out by how much, and what happened next.
Why would scientists use satellites instead of counting trees on the ground?
If something goes from 100 to 50, what is the percent decrease? What if it goes from 50 to 100?
Steps
Conclusion
Ask: what was the biggest percent change you found? What might explain it? Look up this year's figure from Brazil's space agency together and compute the newest percent change.
Make your own lesson plan in minutes
Describe a topic and Resource Portal AI writes the objectives, materials and steps for your group.
Try Resource Portal AI